


Abstract
Drug resistance is increasingly among the main issues affecting human health and threatening agriculture and food security. In particular, developing approaches to overcome target mutation-induced drug resistance has long been an essential part of biological research. During the past decade, many bioinformatics tools have been developed to explore this type of drug resistance, and they have become popular for elucidating drug resistance mechanisms in a low cost, fast and effective way. However, these resources are scattered and underutilized, and their strengths and limitations have not been systematically analyzed and compared. Here, we systematically surveyed 59 freely available bioinformatics tools for exploring target mutation-induced drug resistance. We analyzed and summarized these resources based on their functionality, data volume, data source, operating principle, performance, etc. And we concisely discussed the strengths, limitations and application examples of these tools. Specifically, we tested some predictive tools and offered some thoughts from the clinician’s perspective. Hopefully, this work will provide a useful toolbox for researchers working in the biomedical, pesticide, bioinformatics and pharmaceutical engineering fields, and a good platform for non-specialists to quickly understand drug resistance prediction.
Introduction
Drug resistance is the toughest challenge in drug discovery and development, as it affects global human health and threatens agriculture and food security [1–3]. The emergence of drug resistance is a well-known phenomenon in the use of medicine and pesticide. In the medical field, clinical drug resistance renders the treatment of diseases more complex and expensive. For example, among patients who have failed antiretroviral therapy (ART) based on non-nucleoside reverse transcriptase inhibitors (NNRTIs), the resistance level to commonly used NNRTIs ranges from 50% to 97% [4]. Moreover, the World Health Organization estimates that resistant infections are already killing at least 700 000 people per year and will cause 10 million deaths per year and a 3.8% reduction in the annual gross domestic product (GDP) by 2050 if no action is taken to control drug resistance [5, 6]. In agriculture, many pesticides are gradually becoming ineffective due to the evolution of pests [7]. For example, over 553 insect species have developed resistance to 331 insecticides since the first report on insect resistance in 1914 [8]. Therefore, there is an urgent demand to overcome drug resistance.
Mutation in drug targets is a key cause of drug resistance, leading to a significant decrease in treatment effectiveness [9–13]. Due to the I4734M mutation in the ryanodine receptor (RyR), the flubenamide resistance of Spodoptera frugiperda is 5400 times higher than that of the susceptible population [14, 15]. Since the T790M mutation in the epidermal growth factor receptor (EGFR), ˃50% of patients with lung cancer have become resistant to first-generation EGFR inhibitors [16–19]. Moreover, the fungal pyrimethanil resistance is related to cytochrome b gene (cyt b) mutations, and the resistance index of the cyt b G143A mutation is generally over 100 [20]. Hence, there is a dire need to overcome drug resistance mediated by target mutation.
In recent decades, a broad variety of tools have been developed to study drug resistance induced by target mutation [21–24]. Pires et al. proposed a database of mutational impacts on protein–ligand affinities (Platinum), which is helpful to develop novel in silico predictive approaches [25]. Sun et al. developed the Predicting the Effects of Mutations on Protein–Ligand Interactions (PremPLI), which estimates the impacts of single-point mutations on changes in ligand binding affinity and identifies potential resistance mutations [26]. In addition, Portelli et al. used the mutation Cutoff Scanning Matrix-ligand (mCSM-lig) to quantify the effect of mutations on protein affinities to rifampicin, which helps understand the potential mechanisms underlying rifampicin-resistant mutations [27]. Overall, these bioinformatics tools have reached a sufficient level of scientific maturity to facilitate the development of novel inhibitors that are less susceptible to drug resistance. Nevertheless, the excavation and utilization of these resources are scarce, and the collection and discussion of these available resources remain insufficient.
In this review, we systematically surveyed 59 freely available bioinformatics tools and explored their application in overcoming drug resistance induced by drug target mutation (Figure 1). We comparatively analyzed and summarized these resources based on their functionality, data volume, data source, operating principle and performance. In addition, we discussed the application cases, merits and limitations of these bioinformatics tools in biological research. Specifically, we tested some predictive tools and offered some thoughts from the clinician’s perspective. We hope that our work could assist researchers in related fields such as biomedical, pesticide and pharmaceutical to apply appropriate bioinformatics tools for studying drug resistance events. It may also serve as a systematic knowledge repository for non-specialists to understand some concepts of drug resistance.
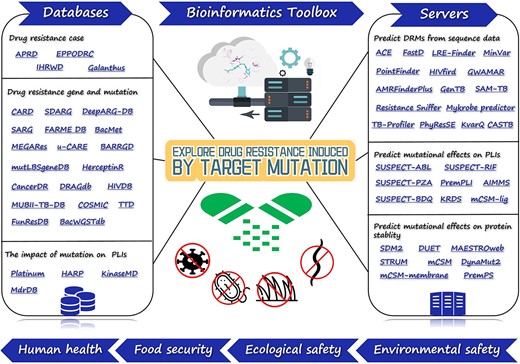
Sketch map of bioinformatics toolbox for target mutation-induced drug resistance research. We systematically surveyed 59 bioinformatics tools, which includes databases that provide information on the drug resistance cases, genes, mutations and the effects of mutations on PLIs, and servers for predicting the DRMs from sequence data, the effects of mutations on PLIs and the effects of mutations on protein stability. These tools may provide a toolbox for researchers working in the pesticide, biomedical, bioinformatics and pharmaceutical engineering fields, and good platforms for non-specialists to quickly understand drug resistance prediction.
Drug resistance data
The prevalence of drug resistance and the advances in sequencing technologies and genome mining algorithms have led to an exponential increase in the amount of the available drug resistance data [28]. Numerous databases with comprehensive information have been developed, such as databases on drug resistance cases, genes, and the impacts of mutations on protein–ligand interactions (PLIs). These databases not only promote the development of in silico methods that are capable of predicting drug resistance mutations (DRMs), but also contribute to the in-depth understanding of the mechanism of drug resistance driven by target mutation.
Databases of drug resistance cases
The worldwide frequency of drug resistance events around the world has prompted the derivation of many databases of drug resistance cases. These databases provide information on the time, place, species, sites of action, modes of action (MoAs) and the links to the primary literature accessible for each drug resistance event. They help researchers understand the genes associated with drug resistance, discover the regularity of drug resistance occurrence and uncover the underlying mechanisms of drug resistance. Herein, we analyzed and compared some databases based on their functionality, data volumes and data sources (Table 1).
Drug resistance case databases
| Database/URL | Brief description | Main purpose | Data sources | Statistics | Functions | Advantages | Limitations | Rank | |||
|---|---|---|---|---|---|---|---|---|---|---|---|
| Cases | Trca | Yearb | Otherc | ||||||||
| Contain single pesticide type | |||||||||||
| APRD https://www.pesticideresistance.org/ | Arthropod pesticide resistance case database | For use by resistance management practitioners | Publications | 17 000 | – | 1908–2022 | 180 counties, 612 species, 349 compounds, 52 MoAs | Search | Covers the most countries and the most drug resistance cases | Lack of data download capability | 1 |
| IHRWD http://www.weedscience.org/ | Herbicide resistance case database | Maintain scientific accuracy | Publications | 513 | 208 | 1982–2022 | 267 weed species, 165 herbicides, 96 crops, 72 countries | Search, browse, download | The most professional and popular herbicide resistance case database | Lacks statistical analysis of the data and the presentation of its analysis | 2 |
| Contain multiple pesticide types | |||||||||||
| EPPODRC https://resistance.eppo.int/ | Pesticide resistance case database | Share information on resistance cases | FRAC, Weed Science, IRAC | 484 | 263 | 1960–2022 | 57 MoAs, 138 pests, 100 crops, 13 countries | Download | Each case contains the most comprehensive information (29 data items) | Lacks statistical analysis of the data and the presentation of its analysis | 3 |
| Galanthus http://en.galanthos.gr/ | Pesticide resistance database of Greek | For the main pests of Greek Agriculture | Publications | 70 | – | 2000–2022 | 2127 bioassays, 493 biochemicals, 909 moleculars | Search | Each case contains detailed bioactivity test data | Low accessibility and no function to download data | 4 |
aIn order to facilitate users to have a more intuitive understanding of each database, we scored the listed databases according to the following three criteria. (i) The number of cases: 50–500 scores 5 points, 501–5000 scores 10 points, 5001–50 000 scores 15 points. (ii) Time range: 20–50 years scores 5 points, 51–80 years scores 10 points, 81–110 years scores 15 points. (iii) The number of countries: 1–70 scores 5 points, 71–140 scores 10 points. 141–210 scores 15 points. Final score: APRD: 45 points, IHRWD: 30 points, EPPODRC: 25 points, Galanthus: 15 points. Rank the databases from highest to lowest score: APRD, IHRWD, EPPODRC, Galanthus.
bThe number of target resistance case.
cThe year of first detection of the resistance case.
The drug resistance case databases can be divided into two categories based on the type of drugs included therein, i.e. single type and multiple types. As shown in Table 1, the Arthropod Pesticide Resistance Database (APRD) [29] and the International Herbicide-Resistant Weed Database (IHRWD) [30] contain only insecticides and herbicides, respectively. The Galanthus [31] and the European and Mediterranean Plant Protection Organization Database on Resistance Cases (EPPODRC) [32] contain multiple pesticide types, such as herbicides, insecticides and fungicides. APRD, which contains the globally reported incidents of insecticide resistance, was designed for online case submission, reviewing, searching and reporting. Brevik et al. used the resistance events listed in APRD to test for differences among species, and found that arthropod species exhibited a significant variation in how rapidly they developed resistance to new insecticides, moreover, they showed that insecticide durability did not vary according to MoA or year of introduction [33]. IHRWD stores herbicide-resistant weed events reported worldwide, with the outstanding advantages of being the most professional and popular herbicide resistance database, nevertheless, it lacks a statistical analysis of the numerous data and the presentation of their analysis. Both APRD and IHRWD allow users to submit cases, whereas only authorized users can submit cases to APRD. APRD, IHRWD and Galanthus support search functions, and IHRWD and EPPODRC support browsing functions. Unfortunately, the lack of download capability is a limitation of both APRD and Galanthus. In turn, one of the significant advantages of EPPODRC lies in that it provides the most comprehensive information (containing 29 data items) for each case, including case ID, pesticide type/chemical group/active substance, year (first year/date last updated), country/geographic distribution, MoA, resistance mechanism, resistance frequency, pest and crop common name/scientific name/EPPO code and resistance management guidance, etc. Moreover, the greatest advantage of Galanthus is that each case indexed in this database includes detailed bioactivity test data. With the except of EPPODRC, all of these databases can be used directly without registration and login. However, data sharing is not common in the medical field, where researchers tend to keep data as a private preserve [34]. Thus, it’s difficult to summarize the database of medical resistance cases. Nevertheless, these databases are useful for aiding in drug resistance management, contributing to the worldwide effort to reduce hunger and improving human and animal health and food security.
To gain a broader understanding of these databases, we also compared their data volumes and sources (Table 1). Regarding the data volumes, APRD incorporates 17 000 cases from 180 countries, 52 MoAs and 612 species since 1908. IHRWD contains 513 cases from 72 counties, 267 weed species and 165 herbicides since 1982. EPPODRC encompasses 484 cases from 13 countries, 57 MoAs and 138 pests since 1960. Finally, Galanthus comprises 2127 bioassays, 493 biochemicals and 909 molecules from 70 Greek studies since 2000. Based on the data mentioned above, it appears that EPPODRC and Galanthus contain relatively few resistance cases from a relatively small number of countries. If users cannot find the resistance cases they need in these two databases, perhaps they can use APRD, because APRD covers the greatest number of countries and the most drug resistance cases. In addition, APRD contains the greatest number of insecticide resistance cases, and IHRWD contains the greatest number of herbicide resistance cases. Regarding the data sources, the cases of APRD are documented by both field detection and laboratory selection, and the strength of this database relies upon the expertise of the manuscripts reviewers. The cases of IHRWD and Galanthus are drawn from scientific publications and tend to have good quality. The cases included in EPPODRC are collected from other organizations such as the Fungicide Resistance Action Committee, Insecticide Resistance Action Committee and Weed Science. In summary, the databases described above provide abundant and reliable information for consultation by users.
To provide a more intuitive understanding of each database to the users, we scored the listed databases according to the following three criteria (Table 1). (i) The number of cases: 50–500 scores 5 points, 501–5000 scores 10 points and 5001–50 000 scores 15 points. (ii) Time range: 20–50 years scores 5 points, 51–80 years scores 10 points and 81–110 years scores 15 points. (iii) The number of countries: 1–70 scores 5 points, 71–140 scores 10 points and 141–210 scores 15 points. Final score: APRD: 45 points, IHRWD: 30 points, EPPODRC: 25 points, Galanthus: 15 points. Therefore, we obtained the following database ranking: APRD > IHRWD > EPPODRC > Galanthus. Nevertheless, this rank varies from person to person and users can re-rank and select the databases according to their research interests and focus.
Based on the analysis indicated above, the currently available drug resistance case databases still need to be improved. First, these databases contain a great amount of data but lack statistics and analysis of data. The display of the results (figures or tables) of data statistics and analysis in the database interface would greatly improve its quality and interface friendliness. Second, databases of human drug resistance cases are sorely lacking, and it is a worthwhile endeavor for researchers to provide detailed resistance data while protecting the privacy of patients. If these two common limitations can be addressed, these drug resistance case databases will be more widely used in practical research.
Databases of drug resistance genes
Drugs exert strong selective pressures on many rapidly evolving systems (including viruses, bacteria, fungi and human cancers), which has led to the emergence of many databases of drug resistance genes [35–37]. These databases contain genes and mutations associated with drug resistance. They play an important role in sequence comparison and alignment, supporting an adequate knowledge of drug target mutations and help identify the residues that lead to drug resistance. Here, we analyzed and compared some of these databases based on their functionality, data volume and data redundancy.
According to the type of drug resistance gene, databases can be divided into general and specific (Table 2). The general drug resistance gene databases contain multiple species and multiple drugs. The most representative of these is the Comprehensive Antibiotic Resistance Database (CARD), which stores information on antibiotic resistance genes (ARGs), their products and phenotypes [38–40]. CARD is a great data-sharing platform contributed by volunteers for real-time data updates. But its genomic sequences have been assembled from clinical bacterial isolates, including a few functional metagenomic sequences. Fortunately, the Functional Antibiotic Resistance Metagenomic Element Database (FARME DB) is the first repository for environmentally derived metagenomic genes [41]. In addition, the Sequence Database for Antibiotic Resistance Genes (SDARG) [42], DeepARG-DB [43], the Structured Antibiotic Resistance Genes (SARG) [44, 45] and the Bacterial Antimicrobial Resistance Reference Gene Database (BARRGD) [46] are also ARGs databases. However, the aforementioned databases rarely include mutation data. As a remedial ground, the Mutated Ligand Binding Site Gene DataBase (MutLBSgeneDB) is the first database that contains all human ligand binding site mutations with bioinformatic analyses [47]. Moreover, the Therapeutic Target Database (TTD) [48], the Human Immunodeficiency Virus Drug Resistance Database (HIVDB) [34, 49], the Cancer Drug Resistance Database (CancerDR) [50], the Catalogue Of Somatic Mutation In Cancer (COSMIC) [51] and DRAGdb [52] also contain mutation data. The specific drug resistance gene databases are either drug-specific or species-specific tools. The Antibacterial Biocide and Metal Resistance Genes Database (BacMet) stores information on antibacterial biocide resistance genes and metal resistance genes [53]. However, it is tailored for smaller-scale gene function analysis using highly descriptive annotations, which is not beneficial for the analysis of massive ecological sequence data sets. In contrast, MEGARes provides the basis for developing high-throughput acyclic sorters and hierarchical statistical analyses of big data [54, 55]. Furthermore, HerceptinR is the first database developed to understand herceptin resistance [56]. In turn, u-CARE [57], FunResDb [58, 59] and MUBII-TB-DB [60] are species-specific drug resistance gene databases focused on Escherichia coli, Aspergillus fumigatus and Mycobacterium tuberculosis, respectively. These databases connect previously genetic determinants of drug resistance with the resistance phenotypes they afford to organisms and can greatly assist researchers in unraveling resistance mechanisms to inform disease treatment and drug development.
Drug resistance gene databases
| Database/ URL | Descriptiona | Data sources | Statistics | Advantages | Limitations | Year | ||||
|---|---|---|---|---|---|---|---|---|---|---|
| Genes | Mutations | Targets | Drugs | Other | ||||||
| General drug resistance gene databases | ||||||||||
| CARD http://arpcard.mcmaster.ca/ | Comprehensive information on ARGs | GenBank, NCBI, PubMed, PDB, PubChem | 3057 | 1468 | – | 311 | 1929 SNPs, 4967 nucleotide sequences, 4865 protein sequences, 5046 AMR detection models, 263 pathogens | The most representative database of ARG | Includes a few functional metagenomic sequences | 2013, 2017, 2020 |
| SDARG http://mem.rcees.ac.cn:8083/ | Sequence database of ARGs | ARDB, NCBI, GenBank, BLDB, Literature | 448 | – | – | 18 b | 1260,069 protein sequences, 1164,479 nucleotide sequence | Contains the largest number of drug resistance sequences | No classification by species | 2019 |
| DeepARG-DB http://bench.cs.vt.edu/deeparg | Database of ARGs | CARD, ARDB, Uniprot | 14,933 | – | – | 102 | 30 antibiotic categories, 2149 groups | Contains ARGs predicted with a high degree of confidence and extensive manual inspection, greatly expanding current ARG repositories | Low accessibility | 2018 |
| SARG http://smile.hku.hk/SARGs | Database of ARGs sequences | CARD, ARDB, NCBI-NR | 12,307 | – | – | 24c | 1227 subtypes, 11 469 protein sequences | Contains sequences from the latest protein collection of the NCBI-NR database | Unable to browse data online | 2018 |
| FARME DB http://staff.washington.edu/jwallace/farme/ | Functional AR metagenomic element database | GenBank, Pfam, Environmental samples | 8478 | – | – | – | 48 178 protein sequences, 5 biome categories, 7 AR categories, 20,724 DNA sequences | The first database to focus on functional metagenomic AR gene elements | Contains fewer antibiotic classes | 2017 |
| BARRGD https://www.ncbi.nlm.nih.gov/bioproject/313047 | ARGs database of bacterial | CARD, ResFinder, Lahey | 6155 | – | – | – | 1686 publications, >560 HMMs | Contains sequence for representative DNA sequences that encode proteins conferring resistance to various antibiotics | Lack of more detailed classification of data | 2016 |
| TTD https://idrblab.org/ttd/ | Database of therapeutic targets | Published studies | – | 782 | 3578 | 38,760 | 199 proteins targeted by 236 drugs which are used for treating 67 diseases | The first online database providing free information on drug targets | Provide mutation details that need to be manually adjusted to obtain resistance sequences | 2002–2022 |
| mutLBSgeneDB http://zhaobioinfo.org/mutLBSgeneDB | Database of genes having ligand binding site mutations | TCGA, BioLiP, DrugBank, ClinVar, PubChem | 3146 | 12,000 | 744 | 1324 | 10,108 ligand binding sites | The first database containing comprehensive annotations for all genes having ligand binding site mutations | The database interface can be further optimized | 2016 |
| COSMIC http://cancer.sanger.ac.uk/cosmic | Catalogue of somatic mutations in cancer | Literature | 86 | 582 | 86 | 28 | 2270 resistant samples | The largest source of expert manually curated somatic mutation information relating to human cancers | Lack of information on changes in affinity between the protein and the drug before and after the mutation | 2004–2018 |
| CancerDR http://crdd.osdd.net/raghava/cancerdr/ | Database of cancer drug resistance | COSMIC, CCLE, PubChem, UniProt, TTD | 116 | 1356 | 116 | 148 | 1000 cancer cell lines | Contains all the 3D structures involved in the target and their MTs | The data were updated until 2013 | 2013 |
| HIVDB https://hivdb.stanford.edu/ | Database of HIV drug resistance | Published studies | – | 234 | – | – | 4 types of inhibitors, ˃450,000 protein sequences | The largest and the most widely used online resource for HIV drug resistance | Lack of information on changes in affinity between the protein and the drug before and after the mutation | 2010 |
| DRAGdb http://bicresources.jcbose.ac.in/ssaha4/drag/ | Database of mutational data of drug resistance-associated genes | Literature | 12 | 4653 | 12 | 6 | 126 bacterial species | With more data than MuBII-TB-DB | Contains a large number of unavailable PROVEAN_scores | 2020 |
| BacWGSTdb http://bacdb.cn/BacWGSTdb | Database for bacterial WGS typing and source tracking | Literature | – | – | – | – | 20 bacterial species | Provides a one-stop solution to epidemiological outbreak analysis and pioneer the movement of WGS | No sequence information of drug resistance genes | 2016, 2021 |
| Species-specific or drug-species drug resistance gene databases | ||||||||||
| BacMet http://bacmet.biomedicine.gu.se/ | Antibacterial biocide & metal resistance genes database | PubMed, NCBI, UniprotKB, TCDB | 156 253 | – | – | 111 | 43 chemical classes | Contains antibacterial biocide- and metal-resistance genes | The data were updated until 2018 | 2014 |
| MEGARes https://megares.meglab.org/ | Antimicrobial resistance database for population-level profiling | ARG-ANNOT, CARD, ResFinder, NCBI, PubMed | 8000 | – | – | – | 57 references | Provides the basis for developing high-throughput acyclic classifiers and hierarchical statistical analysis of big data | The browsing interface can be further optimized | 2017, 2020 |
| u-CARE http://www.ebioinformatics.net/ucare/ | ARGs database of E. coli | Literature | 107 | – | – | 52 | – | Detailed data statistics and analysis information are available | No mutation resistance data | 2015 |
| HerceptinR http://crdd.osdd.net/raghava/herceptinr/ | Herceptin resistance database | PubMed, CCLE, CancerDR, Uniprot | 29 | 632 | 8 | 111 | 2500 assays, 30 cell lines | Specialized herceptin resistance database | The data were updated until 2014 | 2014 |
| MUBII-TB-DB http://umr5558-bibiserv.univlyon1.fr/mubii/mubii-select.cgi/ | Database of the resistance mutations of M. tuberculosis | GenBank, literature, TBDReaM | 8 | 358 | 8 | 6 | – | The system is quick and easy to use, even for technicians without bioinformatics training | The data were updated until 2013 | 2014 |
| FunResDb https://sbi.hki-jena.de/FunResDb/ | Database of CYP51A-dependent azole resistance | Literature, GenBank | 1 | 59 | 1 | – | 79 CYP51A variants | Users of FunResDb can always check the original publications | As a fungal resistance database, only one fungus (A. fumigatus) is included | 2017 |
aARGs: Antimicrobial Resistance Genes.
b18 categories of antibiotics.
c24 different antibiotic types.
To further understand the drug resistance gene databases, we compared the functional annotation information and website functions of the previously mentioned databases. In Figure 2A, most of the databases are shown to contain gene name/ID/symbol, protein/nucleotide sequence, mutation information, reference, etc. Expressly, mutLBSgeneDB provides the most comprehensive annotation information, which includes gene symbol/ID/name, Uniprot ID, family, expression, pathway, PubMed ID, GO ID, PDB ID, protein 2D/3D structure, etc. All databases but FARME DB and HIVDB support the search function, all databases but DeepARG-DB, HIVDB, FunResDb and MUBII-TB-DB have browsing functions, and all databases but BacWGSTdb, MUBII-TB-DB and FunResDb have a download function. Furthermore, most databases are configured with other tools such as the Basic Local Alignment Search Tool (BLAST). For a more detailed comparison, see Figure 2A.
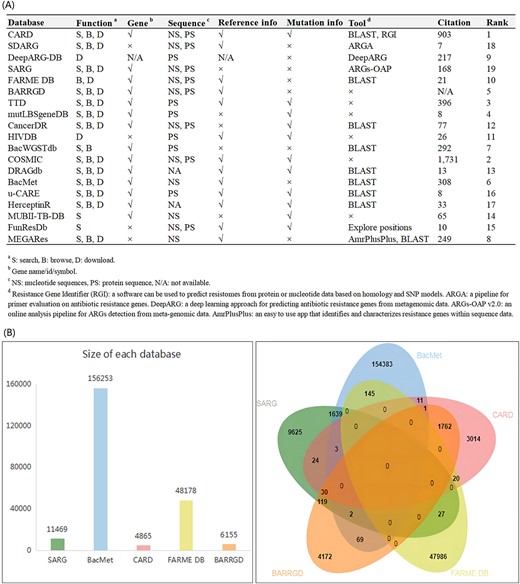
In-depth analysis of drug resistance gene databases. We compared the functional annotation information and website functions of the databases, then we ranked these databases based on a comparative analysis (A). The data redundancy analysis of SARG, BacMet, CARD, FARME DB and BARRGD. The redundancy data of SARG and BacMet reached 1644, and the redundancy data of CARD and BARRGD reached 1793 (B).
The comparison of data volumes and the analysis of data redundancy are the main focus of user attention. As shown in Table 2, CARD includes 4967 nucleotide sequences and 4865 protein sequences, FARME DB retains 20,724 nucleotide sequences and 48 178 protein sequences, with ⁓10 times the number of protein sequences compared with CARD. BacMet contains the largest number of drug resistance genes, up to 156 253. As shown in Figure 2B, the redundancy data of SARG and BacMet reached 1644, and the redundancy data of CARD and BARRGD reached 1793. HIVDB is the largest and the most widely used online resource for HIV drug resistance and includes 450 000 protein sequences. For a more detailed comparison, see Table 2.
Although great strides have been made in this setting, drug resistance gene databases still face various limitations. First, the lack of standardization among drug resistance gene databases and of efficient and sustainable curation pipelines hold back their potential [61]. Second, most databases focus on resistance genes and mutations in microorganisms, and few databases focus on resistance genes and mutations in pests and plants. In summary, the limitations listed above need to be addressed urgently to maintain these databases in the right direction.
Databases of the effects of mutations on PLIs
Although the impacts of mutations have been collected in relational databases, until most recently, a few integrated and extensive databases that can compile the impacts of mutations on PLIs are accessible [25]. Such databases incorporate data on the affinity variations between wild-type (WT) and mutant (MT) proteins and ligands caused by mutations. They help to understand the impact of polymorphisms in disease and to identify those polymorphisms that lead to the evolution of drug resistance [25]. Therefore, we analyzed and compared some databases based on their functionality, data source and data volume (Table 3).
Databases of the impacts of MT PLIs
| Database/ URL | Brief description | Main data sources | Statistics | Advantages | Limitations | Year | ||||
|---|---|---|---|---|---|---|---|---|---|---|
| Targets | Mutations | Mutations in binding site | PLIs | Other | ||||||
| General databases | ||||||||||
| Platinum http://biosig.unimelb.edu.au/platinum/ | Protein–ligand affinity change upon mutation database | Literature | 451 | 1008 | 748 | 560a | 207 ligands, 250 complexes, 797 point mutations, 182 papers | The first comprehensive storage that provides information on changes in PLIs upon mutations | The data were updated until 2015 | 2015 |
| MdrDB https://quantum.tencent.com/mdrdb | Mutation-induced drug resistance Database | calculated | 240 | 2503 | – | – | 5119 PDB structures, 440 drugs | Contains mutation types of single substitution, multiple substitution and complex substitution | No browse function | 2022 |
| Specific databases | ||||||||||
| HARP https://harp-leprosy.org/ | Database of predicted impacts of mutations in drug targets | Predicted by other softwares | 3 | 80,902 | – | – | – | Inform the impacts of known and emerging mutations on protein–ligand, protein–protein and protein-nucleic acid affinity | No search function | 2020 |
| KinaseMD https://bioinfo.uth.edu/kmd/ | Database for kinase mutations and drug response | CCLE, GDSC, TCGA, ICGC, COSMIC | 545 | 679,374 | – | 274 b | 137 drugs | Contains the average IC50 value of the drug treatments in cell lines before and after the kinase mutations | No data of DRM details | 2021 |
aAffinities given in Kd.
bAffinities given in IC50.
These databases can be classified as general and specific based on the protein systems that they encompass. Platinum [25] and the Mutation-induced drug resistance DataBase (MdrDB) [62] are general-type databases that contain a wide variety of protein systems. Platinum is the first comprehensive storage that provides information on changes in PLIs upon mutation [25]. It correlates ligand affinity data with structural information, experimental methods and ligand properties, thus allowing users to design novel structure-guided computational approaches to quantify the affinity changes in mutations. Using Platinum, many prediction methods have been created, such as PremPLI, mCSM-lig and SPLDExtraTrees [63]. However, Platinum only contains data up to 2015. If users cannot find the latest data in Platinum, they can use MdrDB. MdrDB is a newly developed database of information related to the changes in protein–ligand affinity caused by mutations in protein structure [62]. It brings together WT protein–ligand complexes, MT protein–ligand complexes and binding affinity changes upon mutation (ΔΔG). The Hansen’s Disease Antimicrobial Resistance Profiles (HARP) [64] and the Kinase Mutations and Drug Response (KinaseMD) [65] are of the specific type because they focus on specific protein systems. HARP is a database that contains drug-target affinity changes due to mutations in Mycobacterium leprae [64]. Its advantage is the ability to inform the impacts of known and emerging mutations on PLIs. In addition to providing specific affinity values, the overall impact of the mutation is also listed. KinaseMD provides information about kinase mutations with distinctive annotations on drug response, specifically on drug resistance [65]. For example, it contains the average IC50 values of the drug treatments in cell lines before and after the kinase mutations. In conclusion, these databases help to advance our understanding of mutation-induced drug resistance, the development of combination therapies and the discovery of novel chemicals.
Data volumes and sources are the main factors employed by users to choose databases. As shown in Table 3, Platinum collected 1008 mutations, 451 PDB IDs, 250 protein–ligand complexes and 560 affinities given in Kd. MdrDB contains 100 537 samples generated from 2503 mutations, 440 drugs and 5119 PDB structures of 240 proteins. HARP collected three target proteins and 80 902 mutations. And KinaseMD integrates the greatest number of mutations (679 374), 545 kinases, 137 drugs and 274 affinities given in IC50. Regarding the data sources, the data in Platinum are obtained from published research papers (experimentally measured), the data in KinaseMD stem from several integrated databases, whereas the data in HARP and MdrDB are computed via in-house developed or other published programs.
Despite the usefulness of these databases, they have some limitations. The most obvious drawback is that, to date, such databases remain very scarce. Moreover, the affinity information contained in such databases is not comprehensive and the number of target proteins and species included is quite limited. Importantly, the effects mentioned in such databases are exclusively caused by single-point mutations, and the construction of databases of the effects of multiple point mutations on PLIs remains a great challenge.
Drug resistance prediction
The abundance of drug resistance data has led to the development of a large amount of drug resistance prediction tools [66]. Various web servers have been developed for predicting DRMs from sequence data, detecting the influence of mutations on PLIs, and evaluating the impacts of mutations on protein stability. They are valuable for identifying drug resistance features that can guide the design of novel drugs to combat resistant organisms, tailor personalized treatment regimens and prevent the onward transmission of resistant infections [67, 68].
Web servers for predicting DRMs from sequence data
Detecting target mutations is essential for individual treatment and preventing the continued spread of drug-resistant infection, rapid and inexpensive sequencing allows the quick identification of mutations in members of large populations [69]. Some tools perform sequence alignment using the BLAST-based methods, Burrows–Wheeler Transform (BWT)-based methods, k-mer alignment (KMA)-based methods, etc. These tools are often useful when the protein structure there is not known or when homology modeling is not possible. Consequently, we analyzed and compared some web servers based on their functionality, operating principles and performance.
These web servers can be classified into two categories based on detectable species sequences, i.e. insect sequences based and microbial sequences based. In Table 4, Angiotensin converting enzyme (ACE) [69] and FastD [70] are shown to detect insecticide resistance mutations using insect ribonucleic acid (RNA)-Seq. ACE is the first program that can detect known acetylcholinesterase (AChE) mutations and calculate the resistance frequency. Moreover, it can detect resistance reads at very low frequency but can only detect the mutations in one target currently. Fortunately, FastD is a relatively new tool, compared with ACE, FastD detects the mutations in more targets (containing AChE, VGSC, RyR and nAChR), and can identify novel target-site mutations. Additionally, FastD uses the Sequence Alignment/Map (SAM) format as the input, which analyzes data in a faster manner than does ACE using FASTQ files as its input. Nevertheless, considering that RNA-Seq reads from pooled samples may have potentially different contribution levels in each insect sample and allele, FastD may be limited in its accuracy in the calculation of mutation frequency. The remaining tools detect DRMs based on microbial sequences. LRE-Finder [71, 72] detects the 23S rRNA mutations encoding linezolid resistance in Enterococci, and that team detected the G2505A mutation in vivo in Enterococci faecium from patients for the first time. Mykrobe predictor [73], TB-Profiler [74, 75], PhyResSE [76], KvarQ [77], the comprehensive analysis server for the Mycobacterium tuberculosis complex (CASTB) [78], Resistance Sniffer [79], GenTB [80] and SAM-TB [81] are all capable of detecting DRMs in M. tuberculosis. Currently, these tools can predict DRMs in a limited number of anti-TB drugs, probably for the following reasons, (1) certain anti-TB drugs such as pyrazinamide (PZA) and clofazimine (CFZ) do not have sufficient phenotypic drug susceptibility testing (pDST) available for comparison, and (2) the MoAs remain ambiguous and SNPs predicting resistance have not been systematically identified [74]. Therefore, developing tools that can predict DRMs to all anti-TB drugs is challenging. PointFinder [82], AMRFinderPlus [83] and GWAMAR [84] detect DRMs in many bacteria using whole genome sequencing (WGS) data. PointFinder identifies mutations in target genes on chromosomes but is unable to detect novel resistance mechanisms. Fortunately, GWAMAR can identify novel mutations associated with drug resistance. But it also has the following limitations, (i) it ignores the epistatic interactions between mutations, (ii) it only considers genomic changes and ignores the level of gene expression and (iii) it offers presumptive bioinformatics associations that should be further investigated using wet laboratory experiments. MinVar and HIVfird detect HIV DRMs [85, 86]. MinVar allows the detection of DRMs down to a frequency of 5% using deep sequencing data without additional bioinformatics analyses. HIVfird is the first software to predict the resistance of HIV-1 strains to fusion inhibitors based on viral deoxyribonucleic acid (DNA) sequence. Most tools require FASTA or FASTQ files as the input. In particular, the input information for GWAMAR includes mutations, drug resistance profiles and phylogenetic trees. Moreover, with the exception of SAM-TB and CASTB, all servers can be used directly without registration and login. In summary, these tools have a wide variety of uses and all contribute positively to the sequence-based detection of DRMs.
Web servers for predicting DRMs from sequence data
| Server/URL | Functionalitya | Operating principlesb | Performancec | Inputsd | Outputs | Advantages | Limitations | Year |
|---|---|---|---|---|---|---|---|---|
| Predict DRMs from insect sequence | ||||||||
| ACE http://genome.zju.edu.cn/software/ace/ | Detect insecticide resistance mutations in AchE by RNA-Seq data | BWT-based sequence mapping | – | FASTA or FASTQ | Mutation frequency, Resistance frequency | The first tool to detect DRMs from RNA-Seq data, can detect resistant reads at low frequency | Only one target resistance mutation can be detected currently | 2017 |
| FastD http://www.insect-genome.com/fastd | Detect insecticide resistance target-site mutations by RNA-Seq data | BWT–based sequence mapping | AUC: 0.87, R2 = 0.834, AC: 89.7% | cDNA sequences, SAM file | Mutation frequency, Resistance frequency | Can identify the new target-site mutations, using SAM files as input which can analyze the samples more quickly | The accuracy of mutation frequency is limited by the fact that RNA-Seq reads from pooled sample have potentially different levels of contribution from each insect sample and allele | 2019 |
| Predict DRMs from microorganism sequence | ||||||||
| LRE-Finder https://cge.food.dtu.dk/services/LRE-Finder-1.0/ | Detects the 23S rRNA mutations and linezolid resistance in enterococci by WGS data | KMA–based sequence mapping | AC: 100% | Elm database, threshholds, FASTA or FASTQ | Mutations, wild-type ratio, MT type ratio and predicted phenotype | The first report of a G2505A mutation detected in vivo in an E. faecium isolate from a patient | Using draft as sembly sequences will fail to detect mutations in 23S, when these mutations are constituting only a minority of the bases in the given position | 2019 |
| PointFinder https://cge.cbs.dtu.dk/services/ | Detects AMR chromosomal point mutations in bacteria | BLAST-based sequence alignment | AC: 98.4% | FASTQ | – | The output from the web tool is easily understandable | Low accessibility | 2018 |
| MinVar http://git.io/minvar | Detects minority variants in HIV-1 and HCV populations | BWA (BWT-based) sequence mapping | – | FASTQ | A table with amino acid mutations with respect to HIV-1 consensus B, annotated according to the class of resistance defined in the Stanford HIVdb | Detect DRMs without the need to perform additional bioinformatics analysis; Be compatible with a diverse range of sequencing platforms | There is no check for minimum acceptable and uniform coverage. For anomalous samples, a strategy to correct this skew is not chosen | 2017 |
| GWAMAR http://bioputer.mimuw.edu.pl/gwamar/ | Detects DRMs in bacteria from WGS data | MSA, TGH | AUC: 0.28, 0.43 | Mutations, drug resistance profiles, phylogenetic tree | Scored list of putative associations of drug resistance with mutations | Designed a new statistical score TGH | (i) it doesn’t consider or predict epistatic interactions between mutations. (ii) it considers only genomic changes ignoring levels of gene expression. (iii) it provides putative in silico associations which should be subjected to further investigation in wet lab experiments. | 2014 |
| HIVfird www.hivfird.ics.ufba.br | Detects mutatons in HIV-1 sequences that confer resistance to Enfuvirtide | Kalign-based sequence alignment | – | DNA FASTA | HTML file return from server with detection report | The first software to predict the resistance of HIV-1 strains to the fusion inhibitors based on the virus DNA sequence | Only nucleotide sequences can be used as input, protein sequences cannot be used as input | 2019 |
| Resistance Sniffer http://resistance-sniffer.bi.up.ac.za/ | Predicts drug resistance patterns of MTB isolates | BWT-based sequence mapping | – | FASTA/FASTQ | A bar plot of the probability that the strain is drug sensitive or drug resistant to the 13 antibiotics | Can be used at different stages of whole genome completion | Predictable anti-TB drugs are limited | 2019 |
| Mykrobe predictor https://www.mykrobe.com/ | Predicts drug resistance for MTB and SA from WGS data | BWT-based sequence mapping | SE/SP: 99.1%/99.6%; 82.6%/98.5% | FASTQ | Clinician-friendly report | A system robust to mixture | Batch uploads are not allowed, can’t interpret low frequency mutations with some of the platforms completely insensitive to indels and variants in promoter regions | 2015 |
| TB-Profiler https://tbdr.lshtm.ac.uk/ | Detects anti-TB drug resistance from WGS data | BWA (BWT-based) sequence alignment | – | FASTQ | HTML with drug resistance profile/lineages | The mutation library is more accurate than current commercial molecular tests and alternative mutation databases | Batch uploads are not allowed, can’t interpret low frequency mutations with some of the platforms completely insensitive to indels and variants in promoter regions | 2015, 2019 |
| PhyResSE http://phyresse.org | Delineates drug resistance of MTB from WGS data | BLAST-based sequence mapping | AC: 97.83%–100% | FASTQ | HTML with drug resistance profile and lineages | Simple to use, befits human diagnostics | Can’t interpret low frequency mutations with some of the platforms completely insensitive to indels and variants in promoter regions | 2015 |
| KvarQ http://www.swisstph.ch/kvarq. | Detects DRMs in bacterial from WGS data | BWA (BWT-based) sequence alignment | AC: >99% | FASTQ | A text file in JavaScript Object Notation format | Directly extracts relevant information from fastq files, easy to use | Can’t interpret low frequency mutations with some of the platforms completely insensitive to indels and variants in promoter regions | 2014 |
| CASTB http://castb.ri.ncgm.go.jp/CASTB | Predicts drug resistance for MTB from WGS data | – | – | FASTA/ FASTQ | Spoligotypes, VNTR, LSP lineages and SNP based tree with e-mail notification | CASTB is a useful tool for identifying strains from WGS data, even when bioinformatics knowledge is limited. | Batch uploads are not allowed,can’t interpret low frequency mutations with some of the platforms completely insensitive to indels and variants in promoter regions | 2015 |
| GenTB https://gentb.hms.harvard.edu | For analyzing and predicting drug resistances to MTB | MEM–Align–based sequence alignment | SE/SP: GenTB-RF: 77.6%, 96.2% GenTB-WDNN: 75.4%, 96.1% | FASTQ files and varient call file | Mutation frequency | Users can choose between two potential predictors, a RF classifier and a Wide and Deep Neural Network | Need to quality control input sequence data before prediction; multipoint mutations cannot be predicted | 2021 |
| AMRFinderPlus https://www.ncbi.nlm.nih.gov/pathogens/antimicrobial resistance/AMRFinder/ | Predicts drug resistance-associated point mutations | BLAST-based sequence alignment | – | FASTA | Report | Can detect acquired genes and point mutations in both protein and nucleotide sequence | Not easy to use | 2021 |
| SAM-TB https://samtb.uni-medica.com/ | Detects MTB drug resistance and transmission | BWA (BWT-based) sequence mapping | SE: 93.9%, SP: 96.2% | FASTQ | Mutation frequency, mutation details | Integrates drug-resistance prediction with strain genetic relationships and species identification of nontuberculous mycobacteria | Predictable anti-TB drugs are limited | 2022 |
aAbbreviation: AchE: Acetylcholine esterase; WGS: Whole Genome Sequencing; AMR: Antimicrobial resistance; DRMs: Drug resistance mutations; MTB: M. tuberculosis; SA: S. aureus.
bAbbreviation: BWT: Burrows–Wheeler Transform, KMA: K-mer alignment, uses k-mer seeding to speed up mapping and the Needleman–Wunsch algorithm to accurately align extensions from k-mer seeds. BWA: Burrows-Wheeler Alignment, a short read alignment with BWT. MSA: multiple sequence alignment. TGH: A new statistical score, viz tree-generalized hypergeometric score. Kalign: An MSA program that uses a SIMD (single instruction, multiple data) accelerated version of the bit-parallel Gene Myers algorithm. MEM-Align: A fast semi-global alignment algorithm for short DNA sequences that allows for affine-gap scoring and exploit sequence similarity. BLAST: The Basic Local Alignment Search Tool.
cPerformance: The sample information of the performance corresponding to these severs is provided in detail. FastD: They detected 469 (89.7%) variants among the inserted variants, calling performance using AUC in ROC curve. ROC with an AUC of 0.870 indicated a reliable calling performance. They compared the detected allele frequencies of detected variants with their set allele frequencies and found that the allele frequencies calculated by FastD-TR were highly correlated with their ‘true’ allele frequencies (R2 = 0.834; ρ < 10−16). LRE-Finder: Fastq files from 21 LRE isolates were submitted to LRE-Finder. As negative controls, fastq files from 1473 non-LRE isolates were submitted to LRE-Finder. The MICs of linezolid were determined for the 21 LRE isolates. As LRE-negative controls, 26 VRE isolates were additionally selected for linezolid MIC determination. It was validated and showed 100% concordance with phenotypic susceptibility testing. PointFinder: A total of 685 different phenotypic tests associated with chromosomal resistance to quinolones, polymyxin, rifampicin, macrolides and tetracyclines resulted in 98.4% concordance. GWAMAR: Precision-recall curves for comparison of different association scores implemented in GWAMAR. One presents results for the mtu173 dataset (39 positives; 1450 negatives), AUC = 0.28; the other for the mtu_broad dataset (75 positives; 870 negatives), AUC = 0.43. Mykrobe predictor: With SE/SP of 99.1%/99.6% across 12 antibiotics (using an independent validation set, n = 470). For MTB, the method predicts resistance with SE/SP of 82.6%/98.5% (independent validation set, n = 1609). PhyResSE: PhyResSE was tested with 92 strains from a well-characterized strain collection from Sierra Leone that comprised 44 phenotypically susceptible strains and 48 strains. 100% concordance for resistance SNPs in katG, inhA, ahpC, rrs, rpsL, embA and embC; 98.91% concordance for those in gidB and pncA; and 97.83% concordance for those in rpoB and embB. KvarQ: KvarQ successfully detect all main DRMs and phylogenetic markers in 880 bacterial whole genome sequences. The variant calls of a subset of these genomes were validated with a standard bioinformatics pipeline and revealed >99% congruency. GenTB: using a ground truth dataset of 20,408 isolates with laboratory-based drug susceptibility data. The mean sensitivities for GenTB RF and GenTB-WDNN across the nine shared drugs were 77.6% and 75.4%, respectively. The specificity: GenTB-WDNN 96.2%, and GenTB-RF 96.1%. SAM-TB: The accuracy of SAM-TB in predicting drug-resistance was assessed using 3177 sequenced clinical isolates with results of phenotypic drug-susceptibility tests (pDST). Compared to pDST, the sensitivity of SAM-TB for detecting multidrug-resistant tuberculosis was 93.9% with specificity of 96.2%. Abbreviation: AUC: Area Under Curve. AC: Accuracy. SE: Sensitivity. SP: Specificity.
dSAM file: the file of SAM format; NGS: next generation sequencing.
Understanding the operating principles of servers will allow users to choose and use them more readily. As shown in Table 4, MinVar, ACE, FastD, Resistance Sniffer, Mykrobe predictor, TB-Profiler, KvarQ and SAM-TB rely on BWT-based sequence mapping [87]. LRE-Finder relies on KMA-based sequence mapping, which is convenient to use for individuals without advanced bioinformatics skills [88]. PointFinder, PhyResSE and AMRFinderPlus work with the BLAST-based methods. The BLAST-based approaches rely on the assembled methods, which can lead to false-positive or false-negative results. Because the mapping methods do not rely on assembly, this method provides more precise results [89]. In addition, GWAMAR relies on multiple alignments and a self-designed Tree-Generalized Hypergeometric score (TGH). HIVfird relies on Kalign-based sequence alignment, and GenTB relies on MEM-Align-based sequence alignment. Currently, with no common agreement regarding which sequence analysis approach is better, the selection of the analytical method depends primarily on the sequencing types, computational resources and study purposes.
Although it makes sense to measure the behavior of predictive servers, the complexity of server functional design and the absence of significant verifiable data for servers often lead to the absence of performance evaluation. On the basis of existing released data, the performance data of several predictive servers have been collected in Table 4. Researchers commonly compare the results predicted by these tools with those of pDST to verify the accuracy of these tools. For example, Figure 3 shows that PointFinder has been proven and showed 98.4% of concordance with 685 different pDST associated with antibiotic resistance. And LRE-Finder has been validated and showed 100% accordance with pDST. However, as they all incorporated a very limited number of selected isolates for evaluation, their accuracy needs to be further validated in future studies. Moreover, many researchers compared and analyzed the performance of tools such as Mykrobe predictor, PhyResSE and TB-Profiler using pDST as reference [90–92]. These analyses revealed that these tools offer different sensitivity/specificity, mainly because of the different sets of mutations embedded in them, but also because of their underlying genotyping pipelines. Additionally, the accuracy of FastD reached 89.7%, but the precision of mutation frequency counted by this tool is restricted by the presence that RNA-Seq reads are derived from pooled samples, to which each species sample and allele may have distinct levels of contribution. Importantly, it is only meaningful to compare the performance of tools when using the same dataset. Moreover, how to maintain and improve a tool, rather than determining which tool is the best, is important in this context.
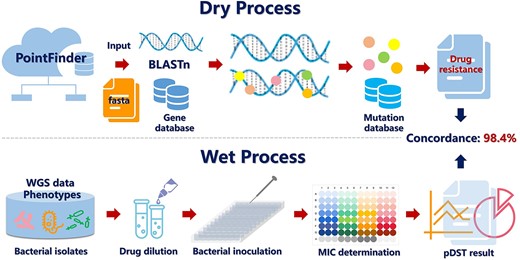
The validation procedure of predicted result of PointFinder, including dry process and wet process. In dry process, PointFinder uses BLASTn for identifying the best match for each gene in the chromosomal gene database, and only hits with an identity of ≥80% are further analyzed. The program goes through each alignment comparing each position for the query (sequence found in input sequence) with the corresponding position in the subject (database sequence). All mismatches are saved and compared with the chromosomal mutation database. In wet process, the 150 isolates were each tested against four to six different antimicrobial agents, leading to a total of 684 pDST results associated with chromosomal resistance to quinolones, polymyxin, rifampicin, macrolides and tetracyclines. The results of two process have a concordance of 98.4%.
Although these servers are useful for different purposes, they still have some limitations. First, in these tools, which are exclusively based on genotypic data, the mutations are not considered in the target’s 3D structure [93]. Second, some methods are poorly efficient in predicting the DRMs of novel drugs when there are only finite training data sets [70]. Third, there are relatively few sequence-based computational tools dedicated to the prediction of anticancer drug resistance, and the establishment of high-quality datasets and the development of highly accurate bioinformatics tools is very promising. In sum, tackling of these issues in future research will advance the sequence-based prediction of DRMs to the next level.
Web servers for assessing the impacts of mutations on PLIs
The impact of mutations on PLIs is a response to the appearance of drug resistance, and deciphering the mutation-induced changes in protein–ligand affinity is an important step toward more creative and individualized treatment interference [94, 95]. Developing predictive tools relies on three main methods: (i) molecular dynamics simulation and alchemical free-energy calculation; (ii) physic- and knowledge-based potential energy modeling via the Rosetta program and (iii) machine learning (ML). They help to understand, anticipate and improve the design of more effective therapeutic approaches to improve drug efficacy [96, 97]. Hence, we analyzed and compared some web servers based on their functionality, operating principles and performance.
According to the detected protein systems, these tools can be divided into those that detect multiple protein systems and those that detect specific protein systems. As shown in Table 5, mCSM-lig [96], PremPLI [26] and AIMMS [68] can detect DRMs in various proteins by assessing the effect of mutations on PLIs by quantifying the change in binding affinity. The mCSM-lig and PremPLI can only detect single-point mutations. However, a more complex situation often exists in reality such as multipoint mutations in target proteins. Fortunately, AIMMS can scan multipoint mutations in protein targets and predict ratios and drug resistance mechanisms. SUSPECT-PZA [98], SUSPECT-BDQ [67] and SUSPECT-RIF identify single-point mutations in the pncA, AtpE and rpoB genes of M. tuberculosis, respectively. SUSPECT-ABL and KRDS [99] predict kinase-associated drug resistance profiles and mutation-induced ΔΔG. Regarding the input and output of these tools (Table 5), PremPLI, mCSM-lig, KRDS and AIMMS require WT protein–ligand complex files and mutations as their input, whereas SUSPECT-PZA, SUSPECT-BDQ, SUSPECT-RIF and SUSPECT-ABL only require input of the mutation details. The output of SUSPECT-PZA and SUSPECT-BDQ is the most informative, as it includes not only the predicted outcome (resistant and susceptible), WT environment and parameters but also the visual interface of the protein (WT and MT) and drug interactions. Users can adjust the background, representation and color scheme, take screenshots, and download the binding mode images online according to their preferences. Furthermore, mCSM-lig, AIMMS, PremPLI, KRDs and SUSPECT-ABL can predict anticancer drug resistance, mCSM-lig, PremPLI, SUSPECT-PZA, SUSPECT-BDQ, SUSPECT-RIF can predict antibiotic resistance, and mCSM-lig, AIMMS and PremPLI can predict antiviral drug resistance. Users can choose the appropriate tool according to the protein systems, drugs or diseases they are researching. Briefly, these servers can be used to guide the design of proteins with promising ligand-binding functionality and specificity, uncover prospective DRMs, and facilitate the discovery of novel drugs to counter increasing drug resistance.
Web servers for evaluating the effects of mutations on PLIs
| Server/ URL | Functionalitya | Inputs | Outputs | Vab | Advantages | Limitations | Year |
|---|---|---|---|---|---|---|---|
| Detects multiple protein systems | |||||||
| mCSM-lig http://structure.bioc.cam.ac.uk/mcsm_lig | Quantify the effects of mutations on PLIs | PDB file or code, mutation chain, mutation, ligand, and WT affinity | ∆∆G, stability outcome, visible complex structure | Y | Provides insights into understanding mendelian disease mutations | The accuracy of forecasts needs to be improved | 2016 |
| AIMMS http://chemyang.ccnu.edu.cn/ccb/server/AIMMS/ | Scan mutations for protein targets | Task name, complex PDB file, ligand name, parameter file mutation details and e-mail | ∆∆G, heatmap | N | The first online platform for de novo drug resistance prediction of any protein–ligand system | More complex operations than other tools in the same category | 2020 |
| PremPLI https://lilab.jysw.suda.edu.cn/research/PremPLI/ | Estimate the effects of mutations on PLIs | PDB file or code, protein, chain, ligand, position, and mutation | ∆∆G and interface | Y | Requires lesser computational resources, allows large-scale mutation scan | Mutation lists are not allowed | 2021 |
| Detects specific protein systems | |||||||
| KRDS http://bcbl.kaist.ac.kr/KRDS/ | Evaluate DRMs in kinase | Job name, e-mail, PDB file, ligand file, drug binding site and mutation | Docking scores and figure, drug-bound structure | Y | Easy to use | Spend more time | 2018 |
| SUSPECT-PZA http://biosig.unimelb.edu.au/suspect_pza/ | Predict PZA resistance mutations in pncA | Mutation details | Predicted outcome, WT environment, parameters by other softwares, experimental evidence and interactive view | Y | Included structural information of the WT residue | The accuracy of forecasts needs to be improved | 2020 |
| SUSPECT-BDQ http://biosig.unimelb.edu.au/suspect_bdq/ | Identify bedaquiline resistance mutations in AtpE | Mutation details | Predicted outcome, WT environment, parameters by other softwares and interactive view | Y | Identify novel Bedaquiline resistance mutations | The accuracy of forecasts needs to be improved | 2019 |
| SUSPECT-RIF https://biosig.unimelb.edu.au/suspect_rif/ | Identify rifampicin resistance mutation | Organism and mutation details | Predicted outcome, WT environment, distance information and interactive view | Y | Outperforming the current gold-standard GeneXpert-MTB/RIF | The accuracy of forecasts needs to be improved | 2020 |
| SUSPECT-ABL http://biosig.unimelb.edu.au/suspect_abl/ | Predict DRMs in Abelson 1 kinase | Inhibitors and mutation details | Predicted outcome, ∆∆G, WT environment, conservation scores, pharmacophore changes and interactive view | Y | Visualization of molecular interactions within the WT and MT residue environment | The accuracy of forecasts needs to be improved | 2021 |
aAbbreviation: PLIs: Protein–Ligand Interactions, DRMs: Drug resistance mutations.
bWhether the visualization of network is supported in each tool.
Dissecting the operating principles of analogous servers is beneficial for selecting suitable tools in different circumstances. Table 6 shows the datasets, features and methodologies for constructing these web servers. Various datasets were used to extract features, particularly, mCSM-lig, SUSPECT-RIF and SUSPECT-ABL using the concept of graph-based signatures that encode distance patterns between atoms and are used to represent the protein residue environment for training predictive models. ML has emerged as a key promising pillar in drug resistance prediction [100–102]. PremPLI, mCSM-lig, SUSPECT-PZA, SUSPECT-BDQ, SUSPECT-RIF and SUSPECT-ABL are ML-based methods that were built using the same methodology workflow with four steps (data collection and curation, feature extraction and selection, model training and testing, and web server construction) (Figure 4). Among them, the most frequently used ML algorithm is the random forest (RF). To date, most computational approaches are data driven and they focus on a specific target protein. Training a statistical learning system requires adequate sets of resistant and non-resistant samples, which hampers the performance of de novo prediction of drug resistance with finite training datasets. Fortunately, compared with previous tools, AIMMS makes predictions using a de novo strategy that combines MD simulation, mutation scanning strategy, and free-energy calculation [68]. In addition, KRDS generates conformational ensembles using RosettaBackrub and performs docking simulations using GOLD and AutoDock Vina. In short, after understanding the operating principles of the tools described above tools, users can choose the tools that suit their research system and experimental conditions.
The dataset, feature, methodology and performance of web servers for evaluating the effects of mutations on PLIs
| Web server | Dataseta | Dataset source | Feature | Methodologyc | Performanced | |||||
|---|---|---|---|---|---|---|---|---|---|---|
| Training set | Test set | No. of feature | Type of featureb | Validation strategies | PCC | RMSE (kcal/mol) | Other | |||
| mCSM-lig | #763 | Platinum | 13 | Graph-based signatures, WT residue environment, pharmacophore difference, ligand properties (MW, residue depth, logP, #HAcceptors, #HDonors, #rotatable bonds, #rings, SA), residue depth, changes in protein stability | RF | 10-fold cross-validation | 0.627 | 2.059 | - | |
| AIMMS | 17 protein-drug systems involving 311 MTs | Publications | - | - | MD, CMS, MM/PBSA | - | - | - | SE: 91.3%, SP: 78.7%, AC: 89.4%, AUC: 85.5% | |
| PremPLI | S796 | S144, S129, S99 | Publications, PDB | 11 | Hydrophobicity, evolutionary conservation, ligand descriptor, fraction of residues, number of contacts, matrix of residue substitutions | RF | 5-fold cross-validation | 0.70 | 1.08 | AC: 80.1% |
| KRDS | 241 kinases and 178 inhibitors | PDB, Uniprot, PubChem | - | - | RosettaBackrub, GOLD (GA), AutoDock Vina (CS) | - | - | - | - | |
| SUSPECT-PZA | S610 | GMTV, TBdreamDB | 10 | Stability, dynamics, evolutionary conservation, ligand interactions and backbone geometry | RF | 10-fold cross-validation | - | - | AC: 80.1% | |
| SUSPECT-BDQ | 50 non-resistant variants and 5 resistant variants | 4 non-resistant variants and 4 resistant variants | Publications | 10 | Evolutionary conservation, interaction affinity, stability, location and physiochemical changes | MLPNN | Jackknife and leave-one-residue-position-out validation | - | - | AC: 93.3% AUC:0.99 |
| SUSPECT-RIF | 203 resistant and 28 susceptible mutations | 67 resistant and 21 susceptible mutations | Publications, TBRMD, GMTV | 298 | Graph-based signatures, local environment, interactions, pharmacophore and conservation | ML | - | - | - | AC: 90.9%, SE: 92.2%, SP: 83.6% MCC: 0.69 |
| SUSPECT-ABL | 19 resistant and 125 susceptible mutations | 42 resistant mutations | Publications, PDB | 10 | ATP_Inter-Neut: Pos-5.00, KOSJ950100_SST, KOSJ950100_SST, Hydro: Neut-5.00, Inter-Don: Hydro-4.00, LIG.POSIONIZABLE_COUNT, Acc: Hydro-6.00, LIG.NUM_ROTATABLE_BONDS, ATP_Aro: Neg-7.00, ATP_Neut: Pos-2.00 | ET | Leave-one-position out | 0.77 | - | MCC: 0.73, AUC: 0.84 |
a#763: a dataset contains 763 mutations, 505 reduced protein–ligand affinity. S796: 796 mutations, 360 complexes/117 proteins/168 ligands. S129: 129 mutations from six Abl-TKI complexes from the Protein Data Bank directly. S144: 144 mutation, 8 human kinase Abl-inhibitor complexes. S99: 99 mutations, 42 complexes/14 proteins/22 ligands. S610: 305 susceptible and 305 resistant mutations with high quality experimentally measured PZA susceptibility.
bAbbreviation: MW: molecular weight, #HAcceptors: the numbers of hydrogen bond acceptors and donors. #HDonors: the numbers of hydrogen donors. SA: surface area. #rotatable bonds: the numbers of rotatable bonds. #rings: the numbers of rings.
cAbbreviation: RF: Random Forest. MD: Molecular Dynamics. CMS: Computational Mutation Scanning. MM/PBSA: Molecular Mechanics / Poisson Boltzmann Surface Area. RosettaBackrub: a web server for flexible backbone protein structure modeling and design. GOLD: a software for molecular docking, which relies on genetic algorithm (GA) and Gold-Score fitness function. AutoDock Vina: a software for molecular docking, which relies on the default conformation search (CS) algorithm and the default scoring function. MLPNN: Multilayer perceptron neural network. ML: Machine Learning. ET: Extra tree.
dAbbreviation: PCC: Pearson correlation coefficient. RMSE: Root-mean-square error. MCC: Matthews correlation coefficient. SE: Sensitivity. SP: Specificity. AC: Accuracy. AUC: Area Under Curve.
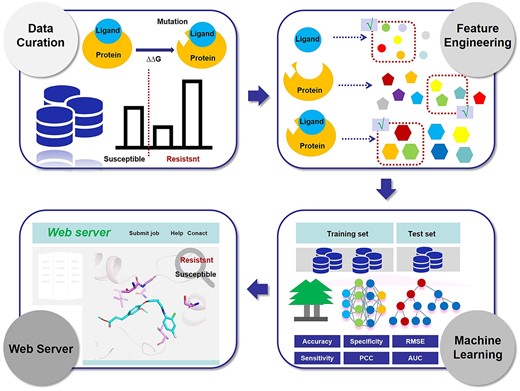
The methodology workflow for constructing structure-based prediction tools by ML-based methods. There are four steps involved in the methodology, (i) data collection and curation, (ii) feature extraction and selection, (iii) model training and testing and (iv) web server construction.
According to the available released data, we gathered the performance data of some prediction tools, and the elaborated data are shown in Table 6. To mitigate the overfitting problem, k-fold cross-validation and leave-one-residue-position-out validation were utilized to obtain reliable and stable models when constructing these tools. Notably, SUSPECT-BDQ classified 93.33% and 100% of the variants correctly in the training and blind test datasets, respectively. Furthermore, AIMMS also offers excellent accuracy, with 278 samples being correctly predicted as resistant and non-resistant in its performance evaluation test, with an accuracy of 89.4%. Zhuo et al. used AIMMS to assess the effect of tropomyosin receptor kinase MTs on their designed compound, which has emerged as a potential candidate for advanced preclinical studies, and this study combined with wet and dry experiments powerfully validated the accuracy of AIMMS [103]. In addition, Sun et al. compared the performance of PremPLI with mCSM-lig on the S129 and S144 datasets [26]. When tested on these two datasets separately, the Pearson’s correlation coefficient (PCC) of PremPLI was greater than those of mCSM-lig in both cases, and the Root-mean-square error (RMSE) values of PremPLI were lower than those of mCSM-lig in both cases, which indicates that the performance of PremPLI is significantly better than that of mCSM-lig. Moreover, Zhou et al. compared the performance of SUSPECT-ABL with mCSM-lig on a non-redundant blind test set (42 resistant mutations) [104]. The PCC are 0.74 and 0.43, and the RMSE are 0.40 and 0.75, which indicates that the performance of SUSPECT-ABL is better than mCSM-lig. Certainly, an emphasis needs to be placed on the fact that it is only meaningful to compare the performance of tools when using the same datasets. The Cancer Cell Line Encyclopedia (CCLE) includes the most comprehensive datasets of cancer cell lines, and Table 7 shows some clinical datasets. Users are recommended to use these datasets to compare the performance of tools, identify DRMs, as well as train or test new models to facilitate the development and improvement of such predictive tools, as well as the identification of new DRMs.
Clinical datasets for identifying the drug resistance-associated mutations
| Dataset | Description | Focus on | Authors | Year |
|---|---|---|---|---|
| S83 | A clinical dataset contains 83 BCR-ABL mutations from patients reported to be resistant to imatinib | Chemotherapeutic resistance mutations | Soverini et al. | 2011 |
| S48 | A clinical dataset contains 23 mutations in HIV-1 reverse transcriptase that led to reduced susceptibility or virological response against efacirenz and 25 mutations showing reduced susceptibility against rilpivirine | HIV drug resistance mutations | Iyidogan et al. | 2014 |
| S144 | A dataset contains 144 clinically identified mutants of human kinase ABL and eight FDA-approved kinase inhibitors | Cancer resistance mutations | Hauser et al. | 2018 |
| S610 | 305 susceptible and 305 resistant mutations of pncA with high quality experimentally measured Pyrazinamide susceptibility | Pyrazinamide resistance mutations in pncA | Karmakar et al. | 2020 |
| CRyPTIC | A clinical dataset contains355 pncA nsSNVs associated with PZA resistance | Pyrazinamide resistance mutations | Allix-Beguec et al. | 2018 |
| S98 | A clinical dataset contains 98 nsSNVs graded by the confidence of their association with phenotypic drug resistance | Pyrazinamide resistance mutations | Miotto et al. | 2017 |
| S32 | A clinical dataset contains 25 were high confidence resistant mutations, 4 were moderate confidence, and 3 were low confidence mutations | Clinical Mycobacterium tuberculosis mutations resistance | Miotto et al. | 2017 |
| S42 | A clinical dataset contains 42 clinical Mycobacterium leprae mutations | Clinical M. leprae mutations resistance | Vedithi et al. | 2018 |
| S231 | A clinical dataset contains 203 resistance mutations and 28 susceptible mutations from 6697 clinical isolates | Clinical M. tuberculosis mutations resistance | Coll et al. | 2018 |
Although these tools have yielded considerable progress in predicting binding affinity changes, they still require improvement. First, the accuracy and precision of such tools remain finite and warrant further improvement [26, 94, 105]. Second, the computational and time demands of these tools are greater than those of sequence-based approaches [93]. Third, most of these tools are suitable for predicting drug resistance due to single-point mutations in target proteins, but the target proteins often carry multipoint mutations. Fourth, regarding antibiotic resistance prediction, most tools focus on M. tuberculosis, but some other bacteria that cause serious harm, such as ESKAPE pathogens (E. faecium, Staphylococcus aureus, Klebsiella pneumoniae, Acinetobacter baumannii, Pseudomonas aeruginosa, and Enterobacter spp.) also require researchers to develop prediction tools to predict their drug resistance. Fifth, concerning anticancer drug resistance prediction, tools usually focus on kinase resistance mutations, especially ABL1 resistance mutations, and tools for predicting DRMs in various target proteins are lacking. In addition, special tools that were designed to predict resistance to immunotherapy are lacking. These potential tools hold great promise for development. In sum, breakthroughs in such limitations will facilitate the identification of disease-causing target mutations and the design of proteins with novel ligand-binding functionality and specificity, as well as the development of novel inhibitors with novel MoAs.
Web servers for evaluating the effects of mutations on protein stability
In addition to directly altering drug affinity via the local atomic changes, mutations can also affect protein stability, which may induce conformational changes and affect drug recognition and interactions [106, 107]. Some tools predict the mutational impacts on protein stability via ML-based methods and knowledge-based methods. These tools help to facilitate the evaluation of the effects on MT protein stability and the prediction of the potential DRMs. Herein, we analyzed and compared some web servers based on their functionality, operating principles, and performance.
Based on the predicted types of mutations, these web servers can be classified into two categories, i.e. those that detect single-point mutations and those that detect multiple point mutations. As shown in Table 8, the mutation Cutoff Scanning Matrix (mCSM) [108], DUET [109], STRUM [110], the Site Directed Mutator 2 (SDM2) [111], mCSM-membrane [112] and the Predicting the Effects of Mutations on Protein Stability (PremPS) [113] can estimate the changes in protein stability only consider single-point mutations. While DynaMut2 [114] and MAESTROweb [115] can assess protein stability changes upon both single and multiple point mutations. Differently from other tools, mCSM-membrane is specialized in predicting the effects of mutations on transmembrane proteins. Regarding the input of these tools, all of them require WT protein PDB format files and mutation details, as most of them use features of precise experimental structures. In particular, STRUM explores the possibility of using low-resolution structure modeling to improve the prediction of mutation-induced stability changes, so except structural files, which can also use sequence files (FASTA) as the input. It can be seen that STRUM, compared with other tools, is a good choice for users who do not have a defined protein structure in a PDB format file or high resolution. Regarding the outputs of these tools, all of them can output the value of ΔΔG, and all tools but mCSM can output visualized MT protein structures. Moreover, the above servers can be used straightforwardly without registration and login. In short, the mentioned tools help facilitate the assessment of the impact of MT protein stability to help understand target mutations associated with drug resistance.
Web servers for evaluating the effects on MT protein stability
| Server/ URL | Functionality | Inputsa | Outputsb | Vac | Advantages | Limitations | Year |
|---|---|---|---|---|---|---|---|
| Detect single-point mutation | |||||||
| mCSM http://structure.bioc.cam.ac.uk/mcsm | Predicts the change in protein stability (∆∆G) | PDB file or code, mutation chain, mutations | RSA(%), ∆∆G, stability outcome | N | Can also evaluate mutation impact on protein–protein and protein-nucleic acid interactions | There are no visualizations of predicted mutation structures | 2013 |
| DUET http://structure.bioc.cam.ac.uk/duet | Predicts the change in protein stability (∆∆G) upon single-point mutation | WT structure (PDB format), mutations | ∆∆G, stability outcome, visible MT structure | Y | Consolidates two complementary approaches (mCSM and SDM) | Mutation lists are not allowed | 2014 |
| STRUM https://zhanggroup.org/STRUM/ | Predicts effects of mutations on protein stability | FASTA, PDB file, mutation details | ∆∆G, visible MT structure | Y | Can predict mutation-induced stability change by low-resolution structure modeling | It takes a long time to compute, mutation lists are not allowed | 2016 |
| SDM http://structure.bioc.cam.ac.uk/sdm2 | Predicts effects of mutations on protein stability | PDB file or code, mutation, mutation chain | ∆∆G, stability outcome, visible MT structure, environment | Y | The most appropriate method to use in combination with many other methods | The accuracy of forecasts needs to be improved | 2017 |
| PremPShttps://lilab.jysw.suda.edu.cn/research/PremPS/ | Predicts impact of mutations on protein stability | PDB file or code, mutation chain, mutation | ∆∆G, MT structure, start time and processing time | Y | More accurately, large-scale mutational scanning | The accuracy of forecasts needs to be improved | 2020 |
| mCSM-membranehttp://biosig.unimelb.edu.au/mcsm membrane | Predicts effects of mutations on protein stability | PDB file or code, mutation chain, mutation | ∆∆G, stability outcome, MT structure, predicted transmembrane topology | Y | The effects of resistance mutations can be predicted based on structure and sequence | The accuracy of forecasts needs to be improved | 2020 |
| Detect single and multiple point mutation | |||||||
| MAESTROweb https://biwww.che.sbg.ac.at/maestro/web | Protein stability prediction | PDB file or ID, mutation details | ∆∆G, MT structure | Y | Suitable for multimeric structures, provides a scan functionality for the most (de)stabilizing n-point mutations for a maximum of n = 5 | Mutation lists are not allowed | 2016 |
| DynaMut2 http://biosig.unimelb.edu.au/dynamut2. | Predicts protein stability change upon mutation | PDB file or code, mutation chain, mutation, and e-mail | Average distance, ∆∆G and MT structure | Y | Introduces the dynamics component to mutation analysis | Less computing resources | 2020 |
aWT: wild-type.
bMT: mutant-type.
cWhether the visualization of network is supported in each tool.
To achieve better proficiency in the prediction of DRMs, users need to pay attention to the operating principles of these prediction tools. Table 9 shows the datasets, features and methodologies for constructing these prediction tools. Most of the datasets for these tools come from ProTherm, with the most commonly used dataset being S2648. The mCSM, DUET, STRUM, PremPS, mCSM-membrane, MAESTROweb and DynaMut2 are ML-based approaches. The ML algorithms used to build these tools are support vector machine (SVM), RF, gradient boosting regressor (GBR), etc. These tools usually entail a low computational cost but may suffer from the issue of overfitting. As a complementary approach, SDM2 is a knowledge-based method, in which predictions do not depend on the various features of training and do not suffer from overfitting. Moreover, it uses new recomputed environment-specific substitution tables to calculate stability difference scores between WT and MT protein structures. Especially, mCSM, mCSM-membrane and DynaMut2 rely on graph-based signatures that encode distance patterns between atoms for representing the protein residue environment and for training predictive models. In conclusion, each tool has its unique operating principle, and users can choose the proper tools for their research system based on the analyses described.
The dataset, feature, methodology and performance of web servers for evaluating the effects on MT protein stability
| Web server | Dataseta | Dataset source | Feature | Methodologyb | Performancec | ||||
|---|---|---|---|---|---|---|---|---|---|
| Training | Test | No. of feature | Type of feature | Validation strategies | PCC | RMSE (kcal/mol) | |||
| mCSM | S2648, S1925, S350, S309, S87 | ProTherm | - | Graph-based atom distance patterns, pharmacophore changes and experimental conditions | ML | 20-fold cross-validation | S1925: 0.824 | S1925: 1.026 | |
| DUET | S2297 | S351 | ProTherm | - | Pharmacophore, secondary structure, and predictions from Site Directed Mutator (SDM) and mCSM | SVM | - | S2297: 0.74 S351: 0.71 | S2297: 0.98 S351: 1.13 |
| STRUM | Q3421 | S2648, S350, Q306 | ProTherm | 120 | Sequence-based, threading template-based and i-TASSER model-based | GBR | 5-fold cross-validation | Q3421: 0.79 S2648: 0.77 | Q3421: 1.20 S2648: 0.92 |
| SDM2 | - | S2648, P53, S350, S309, S87 | ProTherm, literature | - | Mainchain conformation, solvent accessibility, hydrogen-bonding class | Knowledge-based | - | S2648: 0.48 P53: 0.68 S350: 0.61 S309: 0.61 S87: 0.69 | S2648: 1.46 P53: 1.56 S350: 1.29 S309: 1.32 S87: 1.71 |
| PremPS | S5296 | S921 | ProTherm, literature | 10 | PSSM score, ΔCS, ΔOMH, SASApro, SASAsol, PFWY,PRKDE, PL, NHydro and NCharg | RF | CV1-CV5 | S5296: 0.82 S921: 0.78 | S5296: 1.03 S921: 1.48 |
| mCSM-membrane | A342 | A62 | Literature | - | Graph-based signatures of the WT residue environment, a pharmacophore modeling of mutation effects (together with sequence-based properties) and the inter-residue interactions established | RF, ET | 10-fold cross-validation | A342: 0.72 A62: 0.67 | A342: 0.93 A62: 1.13 |
| MAESTROweb | MP | - | ProTherm | 6 | No. of residues, secondary structure, ASA, ΔMass, ΔHydrophilicity, ΔIsoelectric Point | ANN, SVM, MLR | 10-fold cross-validation | 0.77 | 1.41 |
| DynaMut2 | S872 | S227 | ProTherm | - | Protein dynamics (NMA), WT residue environment, substitution propensities and contact potential scores, interatomic interactions and graph-based signatures | RF | 10-fold cross-validation | 0.64 | 1.80 |
aS2648: 2648 non-redundant unique single-point mutations from 131 globular proteins, 602 stabilizing and 2046 destabilizing mutations. S1925: S2297: 2297 randomly selected mutations drawn from the S2648 data set. S351: 351 non-redundant mutations drawn from the S2648 data set. Q3421: 3421 mutations involving 150 proteins, where 2618 (or 77%) mutations have ∆∆G < 0 and 763 (or 22%) have ∆∆ > 0, which means that the majority of mutations have destabilized the protein fold. Q306: 306 point mutations from 32 proteins that have a sequence identity <60% to any proteins in the S2648. P53: 42 mutations within the DNA binding domain of the tumor suppressor protein p53. S140: 140 single-point mutations with known 3D structures for both WT and MT proteins and comprises a total of 128 mutations unique to this dataset. S5296: 2648 destabilizing (decreasing stability, ∆∆Gexp ≥ 0) and 2648 stabilizing (increasing stability, ∆∆Gexp < 0) mutations. S921: 921 single mutations from 54 proteins. A342: 342 missense mutations occurring in 4 proteins, PDB IDs 2XOV, 1PY6, 3GP6 and 1QD6; 156 decreasing stability (∆∆G < −0.4 kcal/mol), 56 neutral, 130 increasing stability (∆∆G > 0.4 kcal/mol). A62: 62 mutations occurring in three proteins, PDB IDs 1QJP, 2 K73 and 1AFO, 28 decreasing stability, 14 neutral, 20 increasing stability. MP: 479 MTs with multiple mutations. S872: 872 mutations from S1,098 (1098 mutations, 710 destabilizing, 388 stabilizing). S227: 227 mutations from S1,098 (1098 mutations, 710 destabilizing, 388 stabilizing).
bAbbreviation: ML: Machine Learning. SVM: Support Vector Machine. GBR: Gradient Boosting Regressor. RF: Random Forest. ET: Extra tree. ANN: Artificial Neutral Network. MLR: Mixed Logistic Regression.
cAbbreviation: PCC: Pearson correlation coefficient. RMSE: Root-mean-square error. MCC: Matthews correlation coefficient.
To compare the performance of some predictive tools, we calculated their accuracy, sensitivity, specificity, PCC, RMSE, Matthew’s correlation coefficient (MCC), receiver operating characteristic curve (ROC curve), area under curve (AUC), etc. Considering the complexity of tool configuration and testability, we selected four online servers (DUET, SDM2, PremPS and mCSM) and the P53 dataset (a widely used dataset containing 42 mutations in the tumor suppressor protein p53, all of which have experimental data in the literature and none of which are present in the training sets of above four tools) (Table S1). Table 10 shows the comparative results of the four tools. Figure 5A shows that the accuracy ranges from 0.714 (SDM2) to 0.786 (mCSM), Figure 5B shows that PremPS achieved the highest AUC (0.853), and Figure 5C shows that PremPS and DUET achieved higher PCC (0.733 and 0.731) and lower RMSE (1.370 and 1.299). Comprehensively considered, we assumed that the performance of PremPS and DUET is probably better. Moreover, we evaluated the consistency of the test results of mCSM, SDM2, DUTE and PremPS on the P53 dataset using intraclass correlation efficient (ICC). As shown in Table 11 with ICC = 0.913 (P < 0.001), so we assumed that the consistency of the test results of the four tools is excellent. In addition, we also collected some data on the performance of several servers from other studies. Quan et al. compared the performance of STRUM with mCSM on the S2648 and S350 datasets [110]. The PCC of STRUM are both higher than those of mCSM in both cases, and the RMSE of STRUM are both lower than those of mCSM, thus demonstrating that the performance of STRUM is superior to that of mCSM. Noteworthy, it should be emphasized that it is only meaningful to compare the performance of each tool when using the same datasets.
The comparative results of mCSM, SDM2, DUET and PremPS on P53 dataset
| Web server | Accuracy | Sensitivity | Specificity | Precision | Recall | F1 score | AUC | PCC | RMSE | MCC |
|---|---|---|---|---|---|---|---|---|---|---|
| mCSM | 0.786 | 1.000 | 0.775 | 0.182 | 1.000 | 0.308 | 0.704 | 0.675 | 1.403 | 0.375 |
| SDM2 | 0.714 | 0.444 | 0.788 | 0.364 | 0.444 | 0.400 | 0.710 | 0.684 | 1.545 | 0.217 |
| DUET | 0.762 | 0.600 | 0.784 | 0.273 | 0.600 | 0.375 | 0.733 | 0.731 | 1.299 | 0.283 |
| PremPS | 0.762 | 0.545 | 0.839 | 0.545 | 0.545 | 0.545 | 0.853 | 0.733 | 1.370 | 0.384 |
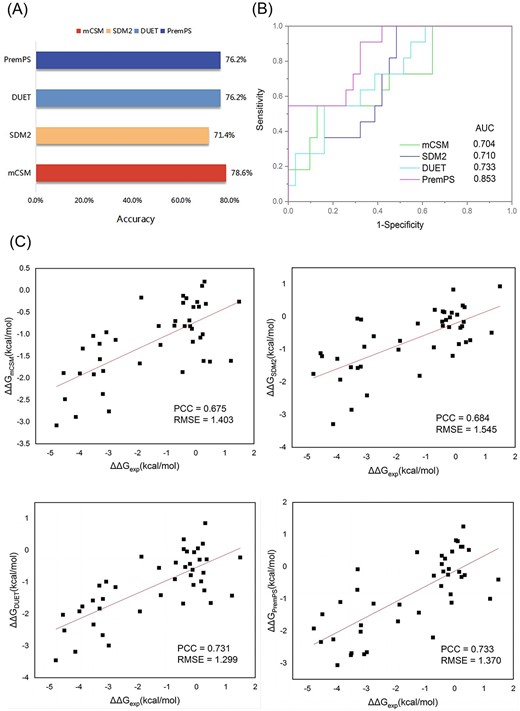
The performance evaluation of mCSM, SDM2, DUET and PremPS on P53 dataset. (A) The accuracy of mCSM, SDM2, DUET and PremPS on the P53 dataset. (B) The ROC curve and the AUC of mCSM, SDM2, DUET and PremPS on the P53 dataset. (C) PCC and RMSE between experimentally determined and calculated values of changes in protein stability (∆∆G) for mCSM, SDM2, DUET and PremPS on the P53 dataset.
The consistency of predicted results across mCSM, SDM2, DUET and PremPS on P53 dataset
| Intraclass Correlationa | 95% Confidence Interval | F Test with True Value 0 | |||||
|---|---|---|---|---|---|---|---|
| Lower Bound | Upper Bound | Value | df1 | df2 | Sig | ||
| Single Measures | 0.724a | 0.606 | 0.824 | 11.488 | 41 | 123 | 0.000 |
| Average Measures | 0.913 | 0.860 | 0.949 | 11.488 | 41 | 123 | 0.000 |
Two-way random effects model where people effects are random and measures effects are random.
aType C intraclass correlation coefficients using consistency definition. Excluded inter-measurement variance from the denominator variance.
bThe estimator is the same, whether the interaction effects is present or not.
Although such web servers have been widely used, they are still lacking in the following areas. First, most tools have very restricted accuracy in predicting stabilizing mutations, as the existing experimental sets are dominated by mutations that reduce protein stability [113]. Second, the majority of those methods have a moderate or low accuracy when applied to the independent test sets [113, 116]. Third, some methods do not perform well when low-resolution structures and models are built based on templates with a low sequence identity [113].
Which tool to choose?
There are many factors that should be considered when selecting the appropriate tool in our toolbox. For example, the aims of users (querying existing data, submitting new data or proposing new predictions), the research direction and system of users, the species specificity, protein specificity, and drug specificity of tools, the search criteria supported by the databases, the quality and source of the data, the format of the input and output supported by servers, the performance metrics of servers, the network visualization of tools and so on. Thus, conclusions about the suitability of a tool for a particular user may vary in different contexts. Based on our comparison of tools and our recommendations on selecting tools for different specific factors, it may be easier for users to select the appropriate tool.
Application examples
To briefly illustrate how bioinformatics tools can be applied to study drug resistance triggered by target mutations, we present four types of use cases that have been predict DRMs successfully in cancer cells, bacteria, HIV and agricultural pests. As follows, (1) Kinases are major drug targets of anticancer therapies, whereas mutation-induced drug resistance has become a major hurdle in the use of kinase inhibitors [16, 117]. Lee et al. applied KRDS to predict the drug response of the T790M mutation of EGFR and found that the DRMs could be identified based on the changes in the predicted binding affinity (Figure 6A) [99]. Moreover, Pires et al. applied mCSM-lig to identify BCR-ABL mutations leading to chemotherapeutic resistance, with over 75% of the DRMs being correctly predicted (Figure 6B) [96]. (2) Pyrazinamidase (PZase) is the target of the key anti-TB drug (PZA), and pncnA mutations in PZase cause PZA resistance [118]. Lwamoto et al. predicted the phenotypic PZA resistance of 191 strains using TB-Profiler, via which they found that by manually checking the results and applying the ‘non-WT type sequence’ method, users can obtain more accurate prediction of PZA resistance than those reported previously (Figure 6C) [119]. Karmakar et al. screened 600 clinical isolates using SUSPECT-PZA and identified the Y95R and E15A mutations, which were previously unreported and warrant further study (Figure 6D) [120]. (3) In HIV, the drug resistance mechanisms mainly involve mutations directly altering the interaction of viral enzymes and inhibitors [121]. Wu et al. successfully predicted drug resistance of five food and drug administration (FDA)-approved HIV protease inhibitors associated with 49 mutations using AIMMS, by categorizing the MTs into non-resistance, low resistance, middle resistance and high resistance with an accuracy of 72–100% (Figure 7A) [122]. Tachbele et al. investigated the DRMs of HIV-1 in ART-experienced patients by MinVar, which revealed considerable prevalence of virological failures and acquired DRMs with the associated risk indicators (Figure 7B) [123]. (4) AChE is a key target of organophosphorus and carbamate insecticides, while the AChE mutation is an important mechanism of insecticide resistance [124]. Guo et al. analyzed 468 RNA-Seq data from Anopheles gambiae using ACE, via which they found that the frequency of DRMs changed during insect development, which was not previously reported and deserves further study (Figure 7C) [69]. Chen et al. used FastD to detect the DRMs of AChE in Plutella xylostella, and they detected the A201S and G227A mutations, which were confirmed to be related to the resistance to organophosphorus and carbamate (Figure 7D) [70, 125]. Several application examples are listed here, which provide brief illustrations of how the bioinformatics tools have been applied to the study of the contributions of drug target mutations to the emergence of drug resistance.
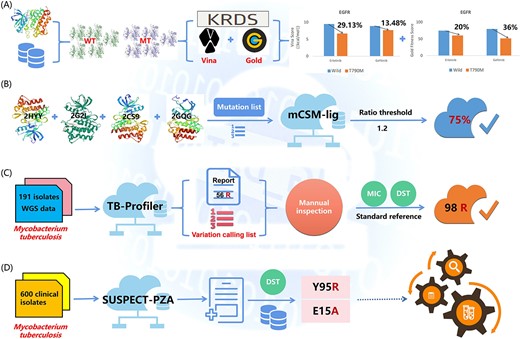
Schematic representations of the KRDS, mCSM-lig, TB-Profiler, and SUSPECT-PZA workflows. (A) Users can input mutation lists and drug lists through the curated kinase docking and user-entered kinase docking sections. After submission, the server will model the MT structure and perform docking simulations. After that, the server will perform GOLD and AutoDock Vina for molecular docking simulations. When the simulation is complete, the docking scores with the highest validity and the corresponding conformations of the original and MT kinases are reported to the users. The EGFR-T790M MT is known to be responsible for resistance to erlotinib and geftinib, and the absolute values of Vina scores (kcal/mol) of T790M decreased by 29.13 and 13.48% for erlotinib and geftinib, respectively, compared to those of the WT. Their Gold fitness scores decreased by 20 and 36%, respectively. (B) Mutation sites of WT proteins were given, their structural environment was extracted, and the interatomic distance patterns were summarized in the mCSM-lig signature.To take into account the changes in atomic types caused by mutations, pharmacological statistics were performed for WT and MT residues. Then, changes in pharmacophore counts, estimates of physicochemical properties of ligands and protein stability were appended to the signatures and used to train/test predictive models. mCSM-lig was able to predict over 75% of resistance mutations correctly, using 1.2 as a ratio threshold. This demonstrates the potential for mCSM-lig to explore and predict the resistance profiles expected for different molecules. (C) 191 M. tuberculosis isolates WGS data were submitted to TB-Profiler, then 56 default mutations with PZA resistant by TB-Profiler and the a variation calling list were reported, by manual inspection and drug sensitivity testing, 42 mutations other than default by TB-Profiler were found. (D) 600 clinical TB isolates with DST results were input to SUSPECT-PZA, predicting two previously unreported mutations Y95R and E15A that warrant further study.
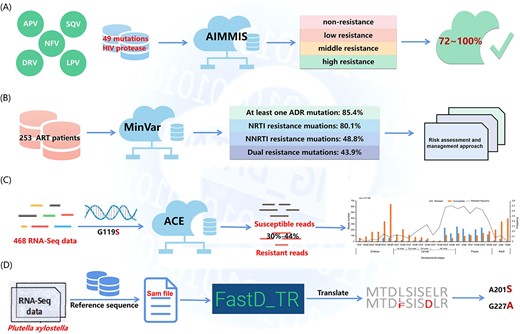
Schematic representation of AIMMS, MinVar, ACE and FastD workflow. (A) The predictive accuracy of AIMMS for five inhibitors (APV, SQV, NFV, DRV and LPV) on 49 HIV protease MTs under four thresholds was 72–100%. (B) MinVar was used to identify the DRMs of 253 adult patients attending ART clinics, 85.4% had at least one ADR mutation, 80.1% had NRTI resistance mutations, 48.8% had NNRTI mutations and 43.9% had dual resistance mutations. Regular virological monitoring and drug resistance genotyping methods should be implemented for better ART treatment outcomes of the nation. (C) They obtained RNA-Seq data from 468 samples, of which 20 were from an eastern Ugandan population. Since the G119S mutation of ace1 has been reported to confer insecticide resistance, they identified resistant reads from all 468 RNA-Seq data of A. gambiae by ACE. The results indicated that the resistance frequency was 30–44% in the eastern Ugandan population, suggesting that the resistance in the Ugandan Anopheles population has reached a very high frequency. Detection of the G119S mutation in the different developmental stages of A. gambiae. The late 4th instar larvae and pupae stages had higher resistance frequencies than the embryo and adult stages (One-way analysis of variance (ANOVA) test, P < 0.01). (D) First, raw reads from RNA-Seq data from case and control samples should be quality controlled to filter out aptamers and low sequencing quality reads. The clean reads obtained are then mapped to the target gene sequence using bowtie2 with additional options to generate a sequence SAM file. POS tagging based on each read. Based on the POS tags of each read, the nucleotides corresponding to the reference gene positions on the case and control samples are extracted using Perl scripts. Positions that included more than one corresponding nucleotide for each position and had read coverage ≥30 were considered as SNPs. Next, the allele frequency of each SNP was calculated and compared between case and control samples. SNPs with ≥40% difference in allele frequencies between case and control samples were treated as differential SNPs. Then, the codons at the differential SNP positions were translated into amino acid residues. Only non-synonymous differential SNPs were selected as potential target mutations. They used the FastD to detect the resistance mutations of the AChE in P. xylostella, they detected A201S and G227A mutations, and these two mutations were verified to be related to the resistance of organophosphorus and carbamate.
Clinician’s corner
One of the main benefits of bioinformatics tools over pDST is the ability to obtain drug resistance profiles rapidly. Several studies have proved the feasibility of implementing these tools in clinical practice [91]. They will undoubtedly be valuable for translating genetic sequences and structures into clinically actionable information to guide efficacious drug prescriptions.
How clinicians use these bioinformatics tools to make decisions related to drug treatment is of great significance. Clinicians can use bioinformatics tools such as SAM-TB to quickly detect drug resistance weeks before phenotypic identification (microbial culture and biochemical test). If a patient is diagnosed early with resistance to certain drugs, clinicians can prescribe a treatment plan that excludes these drugs to ensure effective treatment and avoid unnecessary waste. In addition, clinicians often resort to substitutes to combat drug resistance. Because compared to developing a novel drug, it is much less time consuming to treat a disease with a low-resistance drug instead of a high-resistance drug. Clinicians can use bioinformatics tools such as AIMMS to quickly calculate and identify a drug with non-resistance or lower resistance, then the drug can replace the current drug with high resistance. In summary, bioinformatics tools can help clinicians to establish early diagnoses and initiate appropriate treatment regimens.
While potential toolbox to help clinicians make decisions is very meaningful and promising, there are some challenges and opportunities. (i) The species-based drug resistance detection results and the interpretation of pDST results about DRMs also need to be highly accurate and standardized. (ii) None of the tools available currently combines all of the features needed to meet regulatory requirements, such as record-keeping capabilities and version control [126]. Therefore, the acceleration of the establishment of laws and regulations related to the clinical use of bioinformatics tools and to the improvement of the tools to meet the requirements of regulatory authorities also represents a very important opportunity and challenge. (iii) The relevant databases of drug resistance genes to be consulted for the implementation of such tools should be reviewed, regularly updated and reunified in a single public database. The sequencing technologies required would also need to be standardized. (iv) The predictive performance of certain drugs in a specific spectrum remains poor. This suggests that some drug resistance mechanisms remain to be deciphered [127]. (v) Most current diagnostic methods are limited to screening for resistance to a limited range of drugs, while the ability to infer resistance to many drugs is attractive because clinicians can be guided to prescribe a drug combination formulation that is more likely to be effective. (vi) The translation of gene sequences or protein structures into the bioinformatics tools that are routinely available to clinicians not specializing in bioinformatics also holds considerable promise.
Perspective
Bioinformatics tools for predicting drug resistance mediated by target mutations are demonstrating great power, but tools in this field are still expected to be further developed soon. For example, (i) future drug resistance databases should not only make great efforts toward data collection but also focus more on statistics and analysis of data so that users can obtain a quick overview of the huge amount of resistance data. (ii) Future DRMs prediction tools should expand the scope of prediction and improve the accuracy of prediction so that more users can apply them without skepticism. (iii) We hope that such tools will be used comparatively by researchers to evaluate their performance and identify highly likely phenotypic errors in public databases or datasets, thus promoting the improvement of tools in more aspects.
In addition to target mutation, there are many other intrinsic mechanisms of drug resistance that exist, such as increased drug efflux, decreased drug uptake, drug inactivation, etc (Figure 8). Extrinsic factors can also lead to drug resistance, such as cellular interaction, micro-environmental adaptation, etc [128, 129]. Fortunately, a small number of new bioinformatics tools based on these mechanisms are also currently gaining traction [130–132]. The research fervor toward bioinformatics tools such as the ones focusing on drug resistance caused by non-target mutations is expected to reach a new level soon.
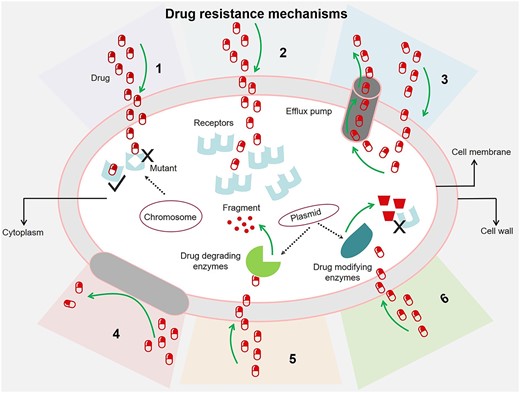
Drug resistance mechanisms. Drug resistance molecular mechanism can be divided into six main categories: (i) target mutation, (ii) epigenetic modifications, (iii) drugs efflux, (iv) modified cell wall proteins, (v) enzymatic breakdown of drugs, (vi) enzymatic modification of drugs.
Conclusions
Advances in bioinformatics tools for tracking target mutation-induced drug resistance have sheds new light on the possibility of discovering valuable information without the need for time-consuming, laborious and costly experiments. In this review, we have surveyed 59 bioinformatics tools. First, we showed that comprehensive databases are essential for constructing models for in silico drug resistance prediction, which include drug resistance cases, genes, mutations and the impacts of mutations on PLIs. Second, we demonstrated that user-friendly web servers assist researchers in predicting DRMs, they predict DRMs from sequence data, the influence of mutations on PLIs and the impacts of mutations on protein stability. Third, we provided some examples of how these tools are used for DRMs prediction to give a concise illustration of how bioinformatics tools have been applied in the study of drug resistance. We believe that this toolkit will be useful for a broad audience, from scientists to students, and will promote the process of drug discovery for combating issues of drug resistance.
Easy-to-access bioinformatics tools are providing the scientific community with handy resources for the research of drug resistance.
We summarized the merits and drawbacks of the mainstream bioinformatics tools available for exploring drug resistance caused by target mutations.
The applicability of the tool to a particular user may vary under different experimental conditions.
Bioinformatics toolbox for probing drug resistance, with particular visualization capabilities, benefits the discovery of biological studies.
This review will also be informative for non-specialists, undergraduates and computational scientists aiming to design novel bioinformatics tools for probing drug resistance.
Data availability
Data availability is not applicable to this article as no new data were created or analyzed in this study.
Funding
This work was supported by the National Natural Science Foundation of China (32125033).
Author Biographies
Yuan-Qin Huang and Yi Chen are master’s students at National Key Laboratory of Green Pesticide, Guizhou University, the direction of their thesis is bioinformatics.
Ping Sun is a master’s student at National Key Laboratory of Green Pesticide, Guizhou University, the direction of his thesis is drug design.
Huan-Xiang Liu is a professor in Bioinformatics at the Faculty of Applied Science, Macao Polytechnic University.
Ge-Fei Hao is a professor in Bioinformatics at National Key Laboratory of Green Pesticide, Guizhou University.
Bao-An Song is an academician of China Engineering Academy. He mainly engaged in pesticide design at the National Key Laboratory of Green Pesticide, Guizhou University.
