


Abstract
The advance in single-cell RNA-sequencing (scRNA-seq) sheds light on cell-specific transcriptomic studies of cell developments, complex diseases and cancers. Nevertheless, scRNA-seq techniques suffer from ‘dropout’ events, and imputation tools are proposed to address the sparsity. Here, rather than imputation, we propose a tool, SMURF, to extract the low-dimensional embeddings from cells and genes utilizing matrix factorization with a mixture of Poisson-Gamma divergent as objective while preserving self-consistency. SMURF exhibits feasible cell subpopulation discovery efficacy with obtained cell embeddings on replicated in silico and eight web lab scRNA datasets with ground truth cell types. Furthermore, SMURF can reduce the cell embedding to a 1D-oval space to recover the time course of cell cycle. SMURF can also serve as an imputation tool; the in silico data assessment shows that SMURF parades the most robust gene expression recovery power with low root mean square error and high Pearson correlation. Moreover, SMURF recovers the gene distribution for the WM989 Drop-seq data. SMURF is available at https://github.com/deepomicslab/SMURF.
Introduction
The emergence of high-throughput single-cell RNA-sequencing (scRNA-seq) flourishes the cell-specific transcriptomes applications [1–3], including cell cycles [4–6], complex diseases [7–9] and cancers [6, 10–14]. scRNA-seq allows us to obtain a gene-cell count matrix, where the rows represent the genes and the columns signify the cells. Nevertheless, this technique has a drawback—it could only catch a small portion of genes during the sequencing process, and such missing entries will be recorded as zero in the count matrix. We call this phenomenon the ‘dropout’ event and such a matrix the zero-inflated matrix [15]. As such, a zero value in a zero-inflated count matrix contains two possibilities—the first is that the gene expression in a cell is in fact zero, and the second is that it is a fake zero caused by ‘dropout’ events. The sparse gene-cell expression profile might influence the accuracy of downstream analyses and mask potential biological insights [16]. Thus, we need to determine the two possibilities concerning zero entries and amend the missing values from false zero to a more statistically realistic value. In computational biology, we termed this data wrangling process as ‘imputation’.
With the intent of making it more appropriate and valuable for a variety of downstream purposes such as clustering [17], cell type recognition [17], dimension reduction [18], differential gene expression analysis [19], identification of cell-specific genes [19] and reconstruction of differentiation trajectory [20] on zero-inflated single-cell gene expression data, several scRNA-seq imputation tools have been developed. A systematic benchmarking of 18 scRNA-seq imputation methods suggested that MAGIC [21], kNN-smoothing [22] and SAVER [23] were state-of-the-art tools [24]. MAGIC conducts imputation utilizing information across similar cells with data diffusion [21]. kNN-smoothing imputes the missing entries by collapsing gene-specific UMI counts from the k nearest neighbors [22]. SAVER estimates the gene expression level by borrowing information across similar genes utilizing the Bayesian approach [23]. Also, in a previous work [25], we introduced a self-consistent method I-Impute and demonstrated its robustness compared with SAVER. I-Impute optimizes continuous similarities and dropout probabilities iteratively to reach a self-consistent state. However, these tools focus on imputation only. Directly applying the imputed expression profile to downstream tasks like cell subpopulation detection and cell-cycle inference might fail due to the curse of dimensionality [26, 27].
In a previous work, we displayed matrix-factorization-based model could conduct robust imputation ability alongside cancer subtype preserved dimension reduction in bulk cancer omics data [28]. Thus, in this study, we develop SMURF to impute scRNA data based on matrix factorization. SMURF leverages a mixture of Poisson-Gamma distribution to deal with the zero-inflated problem. SMURF also generates cell and gene embeddings in their latent space that facilities cell type identification and visualization. We first access SMURF’s gene expression recovery ability with the state-of-the-art imputation tools I-Impute, SAVER, MAGIC and kNN-smoothing. In in silico data assessment, SMURF models parade the most robust gene expression recovery power with low root mean square error (RMSE) and high Pearson correlation. Moreover, SMURF’s cell embedding successfully preserves the underlying cell-subpopulation structures against the full-dimensional imputed gene-cell expression data for different sparsity. As for the wet lab dataset evaluation, we demonstrate that SMURF recovered the genes’ distribution from WM989 Drop-seq data. We further collect eight wet lab cell line datasets to benchmark the tools. SMURF exhibits feasible cell subpopulation discovery efficacy on all the eight cell line mixtures. Furthermore, we illustrate that SMURF could embed the cells into a 1D-oval latent space and preserve the time course of the cell cycle.
Materials and methods
Algorithm of SMURF
Problem formulation
Our goal is to make a reasonable estimate of the prior mean |$\boldsymbol{{U}}$| and prior variance |$\boldsymbol{{V}}$| through matrix factorization based on the negative binomial distribution and use the calculated prior mean |$\boldsymbol{{U}}$| as the final estimate of the gene expression level of this model (Supplementary Method—Algorithm 1).
Model initialization based on self-consistency
In order to improve the accuracy of the model, it is necessary to initialize the parameters. The initialization process not only needs to determine the initial values of the parameters, but also needs to disassemble the parameters into two matrices to facilitate subsequent matrix decomposition.
It is the inherent property of the relation matrix |$\boldsymbol{R}$| to make the above first to |$n$|-order equations true. The |$n$|-order equations is the iterative function mapping |$f(\boldsymbol{X}) = \boldsymbol{R}\boldsymbol{X}$| refining |$\boldsymbol{X}$| to achieve self-consistency. Based on this property, we can calculate the approximate matrix |$\boldsymbol{\hat{R}}$| of the relationship matrix that satisfies the self-consistency nature, and make coarse imputation of the cell gene matrix to get the initialization of |$\boldsymbol{{U}}$|.
Above, we have applied the inter-gene relationship matrix for discussion. In fact, this idea is also applicable to the inter-cell relationship matrix. However, we have found in actual experiments that since the number of cells in the relevant data set is far less than the number of genes, when we initialize with the self-consistency of the inter-cell relationship matrix, although it consumes less computing resources, the case of underfitting occurs more often.
Based on singular value decomposition, we decompose the matrix |$\boldsymbol{{U}}$| into two matrices |$\boldsymbol{G}$| and |$\boldsymbol{H}$|, where |$\boldsymbol{G} \in \mathbb{R}^{M \times K}, \boldsymbol{H} \in \mathbb{R}^{ K \times N}$|, |$ K \ll M, N$|.
For the prior variance |$\boldsymbol{{V}}$|, we assume that for each gene, there is an implicit connection between its mean and variance, and introduce three different noise models to estimate the variance: constant variance model, constant Fano model and constant coefficient of variation model; detailed formulation is given in Supplementary Methods.
Objectives and training
After initialization, SMURF uses the matrix decomposition based on the negative binomial distribution and different noise model to denoise the original expression matrix |$\boldsymbol{X}$| and impute in the dropouts in the matrix. First, we need to obtain the set |$P$| composed of the coordinates of cells and genes according to the matrix |$\boldsymbol{X}$|, and make |$P$| satisfy |$\forall (i,j)\in P$|, |${x}_{ij}>0$|.
1D-oval cell-cycle visualization
When we use SMURF to process the gene-cell matrix, we can get the cell embedding |$\boldsymbol{H}$|, which holds the underlying relationship between cells. For cells at different stages in the life cycle, we can think that the interrelationship contained in the cell characteristic matrix reflects the cell’s phases in the cell life cycle.
In order to extract the cell information from the cell feature matrix, to restore the time courses of each cell in the life cycle and to make a visual display, we reduce the dimension of the high-dimensional cell features, and make the target low-dimensional space a closed curve, that is, a one-dimensional space, to facilitate our observation.
The widely used linear dimension reduction methods such as PCA [29] are not suitable for our situation because they will destroy the global structure of the data, which is contrary to our purpose of dimension reduction. The method UMAP (Uniform Manifold Approximation and Projection) [18] based on manifold learning gives us new inspiration.
Like UMAP, we made the following three assumptions: (1) The data are uniformly distributed on the Riemannian manifold; (2) The Riemann metric is locally constant (or can be approximated in this way); (3) Manifolds are locally connected. It essentially constructs a weighted map from high-dimensional data, uses edge strength to indicate the ‘closeness’ of one point to another point and then projects this map to a two-dimensional space. Unlike UMAP, we restricted the mapping to 1D space, and the shape of the space should be a closed curve.
Simulation and benchmark settings
We use Splatter [30] to simulate five scRNA-seq datasets. The parameter configurations are nGenes=2000, batchCells=500, seeds=2021, group.prob = c(0.2, 0.2, 0.2, 0.2, 0.2), dropout.type= ‘experiment’, dropout.shape = -1 and dropout.mid = 1, 3, 4, 5 and 7 for dropout rate 28.38%, 63.14%, 78.00%, 88.06% and 97.22%, respectively. For replication experiments, we fixed dropout.shape = -1, and dropout.mid=1, 3, 4, 5 and 7, and set the seeds = 2020, 2022, 2023 and 2024. As a result, we get five replications for dropout.mid = 1, 3, 4, 5 and 7 with average dropout rates 27.94%, 62.83%, 77.83%, 87.98% and 97.24%, respectively.
We selected I-Impute, SAVER, MAGIC and kNN-smoothing as state-of-the-art imputation tools. For the SAVER R package, we used the ‘saver’ function with the parameters ncores=12 and estimates.only=TRUE to perform the imputation tasks. The parameters for scImpute are drop_thre=0.5, ncores=10, Kclusters=(number of true clusters in input data). For I-Impute, we used n=20, c_drop=0.5, p_pca=0.4, normalize=False for synthetic data and True for real data sets, iteration=True. For MAGIC, genes=‘all_genes’, knn=5, delay=1,t=3. The parameters for kNN-smoothing are k=10, d=10, dither=0.03.
Results
Overview of SMURF
The workflow of SMURF is summarized in Figure 1A. In brief, with zero-inflated gene-cell expression matrix |$\boldsymbol{X}$| as input, SMURF first iteratively refine the expression matrix to |$\boldsymbol{U}$| with the principle of self-consistency. Then, SMURF initializes the gene and cell embeddings (|$\boldsymbol{G}$| and |$\boldsymbol{H}$|) from the refined expression profile by singular value decomposition. Then, we assume the gene dispersion under three variance models (constant variance, constant Fano and constant coefficient of variance) and initialize them with the value of 1. With the gene embedding |$\boldsymbol{G}$|, cell embedding |$\boldsymbol{H}$| and gene dispersion |$\boldsymbol{\varphi }$| as parameters, we model and optimize the underlying expression profile |$\boldsymbol{U}$| with a Poisson-Gamma divergent objective to deal with the zero-inflated issues. After iterative gradient descent, SMURF outputs the optimized gene-cell matrix |$\boldsymbol{U}$|, gene embedding |$\boldsymbol{G}$|, cell embedding |$\boldsymbol{H}$| and gene dispersion |$\boldsymbol{\varphi }$|. The downstream analyses that SMURF could aid a better performance are listed in Figure 1B: (i) With the aid of Poisson-Gamma divergent, the final gene-cell expression profile |$\boldsymbol{U}$| best recovers the gene distribution; we demonstrate it with in silico benchmarking and melanoma Drop-seq dataset. (ii) SMURF generates cell embedding |$\boldsymbol{H}$| in the latent space that facilitates cell type identification and visualization. We illustrate it with in silico benchmarking and cell line mixture datasets. (iii) SMURF could further embed cycling cells into a 1D-oval latent space and preserve the time course of the cell cycle. We verify it with human and mouse embryonic stem cell data.
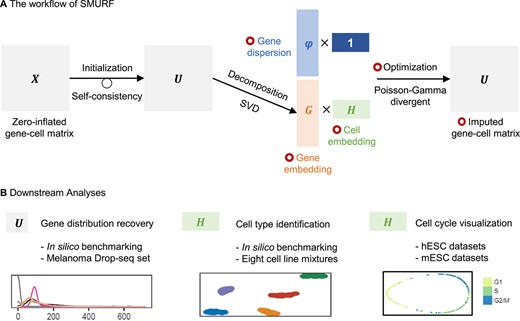
Overview of SMURF. (A) The workflow of SMURF. The red circle means the data are optimized by Poisson-Gamma divergent. (B) The downstream analysis of SMURF. SVD: singular value decomposition. hESCs: human embryonic stem cells. mESCs: mouse embryonic stem cells.
SMURF recovers the dropout gene expression in in silico trials
We check out whether SMURF and baselines can recover the dropout gene expression in in silico scRNA-seq data generated by Splatter [30]. We simulate a raw read count matrix with 2000 genes and five cell subpopulations, each subpopulation having an average of 100 cells. Next, we randomly replace 28.38%, 63.14%, 78.00%, 88.06% and 97.22% of nonzero values with zero, yielding five zero-inflated matrices with sparsity of 42.86%, 70.59%, 82.45%, 90.47% and 97.79%.
We evaluate the consistency of imputed values with the raw ones using RMSE and Pearson correlation (Cor.). kNN-smoothing exhibits high RMSE errors, while I-Impute and three SMURF variance modes (CV, F and V) have low RMSE. SMURF achieves the lowest RMSE when the sparsity reaches 80% (Figure 2A and Supplementary Table S1). Then, we measure the Pearson correlation between raw and recovered matrix entries (Figure 2A and Supplementary Table S1). For 28.38% dropout rate, all tools achieve satisfactory performance (Cor. > 0.92, |$p <$| 2.2e-16). In Supplementary Figure S1, the correlation scatterplots demonstrate that MAGIC and SMURF models outperform other tools when sparsity goes up with no severe drop-down or pull-up estimation. SMURF models have slightly larger correlations than MAGIC. For 63.14% dropout rate, MAGIC, SMURF_CV, SMURF_F and SMURF_V had Cor. value of 0.926, 0.933, 0.9323 and 0.933, respectively (|$p <$| 2.2e-16). For 78.00% dropout rate, MAGIC, SMURF_CV, SMURF_F and SMURF_V had Cor. value of 0.900, 0.913, 0.913 and 0.913, respectively (|$p <$| 2.2e-16). For 88.06% dropout rate, MAGIC, SMURF_CV, SMURF_F and SMURF_V had Cor. value of 0.856, 0.873, 0.874 and 0.873, respectively (|$p <$| 2.2e-16). For 97.22% dropout rate, MAGIC, SMURF_CV, SMURF_F and SMURF_V had Cor. value of 0.727, 0.746, 0.745 and 0.744, respectively (|$p <$| 2.2e-16). I-Impute, kNN-smoothing and SAVER tend to pull down some highly expressed genes, hence producing relatively low correlation values. Furthermore, we inspect the group marker genes heatmaps using raw, dropout and recovered expression levels (Supplementary Figure S2). MAGIC and SMURF’s marker gene matrices are closest to the ground truth. On 78.00% and 88.06% dropout sets, I-Impute, SAVER and kNN-smoothing fail to reproduce a clear marker expression pattern. However, all tools were unable to recover the marker expression pattern when the dropout rate reaches 97.22%.
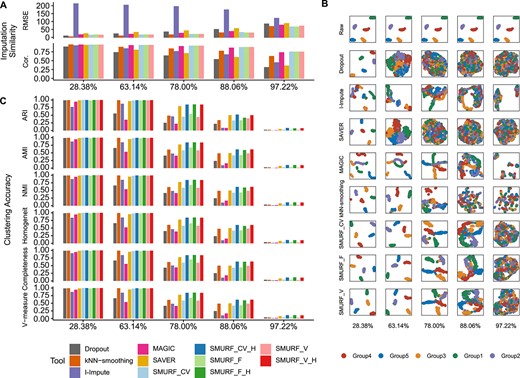
Benchmarking result on five in silico scRNA data with dropout rate of 28.38%, 63.14%, 78.00%, 88.06% and 97.22%. (A) The imputation consistency measured by RMSE and Pearson correlation (Cor.). (B) UMAP plot. Cells from the same group share the same annotation color. From left to right are datasets with the dropout rate of 28.38%, 63.14%, 78.00%, 88.06% and 97.22%. From top and bottom are tools: raw, dropout, I-Impute, SAVER, MAGIC, kNN-smoothing, SMURF_CV, SMURF_F and SMURF_V. (C) The clustering accuracy measured by adjusted rand index (ARI), adjusted mutual information (AMI), normalized mutual information (NMI), homogeneity score (Homogeneity), completeness score (Completeness) and V-measure score (V-measure). SMURF_CV, SMURF_V and SMURF_F stand for SMURF with variance mode constant coefficient of variance (CV), constant Fano (F) and constant variance (V), respectively. SMURF models with suffix ‘H’ mean the clustering was conducted with the cell embedding yielded by SMURF.
We then assessed whether SMURF maintains the cell subpopulation structures well while retrieving the missing entries. Figure 2B displays the UMAP plots of the raw, dropout and recovered matrices annotated with five cell subpopulations. The UMAP plot of expression data recovered by MAGIC and SMURF separated the five cell subpopulations even when the dropout rate reached 88.06%. The UMAP plot of kNN-smoothing blurred at the dropout rate of 78%. I-Impute and SAVER performed worst; they failed at 63.14%. Furthermore, we employ spectral clustering to the dropout, recovered and SMURF’s cell embeddings. We evaluate the clustering accuracy using six metrics: adjusted Rand index (ARI) [31], adjusted mutual information (AMI) [32], normalized mutual information (NMI) [33], homogeneity score (Homogeneity) [34], completeness score (Completeness) [34] and V-measure score (V-measure) [34]. These metrics measure the degree of overlap between the estimation and ground truth clusters. The value of 0 signifies random clustering, while 1 indicates perfectly complete labeling. In Figure 2C and Supplementary Table S2, the overall clustering accuracy declines as the dropout rate increases. kNN-smoothing and MAGIC exhibited the lowest clustering accuracy in all settings, sometimes even worse than the dropout case. The expression data recovered by I-Impute, SAVER, SMURF_CV, SMURF_F and SMURF_V displayed moderate improvements in clustering accuracy against the dropout data. The conventional imputation tools and SMURF output the full-dimensional imputed matrix |$\boldsymbol{U}$|. SMURF also generates the cell embedding |$\boldsymbol{H}$|. Both |$\boldsymbol{U}$| and |$\boldsymbol{H}$| can be taken as the input of downstream cell subpopupopulation identification task. Notably, the clustering accuracy yielded by the cell embedding |$\boldsymbol{H}$| outperformed all imputed full-dimensional cell expression |$\boldsymbol{U}$| and manifested the most desirable cell subpopulation classification power. Especially, SMURF_CV_H, SMURF_F_H and SMURF_V_H obtained the most noticeable clustering accuracy enhancements against their corresponding full matrices (SMURF_CV, SMURF_F and SMURF_V) in 78%, 88.06% and 97.22% datasets.
We further conducted replication experiments. We utilized Splatter to simulate five cohorts with average dropout rates of 27.94%, 62.83%, 77.83%, 87.98% and 97.24% (Methods, Supplementary Figure S3 and Supplementary Table S3). Each cohort has five replications. After that, we run SMURF on the replication data in three different variance modes (CV, F and V), and the imputation power and clustering accuracy are repeatable, as shown in Supplementary Figure S4 and Supplementary Tables S4–S5. To check the effectiveness of self-consistency initialization, we compared the RMSE and Cor. of SMURF without and with self-consistency initialization (Supplementary Figure S5 and Supplementary Table S6). Notably, the self-consistency initialization promotes the gene expression recovering power with RMSE falls and Cor. rises. With embedding dimensionality |$K$| set at 10, 20 and 50, SMURF runs for 1 min or less for in silico replication benchmarking (Supplementary Figure S6 and Supplementary Table S7)
Overall, the in silico assessment indicated that SMURF models parade the most robust gene expression recovery power. Moreover, SMURF’s cell embeddings successfully preserve the underlying cell subpopulation structures.
SMURF recovers the distribution of genes from WM989 Drop-seq data
We benchmarked SMURF with the melanoma cell line data, WM989, where Torre et al. [35] profiled 8498 WM989 single cells employing Drop-seq and Shaffer et al. [36] measured the gold-standard expression of 26 drug-resistant marker and housekeeping genes among the 7000–88 000 WM989 cells with single-molecule RNA fluorescence in situ hybridization (smRNA FISH). There are 15 genes overlapped between the Drop-seq and gold-standard expression data, and the sequenced cells are different from the two approaches [35, 36]. Thus, we assessed imputation performance by comparing these 15 gene distributions and correlations of imputation tools recovered with the distributions captured by gold-standard smRNA FISH (Figure 3). I-Impute is not compared here as it failed to finish the task in 24 h.
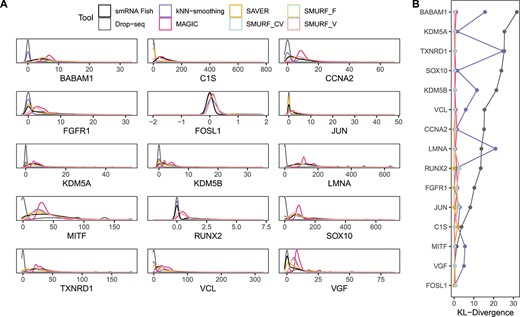
Benchmarking result on melanoma cell line WM989. (A) The imputed gene distribution and FISH estimated gene distribution among 15 genes. (B) The Kullback–Leibler (KL) divergence between imputed gene distribution and FISH estimated gene distribution.
We drew the density plot of each gene’s expression across cells (Figure 3A) and used Kullback–Leibler (KL) divergence [37] to measure how gene distributions recovered by imputation tools were different from the reference gene distributions estimated by smRNA FISH (Figure 3B and Supplementary Table S8). Compared with Drop-seq, the expression distributions obtained by SMURF and SAVER were closer to FISH. MAGIC and kNN-smoothing demonstrated a worse imputation ability as MAGIC on the shape of density plot and kNN-smoothing show the largest KL divergence on several genes.
SMURF enables accurate unsupervised clustering on mixture of cell line data
We apply SMURF to eight wet-lab mixture cell line datasets to benchmark the cell subpopulation problem. The first set is p3cl, including human dermal fibroblasts-skin, breast cancer luminal epithelial cell line MCF-7 and breast cancer basal-like epithelial cell line MDA-MB-468 in a 1:3:6 ratio [38, 39]. We evaluate SMURF with CellBench [40], where five human lung adenocarcinoma cell lines were mixed and sequenced with 10x Genomics, CEL-seq2 and Drop-seq, yielding seven datasets (mixture of HCC827, H1975 and H228: sc_10x, sc_celseq2, sc_dropseq; mixture of HCC827, H1975, A549, H838 and H2228: sc_10x_5cl, sc_celseq2_5cl_p1, sc_celseq2_5cl_p2, sc_celseq2_5cl_p3).
Likewise, we evaluated the consistency of imputed values with the raw ones using RMSE and Pearson correlation. kNN-smoothing exhibited high RMSE errors, while SMURF and other tools had relatively low RMSE (Figure 4A and Supplementary Table S9). MAGIC had the highest Pearson correlation between raw and recovered matrix entries (Figure 4A and Supplementary Table S9). The performance of I-Impute and SAVER performance is similar to that of dropout data. The SMURF models have the second place in five out of eight sets (sc_celseq2_5cl_p1, sc_celseq2_5cl_p2, sc_celseq2_5cl_p3, sc_celseq2 and sc_dropseq). The investigation of cell type marker genes heatmaps using raw, dropout and recovered expression levels (Supplementary Figure S7) demonstrates that the SMURF’s marker gene matrices are closest to the raw data on all eight sets. All other tools failed to produce distinct cell type patterns for all datasets.
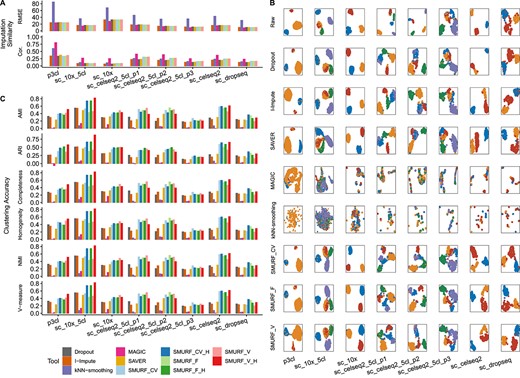
Benchmarking result on eight mixture of cell line scRNA data. (A) The imputation consistency measured by RMSE and Pearson correlation (Cor.). (B) UMAP plot. Cells from the same group share the same annotation color. From left to right are datasets p3cl, sc_10x_5cl, sc_10x, sc_celseq2_5cl_p1, sc_celseq2_5cl_p2, sc_celseq2_5cl_p3, sc_celseq2 and sc_dropseq with the dropout rate of 90%, 80%, 80%, 65%, 65%, 75%, 65% and 75%, respectively. From top and bottom are tools: Raw, Dropout, I-Impute, SAVER, MAGIC, kNN-smoothing, SMURF_CV, SMURF_F and SMURF_V. (C) The clustering accuracy measured by adjusted rand index (ARI), adjusted mutual information (AMI), normalized mutual information (NMI), homogeneity score (Homogeneity), completeness score (Completeness) and V-measure score (V-measure) of HVG600. SMURF_CV, SMURF_V and SMURF_F stand for SMURF with variance mode constant coefficient of variance (CV), constant Fano (F) and constant variance (V), respectively. SMURF models with suffix ‘H’ mean the clustering was conducted with the cell embedding yielded by SMURF.
We then evaluated whether SMURF keeps the cell type structures well while retrieving the missing entries. Figure 4B illustrates the UMAP embedding plots of the raw, dropout and recovered matrices annotated with the cell line labels. The UMAP plot of expression data recovered by I-Impute, SAVER and SMURF drew distinct cell line groups. However, MAGIC and kNN-smoothing mixed different cell line together in a mess. Furthermore, Figure 4C and Supplementary Table S10 further suggested that MAGIC and kNN-smoothing had the poorest spectral clustering accuracy on 600 of highly variable genes (HVG).
Overall, kNN-smoothing and MAGIC demonstrated the lowest clustering accuracy in all cell line mixtures, even worse than the dropout case. The expression data recovered by I-Impute and SAVER displayed moderate clustering accuracy improvements against the dropout on sc_celseq2_5cl_p2. Notably, the clustering accuracy yielded by SMURF outperformed on all cell mixtures and displayed the most desirable cell subpopulation classification power. Especially, cell embedding |$\boldsymbol{H}$| obtained the most noticeable clustering accuracy enhancements against all corresponding full matrices in the majority of datasets.
In all, the cell line mixture assessment indicated that SMURF models paraded the most robust gene expression recovery power. Moreover, SMURF’s cell embedding |$\boldsymbol{H}$| successfully preserved the underlying cell-subpopulation structures.
SMURF facilitates pseudo-time prediction for cell-cycle data
We leveraged six cell-cycle datasets to show SMURF facilitates pseudo-time prediction. In H1-hESC datasets, 247 cells were identified as being in G0/G1, S or G2/M phases using fluorescent ubiquitination-based cell-cycle indicators [41]. With G0/G1, S and G2/M phases labeled by Hoechst staining, mESC-Quartz and mESC-SMARTer has 23 and 288 mESCs sequenced by Quartz-seq and SMARTer, respectively [42, 43]. Then, as the 3Line-qPCR dataset provides G0/G1, S and G2/M cell stages marked by Hoechst staining as well, we split it into three datasets 3Line-qPCR_H9 (227 cells), 3Line-qPCR_MB (342 cells) and 3Line-qPCR_PC3 (361 cells) as the pseudo-time prediction benchmark sets [44].
Likewise, we first adopted I-Impute, kNN-smoothing, MAGIC, SAVER and SMURF to impute the six datasets. Then, we used SMURF to embed the raw and imputed full-dimensional expression profile and |$\boldsymbol{H}$| into 1D-oval latent space (Figure 5A). In the 1D-oval plot of raw H1-hESC, the cells from the G2/M phase are split into two subgroups, and the cells are not ordered according to the correct time course. However, in the 1D-oval plot of SMURF’s cell embedding |$\boldsymbol{H}$|, cells formed a G0/G1-S-G2/M cycle alongside the oval. We further adopted change index (CI) and Pearson correlation coefficient (PCC) [5] to quantitatively measure the accuracy of 1D-oval pseudo-time order against known cell cycle phases labels. A close to 1 value of CI and PCC signifies near-perfect time-series order, while a value of 0 means the predict psueo-time order is randomly matched with the ground-truth cell-cycle order. In Figure 5B and Supplementary Table S11, the SMURF cell embeddings (SMURF_F_H) have higher CI and PCC than SMURF and other imputation tools at most cases. This signifies SMURF can reduce the cell-cycle noise utilizing matrix factorization, thus facilitating the cell-cycle pseudo-time prediction.
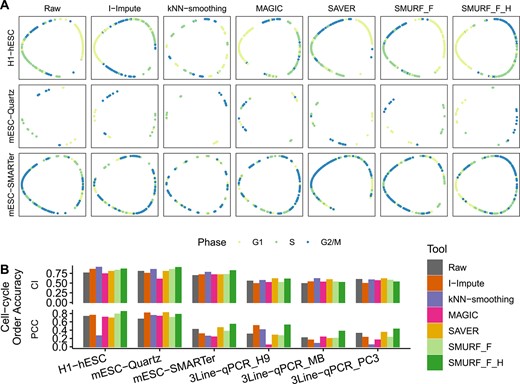
Cell-cycle visualization for hESCs. (A) 1D oval plot. Cells from the same cell cycle phase share the same annotation color. From left to right are tools: Raw, I-Impute, kNN-smoothing, MAGIC, SAVER, SMURF_F and SMURF_F_H. From top and bottom are datasets: H1-hESC, mESC-Quartz and mESC-SMARTer. (B) The time series scoring accuracy measured by the change index (CI) and Pearson correlation coefficient (PCC).
Discussion
In this study, we presented SMURF to impute scRNA data leveraging a mixture of Poisson-Gamma distribution while preserving self-consistency and embedding cells and genes data into their latent space with matrix factorization. We have demonstrated that SMURF could aid a better performance of scRNA downstream analyses in three perspectives: (i) With the aid of Poisson-Gamma divergent and self-consistency initialization, the final gene-cell expression profile |$\boldsymbol{U}$| successfully recovers the gene distribution compared with state-of-the-art imputation tools I-Impute, SAVER, MAGIC and kNN-smoothing. In synthetic data assessment, SMURF models paraded the most robust gene expression recovery power with low RMSE and high Pearson correlation (Figure 2A, Supplementary Figures S4–S5, and Supplementary Tables S1, S4, S6). Furthermore, SMURF successfully recovered the gene distribution from melanoma cell line Drop-seq data (Figure 3 and Supplementary Table S8). (ii) By incorporating matrix factorization, SMURF generates cell embedding |$\boldsymbol{H}$| in the latent space that facilitates cell type identification and visualization. We demonstrated that SMURF’s cell embedding |$\boldsymbol{H}$| successfully preserved the underlying cell-subpopulation structures for different sparsity against the full-dimensional imputed gene-cell expression data on synthetic datasets (Figure 1B–C, Supplementary Figure S4 and Supplementary Tables S2, S5) and eight cell line mixtures datasets (Figure 4B–C and Supplementary Table S10). (iii) SMURF could further embed cycling cells into a 1D-oval latent space and best preserve the time course of the cell cycle; we verify it with human and mouse embryonic stem cell data (Figure 5 and Supplementary Table S11).
Both SMURF and SAVER adopt Poisson-Gamma distribution to the zero-inflated fact of single-cell data. SMURF, however, has an additional setup step. We use the gene–gene similarity relationship to repeatedly revise the expression profile so that it maintains self-consistency, thus achieving a better gene expression recovery power than SAVER. Moreover, the advantage of SMURF against SAVER and other imputation tools is the support of dimensional reduction utilization matrix factorization. We model the distribution mean |$\boldsymbol{U}$| with the dot product of two |$K$|-dimensional embeddings |$\boldsymbol{G}$| and |$\boldsymbol{H}$|, which signifies the low-dimensional representation of gene and cell in the latent space, respectively. The gene and cell embeddings preserve the underlying gene–gene interactions and cell–cell structures and overcome the curse of dimensionality. We have demonstrated that the cell embedding |$\boldsymbol{H}$| manifested better cell type detection power against the full-dimensional matrix. Furthermore, in contrast to other imputation tools, SMURF provides 1D-oval manifold embedding dedicated to cell-cycle visualization.
However, several concerns need to be addressed. First, selecting the reduced dimension |$K$| is still an open question. Generally, the value of |$K$| first depends on the size of the zero-inflated matrix. The number of cells or genes should be at least several times larger than |$K$|; otherwise, the model may be over-fitting and ineffective. The dropout rate in the matrix also affects the value of |$K$|. For a matrix with a small dropout rate, the value of |$K$| can be increased appropriately, while for a very sparse matrix, a smaller |$K$| should be tried.
Second, SMURF assumes the underlying expression follows a mixture of Poisson-Gamma distribution and regards the estimated mean U from the mixture distribution as the final imputed gene expression. Moreover, SMURF uses the self-consistency principle to refine the initial |$\boldsymbol{U}$| with the gene–gene similarity relationship iteratively; that is, SMURF will adjust the noises for the genes with unusually high or low abundances in addition to imputing any potential missing entries with fake zeros.
Third, SMURF optimizes the Poisson-Gamma divergent under the assumption of three gene variance models (constant variance, constant Fano and constant coefficient of variance). Theoretically, we advise users to select the variance model that yields the smallest negative log-likelihood loss and employ the accompanying imputation and embedding to carry out the downstream analysis. In experiments, we observed that the constant Fano model performed with the greatest stability, thus we made it the default in the SMURF python package.
Fourth, SMURF does not always outperform in all situations. Still, we accept this because no model could ever be guaranteed to perform better than others on any given collection of data.
Poisson-Gamma divergence with matrix factorization is powerful to impute and embed sparse biological data simultaneously. In this study, we have shown how well the model handles sparse scRNA-seq data. To aid in the identification of topologically associated domains, we also used the model to infer the missing RNA–chromatin interaction and RNA–RNA interaction frequencies [45]. We are interested in seeing if the Poisson-Gamma divergence with matrix factorization model can accommodate alternative data modalities suffering from sparseness. For instance, single-cell assay for transposase-accessible chromatin data possesses a greater sparsity than scRNA-seq data [46]. Spatial transcriptomics is a promising technology for deciphering cellular heterogeneity by incorporating spatial context [47]. However, the widely used 10x protocol has resolution issues in addition to sparsity. That is, the 10x protocol generally gives us the mixture expression profile from two to eight cells in one spot over the tissue, which may have different cell types [48]. As a result, it is crucial to impute the spatial expression with the single-cell resolution [49]. The same applies to bulk RNA data. Given that communities have amassed substantial amounts of bulk RNA data in tumor immune micro-environment [50], computationally imputing single-cell level expression profiles from bulk RNA data could considerably encourage the effectiveness of treatment and prognosis for cancer. We intend to check if the single-cell level expression can be recovered from spatial or bulk data using the Poisson-Gamma divergence with matrix factorization model.
We propose SMURF to extract the low-dimensional embeddings from cells and genes utilizing matrix factorization with a mixture of Poisson-Gamma divergent as objective while preserving self-consistency.
SMURF exhibits feasible cell subpopulation discovery efficacy with obtained cell embeddings on scRNA datasets with ground truth cell types.
SMURF can reduce the cell embedding into a 1D-oval space to recover the time course of cell cycle.
SMURF can serve as an imputation tool, the in silico data assessment shows that SMURF parades the most robust gene expression recovery power with low RMSE and high Pearson correlation.
Acknowledgments
Not applicable.
Funding
This project was supported by National Key Research and Development Program of China (2021YFB2104800), Hong Kong CityU Strategic Interdisciplinary Research Grant (CityU SIRG 7020005), National Natural Science Foundation of China (62177002, 62072433), and Fundamental Research Funds for the Central Universities (DUT21RC(3)102).
Data availability
The p3cl was obtained from [38, 39]. The 3Line-qPCR_PC3 was obtained from [44]. The CellBench data were obtained from [40]. The H1-hESC data were obtained from [41]. The mESC-Quartz was obtained from [42]. The mESC-SMARTer was obtained from [43]. The WM989 Drop-seq was obtained with accession code GSE99330 [35]. The WM989 smRNA FISH data were obtained from the link https://www.dropbox.com/s/ia9x0iom6dwueix/fishSubset.txt?dl=0 [36].
Software availability
The source code of SMURF is available at https://github.com/deepomicslab/SMURF.
Author Biographies
Juhua Pu, PhD, is an associate professor at the School of Computer Science, Beihang University, China. Her research interest include machine learning and smart cities.
Xingwu Liu received PhD degree from Chinese Academy of Sciences in 2005. Currently he is a professor at the School of Mathematical Sciences, Dalian University of Technology, China. His research interest includes combinatorial optimization and deep learning.
Lingxi Chen, PhD, is a PostDoc in the Department of Computer Science, City University of Hong Kong. She is good at bioinformatics, deep learning, and algorithm development.
Shuai Cheng Li, PhD, is an associate professor at the Department of Computer Science, City University of Hong Kong. He is good at bioinformatics, deep learning, and algorithm design.
Bingchen Wang received the B.S. degree in Mathematics and Applied Mathematics from Beihang University, City, China in 2019 and the M.S. degree in System Engineering from Beihang University, City, China, in 2022. His research interests include machine learning and smart cities.
References
Author notes
The authors wish it to be known that, in their opinion, the Juhua Pu and Bingchen Wang authors should be regarded as joint First Authors.
