


Abstract
Long non-coding RNAs (lncRNAs) played essential roles in nearly every biological process and disease. Many algorithms were developed to distinguish lncRNAs from mRNAs in transcriptomic data and facilitated discoveries of more than 600 000 of lncRNAs. However, only a tiny fraction (<1%) of lncRNA transcripts (~4000) were further validated by low-throughput experiments (EVlncRNAs). Given the cost and labor-intensive nature of experimental validations, it is necessary to develop computational tools to prioritize those potentially functional lncRNAs because many lncRNAs from high-throughput sequencing (HTlncRNAs) could be resulted from transcriptional noises. Here, we employed deep learning algorithms to separate EVlncRNAs from HTlncRNAs and mRNAs. For overcoming the challenge of small datasets, we employed a three-layer deep-learning neural network (DNN) with a K-mer feature as the input and a small convolutional neural network (CNN) with one-hot encoding as the input. Three separate models were trained for human (h), mouse (m) and plant (p), respectively. The final concatenated models (EVlncRNA-Dpred (h), EVlncRNA-Dpred (m) and EVlncRNA-Dpred (p)) provided substantial improvement over a previous model based on support-vector-machines (EVlncRNA-pred). For example, EVlncRNA-Dpred (h) achieved 0.896 for the area under receiver-operating characteristic curve, compared with 0.582 given by sequence-based EVlncRNA-pred model. The models developed here should be useful for screening lncRNA transcripts for experimental validations. EVlncRNA-Dpred is available as a web server at https://www.sdklab-biophysics-dzu.net/EVlncRNA-Dpred/index.html, and the data and source code can be freely available along with the web server.
Introduction
Long non-coding RNAs (lncRNAs) are non-coding transcripts composed of more than 200 nucleotides. They have been found to play important roles in many biological processes and diseases [1]. Rapid advances in transcriptomics facilitate the discovery of more than 600 000 of lncRNAs [2] that were inferred by computational predictors such as CNIT [3], CPC2 [4] and CPAT [5] and annotated in several databases such as NONCODE [2], GENCODE [6], Ensembl [7] and RefSeq [8]. However, it is unknown how many of these lncRNAs are biologically active or resulted from transcriptional errors [9]. High cost of function determination led to fewer than 1% of lncRNA transcripts from high-throughput experiments that are validated by low-throughput experiments [10]. The huge gap between sequenced and validated lncRNAs demands development of computational techniques to screen and prioritize lncRNAs that can be validated by low-throughput experiments.
Most previous computational efforts, however, were developed for separating lncRNAs from mRNAs only. These methods include machine-learning models such as CNIT [3], CPC2 [4] and CPAT [5], and more recently, deep-learning techniques such as lncRNA_Mdeep [11], lncRNAnet [12] and LncADeep [13] with increasingly higher accuracy. However, it did not address the question if these lncRNAs are functional.
One direct way to predict lncRNA function is to infer from sequence similarity or high-throughput experimental data [14], such as RNA-seq, Chip-Seq and CLIP-seq. These data allows the construction of lncRNA-DNA/miRNA/mRNA/protein co-expression or interaction network for functional inference [14]. For example, lnc-GFP employed a bi-colored network [15], KATZLGO utilized a global network [16] and lnCaNet inferred from a co-expression network of lncRNA and non-neighboring cancer gene [17]. However, these experimental data are often limited to specific experimental conditions, such as a particular cell line or tissue, or a particular cancer. Thus, a wider application of these methods for function inference is not possible.
Previously, we developed a method called EVlncRNA-pred [18] to separate those experimentally validated lncRNAs (EVlncRNA) from those obtained from high-throughput sequencing (HTlncRNAs). Using an SVM model, we demonstrated that EVlncRNA is predictable with an estimate that 30% human HTlncRNAs is functional. Recently, deep learning algorithms have been demonstrated increasingly powerful in improving the performance of bioinformatics tools including the success in protein structure prediction [19]. Here, we investigate if and how a deep learning technique can be employed to further improve the performance of EVlncRNA-pred.
Using the largest collection of EVlncRNA available [10], we trained several deep learning models to distinguish EVlncRNAs from function-unknown lncRNAs obtained from high-throughput sequencing (HTlncRNAs) and mRNAs. By comparing the performance of different features (K-mer features, one-hot encoding, word2vec model, conservation and secondary structure features) and model architectures [convolutional neural network (CNN), deep neural network (DNN), Transformer], we found that simple sequence features and simple network models worked best, due to the small size of the available training set. Moreover, species-specific models work better for specific species. The online server of EVlncRNA-Dpred and the source code are freely available at https://www.sdklab-biophysics-dzu.net/EVlncRNA-Dpred/index.html.
Materials and methods
The flow chart for developing EVlncRNA-Dpred is shown in Figure 1. It involves the collection for both positive and negative data from EVLncRNAs and GENCODE, respectively. The network architecture consists of separate training of two separate models (CNN and DNN), which are concatenated for final prediction. More specific details can be found below.
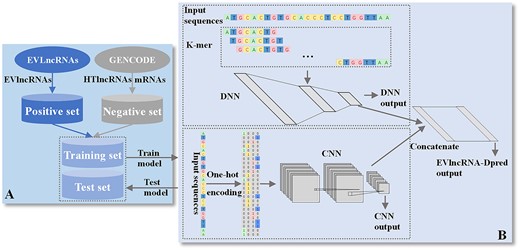
The flow chart for developing EVlncRNA-Dpred. (A) Positive and negative datasets were obtained from the databases of EVLncRNAs and GENCODE, respectively. (B) The network architecture of EVlncRNADpred consists of separate training of two separate models (CNN and DNN), which are concatenated for final prediction. EVlncRNAs: experimentally validated functional lncRNAs; HTlncRNAs: functional unknown lncRNAs obtained from high-throughput sequencing.
Training and test datasets for human lncRNAs
The datasets were constructed as in our previous work [18] but expanded by using the largest collection of experimentally validated functional lncRNAs (EVlncRNAs) available in EVLncRNAs 2.0 database [10]. This collection of human EVlncRNAs is considered as the positive set. After removing the redundant sequences by CD-HIT [20] with 80% sequence identity, we randomly selected 80% for training and 20% for test. After excluding the positive dataset and removing the redundant sequences by CD-HIT, we randomly selected an equal number of high-throughput lncRNAs (HTlncRNAs) and an equal number of mRNAs from the GENCODE V38 as a combined negative set. The final human training dataset contains 2831 EVlncRNAs (positive), 2831 HTlncRNAs and 2831 mRNAs (negative), respectively. The human test set contains 707 EVlncRNAs (positive), 707 HTlncRNAs and 707 mRNAs (negative), respectively. A 5-fold cross validation was performed in training.
Training and test datasets for mouse and plant lncRNAs
The training and test datasets for mouse and plant lncRNAs were constructed as above. After removing the redundancy within itself, we obtained 365 mouse EVlncRNAs and 162 plant EVlncRNAs (including 128 arabidopsis lncRNAs, 16 maize lncRNAs, 4 wheat lncRNAs, 2 rice lncRNAs and 12 lncRNAs of other plants). Corresponding negative sets were also obtained from GENCODE M27 for mouse and Ensembl Plants [21]. In particular, considering that arabidopsis, maize, wheat and rice are the most studied model plants, we randomly selected 141 arabidopsis HTlncRNAs/mRNAs, 16 maize HTlncRNAs/mRNAs, 4 wheat HTlncRNAs/mRNAs and 1 rice HTlncRNA/mRNAs from Ensembl Plants as the negative dataset. The final mouse training dataset contains 292 EVlncRNAs (positive), 292 HTlncRNAs and 292 mRNAs (negative), respectively. The mouse test set contains 73 EVlncRNAs (positive), 73 HTlncRNAs and 73 mRNAs (negative), respectively. The final plant training dataset contains 130 EVlncRNAs (positive), 130 HTlncRNAs and 130 mRNAs (negative), respectively. The plant test set contains 32 EVlncRNAs (positive), 32 HTlncRNAs and 32 mRNAs (negative), respectively. It is clear that both mouse and plant datasets are substantially smaller than the human datasets.
Methods overview
Deep learning methods have been widely used in biological study [22–26]. Compared with traditional machine-learning algorithms, deep learning methods have powerful representation learning capability and can automatically extract and screen the input information layer by layer without extensive data pre-processing or manual feature extraction. This character makes it a suitable tool to analyze complex structures of high-dimensional data [27, 28]. The CNN could learn the spatial information [29, 30]. Therefore, we employed deep learning methods to mine the essential features in functional lncRNA sequences without human intervention.
After experimenting different model architectures (CNN, DNN and Transformer), we found that simple neural networks worked best for our small dataset. Moreover, examining the performance of K-mer features, one-hot encoding, word2vec model, conservation and secondary structure features (see Discussions) led us to choose k-mer features and one-hot encoding to build a three-layer DNN and a CNN models, separately. The two models were then combined into a concatenate layer and a fully connected layer to make the final selection of EVlncRNAs from HTlncRNAs and mRNAs. The same network architecture was used for the mouse lncRNA (EVlncRNA-Dpred (m)) and the plant lncRNA (EVlncRNA-Dpred (p)), respectively. Considering the relatively small size of dataset, we employed a variety of techniques to prevent overfitting: early stopping, dropout, batch normalization, simplified the neural network and reduced learning rate, in addition to make training and test sets nonredundant from each other. The details were shown in the corresponding section below.
K-mer descriptor
For a given RNA sequence, we can calculate the frequencies of each k neighboring bases. These frequencies are stored in a vector of dimension 4K. To prevent overfitting, we employed a simple 3-layer DNN model consisted of an input layer, two hidden layers and an output layer. At the same time, dropout layers were added after each layer (Figure 2). The rectified linear unit (ReLU) was used as the activation function. This model was trained for predicting EVlncRNAs. When training the model, we used low learning rate and stopped training when three epochs of training do not lead to improvement. For the final concatenated model, the last hidden layer of this DNN model was used as the input feature.

The architecture of EVlncRNA-Dpred.
One-hot encoding descriptor
One-hot encoding transformed the four nucleotides A, C, G and U to binary vectors of (1, 0, 0, 0), (0, 1, 0, 0), (0, 0, 1, 0) and (0, 0, 0, 1), respectively. Thus, the transcript of length L was represented by 4 × L matrix. We employed a simple CNN model made of one convolution layer, one batch normalization, one pooling and one output layer. Batch normalization layer and dropout layer were added to prevent overfitting (Figure 2). ReLU was used as the activation function. This model was trained for predicting EVlncRNAs. Low learning rate and early stopping were used to prevent overfitting. As the convolution layer requires a fixed-length input, we set a parameter of maxlen. If the length L of a sequence is shorter than the maxlen, it will be patched with (0, 0, 0, 0) × (maxlen-L) matrix, and if the sequence length is longer than the maxlen, the excess sequence region is ignored. For the final concatenated model, the last hidden layer of this CNN model was used as the input feature. A maxlen of 4000 nt was chosen after examining the performance dependence on the sequence length.
Model fusion
We firstly separately trained the DNN model for the k-mer feature and the CNN model for the one-hot encoding. Then, the last hidden layers of the DNN and CNN models were used as inputs and were fed into a concatenate layer. Batch normalization layer and dropout layer were added to prevent overfitting, and the sigmoid function was applied on the last layer for final prediction (Figure 2). When training the fused model, low learning rate and early stopping were used to prevent overfitting.
Performance evaluation
Data and software availability
EVlncRNA-Dpred was implemented in Python 3 using Keras 2.2.5 with the backend of Tensorflow-gpu 1.14.0. The models were trained on a NVIDIA TITAN RTX. EVlncRNA-Dpred is available as a web server at https://www.sdklab-biophysics-dzu.net/EVlncRNA-Dpred/index.html. The data and source code are freely available at the web server for download.
Results
Performance of EVlncRNA-Dpred (h) for human datasets
Setting the parameters
The dependence of the performance on k in the k-mer descriptor was evaluated. The results are shown in Figure 3A. The AUROC of the 5-fold CV increases from k = 1 to 8 and kept the same at k = 9. However, at k = 8, the variation from the performance in 5-folds is the smallest. Moreover, using k = 8 requires less computing time than using k = 9. Thus, we set the k as 8 for the final model. Figure 3B shows the dependence of the performance on maxlen in one-hot encoding. The overall dependence on maxlen is small. As 95% human lncRNAs are shorter than 4000 in length in GENCODE [12], we set the maxlen as 4000.
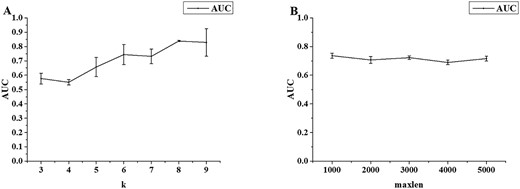
Performance of 5-fold cross-validation on human training set (A) for the k-mer DNN model as a function of k and (B) for the one-hot encoding CNN model as a function of maxlen.
Comparison between individual and combined models
Table 1 compares the performance of the individual models (the k-mer DNN and one-hot-encoding CNN models) with those of their combined models. The average AUROC of 5-fold CV of the DNN model and CNN model were 0.839 and 0.717, respectively. A simple average of DNN and CNN models further improves the performance to AUROC = 0.849, whereas a concatenated model provides a slight further improvement with an AUROC of 0.858. Similar trend was observed for other performance measures such as AUPRC, AUPRC, ACC, MCC and F1_score. Thus, we employed the concatenated model as our final model for EVlncRNA-Dpred (h).
Performance comparison for individual models and combined models in 5-fold cross validations on human training set
| Model | AUROC | AUPRC | ACC | MCC | Sensitivity | Specificity | F1_score |
|---|---|---|---|---|---|---|---|
| DNN | 0.839 ± 0.004 | 0.777 ± 0.015 | 0.808 ± 0.013 | 0.552 ± 0.029 | 0.594 ± 0.035 | 0.914 ± 0.030 | 0.673 ± 0.016 |
| CNN | 0.717 ± 0.024 | 0.538 ± 0.062 | 0.686 ± 0.020 | 0.157 ± 0.111 | 0.089 ± 0.099 | 0.985 ± 0.021 | 0.144 ± 0.153 |
| Average | 0.849 ± 0.008 | 0.782 ± 0.017 | 0.798 ± 0.007 | 0.530 ± 0.019 | 0.462 ± 0.036 | 0.966 ± 0.016 | 0.603 ± 0.024 |
| Concatenated | 0.858 ± 0.006 | 0.807 ± 0.014 | 0.816 ± 0.008 | 0.574 ± 0.021 | 0.598 ± 0.061 | 0.925 ± 0.039 | 0.683 ± 0.017 |
Comparison with the previous method
To the best of our knowledge, our previous SVM-based EVlncRNA-pred [18] is the only one that predicts potential functional lncRNAs. Due to the overlap between the current test set and the previous training set for EVlncRNA-pred, we employed the current human training set to retrain an SVM model so that both have the same training and test sets. Table 2 shows the performance comparison on the human test set between SVM (EVlncRNA-pred sequence-only model) and EVlncRNA-Dpred. The AUROC, AUPRC, accuracy and MCC for SVM (EVlncRNA-pred) was 0.582, 0.404, 0.657 and 0.077, respectively, compared with 0.896, 0.850, 0.852 and 0.617, respectively, given by EVlncRNA-Dpred. Other traditional machine learning methods (random forest, decision tree and k-nearest neighbor) were examined with the same training and test sets. Their performance is worse than the SVM model, as shown in Table 2.
Performance of EVlncRNA-Dpred, the previous SVM model and other traditional machine learning methods on the human test set
| Model | AUROC | AUPRC | ACC | MCC | Sensitivity | Specificity | F1_score |
|---|---|---|---|---|---|---|---|
| EVlncRNA-Dpred (h) | 0.896 | 0.850 | 0.852 | 0.617 | 0.564 | 0.968 | 0.693 |
| SVM | 0.582 | 0.404 | 0.657 | 0.077 | 0.122 | 0.925 | 0.191 |
| Random Forest | 0.530 | 0.442 | 0.653 | 0.087 | 0.156 | 0.901 | 0.234 |
| Decision Tree | 0.527 | 0.476 | 0.577 | 0.053 | 0.376 | 0.677 | 0.372 |
| K-Nearest Neighbors | 0.532 | 0.468 | 0.670 | 0.116 | 0.117 | 0.947 | 0.192 |
For completeness, we also compared to the current lncRNA prediction methods focused on separating lncRNAs from mRNAs only. Figure 4 compares the ROC curves and PRC curves given by EVlncRNA-Dpred, several deep learning methods (lncRNA_Mdeep [11], lncRNAnet [12], LncADeep [13]) and traditional machine learning methods (CNCI [31], CPC2 [4], PLEK [32]) on our human test set. This comparison was not to illustrate the improvement of our method over previous techniques but to highlight the difference in the prediction goals. These methods trained the models with lncRNAs in GENCODE (could contain both EVlncRNAs and HTlncRNAs) as positives and mRNAs as negatives. As a result, the AUROCs of lncRNA_Mdeep [11], lncRNAnet [12] and LncADeep [13] on human test set all achieved 0.7 (>0.5), the AUROCs of CNCI [31], CPC2 [4], PLEK [32] on human test set all achieved 0.65 (>0.5), but significantly worse than that of EVlncRNA-Dpred as expected (Figure 4A). The same is true for AUPRCs (Figure 4B).
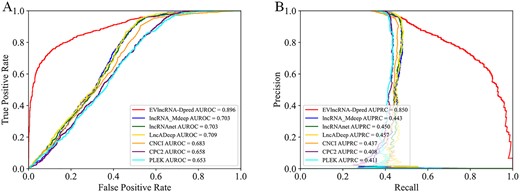
Receiver operating characteristic curves (A) and precision-recall curves (B) on the human test set by EVlncRNA-Dpred (h), several deep learning methods and traditional machine learning methods for separating lncRNAs from mRNA on the human test set.
EVlncRNA-Dpred (m) for predicting mouse EVlncRNAs
Similar to the development of human model EVlncRNA-Dpred, we established mouse model EVlncRNA-Dpred (m) using mouse datasets.
Performance of EVlncRNA-Dpred (m)
The effects of the hyper-parameters in EVlncRNA-Dpred (m) were evaluated and the AUROC of the 5-fold CV test are shown in Figure 5. Unlike EVlncRNA-Dpred (h), the performance is the best for the hyper-parameter k = 7. Like EVlncRNA-Dpred (h), the overall dependence on maxlen is small. Thus, maxlen was set to 4000 as in EVlncRNA-Dpred (h). The performance of the 5-fold CV results of the DNN model, the CNN model and their combination EVlncRNA-Dpred (m) are shown in Table 3. The average AUROC values of 5-fold CV test of the DNN model and the CNN model were 0.782 and 0.685, respectively. The concatenation of the two models improved the AUROC value to 0.816.
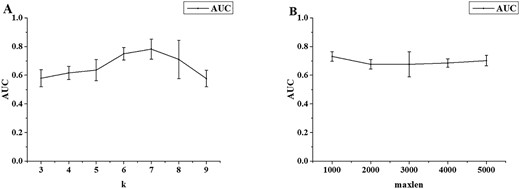
Performance of 5-fold cross-validation on the mouse training set (A) for the k-mer DNN model as a function of k and (B) for the one-hot encoding CNN model as a function of maxlen.
Performance comparison for individual models and combined models in 5-fold cross validations on the mouse training set
| Model | AUROC | AUPRC | ACC | MCC | Sensitivity | Specificity | F1_score |
|---|---|---|---|---|---|---|---|
| DNN | 0.782 ± 0.070 | 0.726 ± 0.076 | 0.766 ± 0.050 | 0.463 ± 0.111 | 0.596 ± 0.071 | 0.851 ± 0.056 | 0.630 ± 0.071 |
| CNN | 0.685 ± 0.030 | 0.569 ± 0.078 | 0.688 ± 0.013 | 0.182 ± 0.113 | 0.068 ± 0.046 | 0.998 ± 0.004 | 0.124 ± 0.083 |
| EVlncRNA-Dpred (m) | 0.816 ± 0.026 | 0.769 ± 0.032 | 0.765 ± 0.054 | 0.482 ± 0.063 | 0.597 ± 0.142 | 0.849 ± 0.144 | 0.627 ± 0.035 |
Comparison on the mouse test dataset
Our previous work did not train models for mouse and plant separately because the sizes of the datasets were too small. For comparison to a SVM-based model, we re-trained an SVM model with the present mouse training set and compared its performance on the mouse test set to EVlncRNA-Dpred (m) and EVlncRNA-Dpred (h) in Table 4. The AUROC and AUPRC values were 0.830 and 0.790, respectively, by the EVlncRNA-Dpred (m). These values are substantially higher than the respective values of 0.604 and 0.419 by the SVM model. The direct application of EVlncRNA-Dpred (h) to the mouse test set yielded 0.652 for AUROC and 0.396 for AUPRC (Table 4). This indicates that human-data-trained EVlncRNA-Dpred (h) retained some capability of distinguishing mouse EVlncRNAs.
Performance of EVlncRNA-Dpred (m), the previous SVM model and EVlncRNA-Dpred (h) on the mouse test set
| Model | AUROC | AUPRC | ACC | MCC | Sensitivity | Specificity | F1_score |
|---|---|---|---|---|---|---|---|
| EVlncRNA-Dpred (m) | 0.830 | 0.790 | 0.808 | 0.551 | 0.534 | 0.945 | 0.650 |
| SVM | 0.604 | 0.419 | 0.662 | 0.135 | 0.219 | 0.884 | 0.302 |
| EVlncRNA-Dpred (h) | 0.652 | 0.396 | 0.612 | 0.294 | 0.781 | 0.527 | 0.573 |
EVlncRNA-Dpred (p) for predicting plant EVlncRNAs
Performance of EVlncRNA-Dpred (p)
We set k = 6 and maxlen = 2000 for EVlncRNA-Dpred (p) after examining the performance dependence of the CNN and DNN models on maxlen and k, respectively, as for EVlncRNA-Dpred (h) and EVlncRNA-Dpred (m). Table 5 compared the performance of the 5-fold CV test of the CNN model, the DNN model and EVlncRNA-Dpred (p). The average AUROC values of the DNN model and CNN model were 0.730 and 0.696, respectively, compared with 0.786 by the combination of these two models: EVlncRNA-Dpred (p).
Performance comparison for individual models and combined models in 5-fold cross validations on plant training set
| Model | AUROC | AUPRC | ACC | MCC | Sensitivity | Specificity | F1_score |
|---|---|---|---|---|---|---|---|
| DNN | 0.730 ± 0.026 | 0.590 ± 0.049 | 0.741 ± 0.025 | 0.388 ± 0.064 | 0.485 ± 0.097 | 0.869 ± 0.048 | 0.551 ± 0.067 |
| CNN | 0.696 ± 0.041 | 0.579 ± 0.045 | 0.700 ± 0.031 | 0.249 ± 0.101 | 0.215 ± 0.100 | 0.942 ± 0.061 | 0.313 ± 0.117 |
| EVlncRNA-Dpred (p) | 0.786 ± 0.064 | 0.673 ± 0.106 | 0.738 ± 0.040 | 0.397 ± 0.067 | 0.500 ± 0.115 | 0.858 ± 0.106 | 0.558 ± 0.047 |
Comparison on plant test dataset
Similarly, we trained an SVM model with the plant training set. Interestingly, now the SVM model has a similar performance as EVlncRNA-Dpred (p) on the plant test set as shown in Table 6. This confirmed the discriminative power of an SVM model for a small dataset of 390 training sequences. The AUROC of the EVlncRNA-Dpred (p) on the plant test set was 0.813, compared with 0.829 given by the SVM model. We also tested the performance of EVlncRNA-Dpred (h) on the plant test set. It provides a reasonable performance despite the species difference.
Performance of EVlncRNA-Dpred (p), the previous SVM model and EVlncRNA-Dpred on the plant test set
| Model | AUROC | AUPRC | ACC | MCC | Sensitivity | Specificity | F1_score |
|---|---|---|---|---|---|---|---|
| EVlncRNA-Dpred (p) | 0.813 | 0.716 | 0.740 | 0.474 | 0.781 | 0.719 | 0.667 |
| SVM | 0.829 | 0.692 | 0.792 | 0.510 | 0.563 | 0.906 | 0.643 |
| EVlncRNA-Dpred (h) | 0.666 | 0.517 | 0.740 | 0.365 | 0.344 | 0.938 | 0.468 |
Case study
Recently, Johnsson et al. [33] studied transcriptional kinetics and molecular functions of lncRNAs. Based on the analysis of single-cell transcriptome data of mouse, the authors experimentally verified seven functional lncRNAs, which have predicted cell cycle expression patterns as measured by RT-qPCR. We applied EVlncRNA-Dpred (m) to the seven lncRNAs. Five of the seven lncRNAs were predicted as EVlncRNAs (positive). The remaining two lncRNAs were predicted with a probability of 0.47 and 0.48, respectively, close to the threshold of 0.5. This result confirms the usefulness of EVlncRNA-Dpred (m) for prioritizing potentially functional lncRNAs.
Discussion
There is an urgent need for the prediction of potentially functional lncRNAs, which could speed up the screening and validation of functional lncRNAs. Due to a limited number of confirmed lncRNAs, we established EVlncRNA-Dpred with small networks and simple sequence features. To the best of our knowledge, EVlncRNA-Dpred is the first sequence-based deep-learning method that predicts potentially functional lncRNAs.
During the development of the method, we have experimented additional features. These include the unpaired and paired bases from secondary structure predicted by RNAfold [34], the solvent accessibility predicted by RNAsnap2 [35]; the protein conservation score from BLASTx that searches a given nucleotide sequence against the protein sequence in the UniProt database [36]; and RNA conservation score calculated with Infernal [37] by searching Rfam databases [38] for RNA structure and sequence similarities. The last two were used in our previous work EVlncRNA-pred. These features were combined with the last hidden layer of DNN model for predicting EVlncRNA. Although the performance for 5-fold cross validation in AUROC was improved from 0.858 ± 0.006 to 0.902 ± 0.007, the performance on the test set was decreased from 0.896 to 0.742, indicating an overtrained model. Thus, the final model only employed k-mer features.
Thus, the new model employed much simpler features than the previous SVM-based EVlncRNA-pred did. EVlncRNA-pred employed GC contents, purine content and other sequence information. These sequence-based features, in principle, can be learned directly from deep neural networks. Moreover, unlike EVlncRNA-Dpred, the full EVlncRNA-pred model is based on conservation features, which are time-consuming to calculate, and high-throughput experimental features, which not all lncRNAs have. EVlncRNA-Dpred can predict faster and apply to all RNA sequences. In addition, EVlncRNA-Dpred have species-specific models for human, mouse and plant. This would allow more accurate species-specific prediction. Requiring species-specific models is consistent with the cumulative evidence suggesting that there is a large difference in the functions and regulatory mechanisms between mouse and human [39–41], not to mention between plant and human.
Our current models, however, are still limited due to the small number of known EVlncRNAs. This problem can be partially addressed by cumulative experimental validation of more and more EVlncRNAs and continuous update of the EVLncRNAs database [10]. Moreover, we hope to develop better deep-learning models that can be learned from a few examples.
To the best of our knowledge, EVlncRNA-Dpred is the first sequence-based deep-learning method that predicts potentially functional lncRNAs.
EVlncRNA-Dpred have species-specific models for human, mouse and plant, and allow more accurate species-specific prediction
The performance evaluations indicate that EVlncRNA-Dpred should be useful for screening lncRNA transcripts for experimental validations.
Data availability
EVlncRNA-Dpred is available as a web server at https://www.sdklab-biophysics-dzu.net/EVlncRNA-Dpred/index.html. The data and source code are freely available at the web server for download.
Funding
National Natural Science Foundation of China (62071085, 61801081, 61671107); Youth Talent Introduction and Education Program of Shandong Educational Committee, Natural Science Foundation of Shandong Province (ZR2021QF143); Talent Introduction Project of Dezhou University (2020xjrc216); Enterprise project (HXKT2022003).
Author Biographies
Bailing Zhou is an associate professor at the Shandong Provincial Key Laboratory of Biophysics, Institute of Biophysics, Dezhou University. Her research includes database construction, omics data mining, machine learning, deep learning and bioinformatics.
Maolin Ding is a graduate student at the School of Computer Science and Engineering, Sun Yat-sen University. He is interested in deep learning and artificial intelligence in bioinformatics.
Jing Feng is an undergraduate student at the Shandong Provincial Key Laboratory of Biophysics, Institute of Biophysics, Dezhou University. She is interested in bioinformatics.
Baohua Ji is an associate professor at the Shandong Provincial Key Laboratory of Biophysics, Institute of Biophysics, Dezhou University. His research includes database construction and bioinformatics.
Pingping Huang is a lecturer at the Shandong Provincial Key Laboratory of Biophysics, Institute of Biophysics, Dezhou University. Her research includes omics data mining, bioinformatics and molecular functional study.
Junye Zhang is a lecturer at the Shandong Provincial Key Laboratory of Biophysics, Institute of Biophysics, Dezhou University. Her research includes biosensors and bioinformatics.
Xue Yu is a lecturer at the Shandong Provincial Key Laboratory of Biophysics, Institute of Biophysics, Dezhou University. Her research includes omics data mining, bioinformatics and molecular functional study.
Zanxia Cao is a professor at the Shandong Provincial Key Laboratory of Biophysics, Institute of Biophysics, Dezhou University. Her research includes dynamic simulation and bioinformatics.
Yuedong Yang is a professor in the School of Computer Science and Engineering and the National Super Computer Center at Sun Yat-sen University. His research interests focus on computational biology, bioinformatics and artificial intelligence.
Yaoqi Zhou is a professor and senior principal investigator of the Institute for Systems and Physical Biology, Shenzhen Bay Laboratory, China. His research interests focus on computational biology, bioinformatics, biophysics and molecular biology.
Jihua Wang is the Director of the Shandong Provincial Key Laboratory of Biophysics, and he is a professor at the Institute of Biophysics, Dezhou University. His research interests focus on computational biology, bioinformatics, biophysics, biosensor and molecular biology.
