


Abstract
Biological pathways are a broadly used formalism for representing and interpreting the cascade of biochemical reactions underlying cellular and biological mechanisms. Pathway representation provides an ontological link among biomolecules such as RNA, DNA, small molecules, proteins, protein complexes, hormones and genes. Frequently, pathway annotations are used to identify mechanisms linked to genes within affected biological contexts. This important role and the simplicity and elegance in representing complex interactions led to an explosion of pathway representations and databases. Unfortunately, the lack of overlap across databases results in inconsistent enrichment analysis results, unless databases are integrated. However, due to absence of consensus, guidelines or gold standards in pathway definition and representation, integration of data across pathway databases is not straightforward. Despite multiple attempts to provide consolidated pathways, highly related, redundant, poorly overlapping or ambiguous pathways continue to render pathways analysis inconsistent and hard to interpret. Ontology-based integration will promote unbiased, comprehensive yet streamlined analysis of experiments, and will reduce the number of enriched pathways when performing pathway enrichment analysis. Moreover, appropriate and consolidated pathways provide better training data for pathway prediction algorithms. In this manuscript, we describe the current methods for pathway consolidation, their strengths and pitfalls, and highlight directions for future improvements to this research area.
Introduction
The continuing advancement in omics science fields in the last decade stimulated the development of many pathway databases. Some are peer-reviewed and manually curated, while others follow a community-based approach to consolidate and refine pathways. In addition, pathway databases serve as knowledge repositories, aiming to represent the pathways’ network in a digital format to be used for several computational analyses. However, these databases often contain pathways defined using database-specific formats, making it cumbersome to include multiple databases in one computational analysis.
Pathway relationships (edges) provide information about the interactions among biological entities such as genes, small molecules, mRNA or proteins identified in a specific experiment such as a microarray investigation. Interactions among biological entities provide knowledge about the interaction flow. There are two types of edges in the classical graph theory representation, oriented and unoriented. Oriented edges specify the direction of a sequence of reactions meaning that the response can happen only in this direction. In contrast, unoriented edges do not provide any information about the information flow. In addition, pathway representation introduces other possible edge types to give information about the activation or inhibition of a biological element. Consequently, the same pathway stored in different databases may lead to inconsistent representation due to the lack of a unique symbolic representation for an edge (i.e. what an arrow means).
Importantly, pathway edges do not include additional annotations concerning the nodes that have context-specific annotations such as cell/tissue or disease type. Edge annotations can reduce the representation inconsistency and add essential information such as temporal and spatial information. The absence of such annotations provides static pathway representation, much like a photo, because the actual drawings cannot reveal what happens before and after taking the picture. Indeed, pathways describe dynamic biological systems, meaning that the interactions among biological elements occur in a precise time for a certain period and are not endless. The static representation also impacts the intertwining among pathways. Thus, edge annotation can contribute to offering more uniform pictures.
Pathway members (nodes) are encoded with different ID formats depending on the database. The KEGG database, for example, uses Entrez Gene IDs for transcripts and proteins, while KEGG Compound IDs are used for metabolites. The Reactome database stores transcripts and proteins using Uniprot identifiers, while ChEBI IDs are used for metabolites. To solve this issue, especially when dealing with multiple pathway databases in a single analysis, a first required step is the mapping of IDs across databases for all three supported omics layers.
Figures 1 and 2 showcase two examples of different representations across databases. For each database, if available, we extracted the cell cycle (G2/M transition)—focusing on the reactions happening around WEE1—or the TCA cycle, focusing on the reactions happening around Succinyl-CoA.
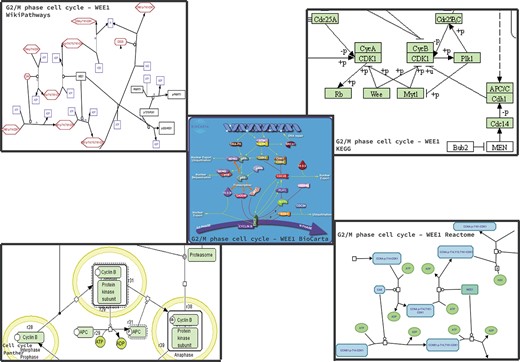
Homo sapiens Cell Cycle pathway maps downloaded from the BioCarta, KEGG, Panther, Reactome and WikiPathways databases. The pathway was not present in HumanCyc. It is worthy to note that, in addition to the graphic differences in the representation of arcs and nodes, proteins, metabolites and enzymes are also represented differently.
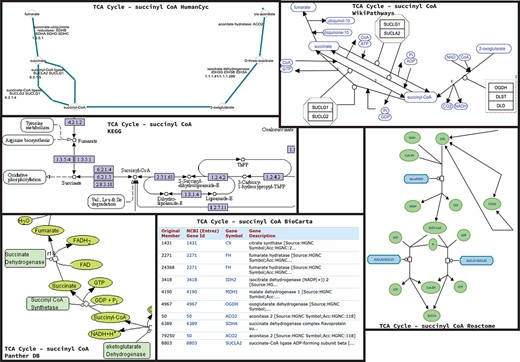
Homo sapiens TCA Cycle pathway maps downloaded from BioCarta, HumanCyc, KEGG, Panther, Reactome and WikiPathways databases. For BioCarta there was no map available, but only the list of genes annotated with TCA cycle. It is worthy to note that, in addition to the graphic differences in the representation of arcs and nodes, proteins, metabolites and enzymes are also represented differently.
Once the mapping is established, it is then necessary to identify the components included in each pathway. Since there is no standard or convention to pathway names, it is even more difficult to perform mapping of pathway names across databases. The introduction of a ‘Pathway nomenclature’ would be useful to address this unwieldy task. Finally, the integration of the same pathway present in different databases requires knowledge of the database, the type of data included and the relationship among pathway members.
The remainder of the manuscript is organized as follows. Section 2 describes the most well-known and used pathway databases. Section 3 illustrates the biological pathways, summing up their representation and organization. Section 4 presents the pathway data formats used to promote the automatic pathway analysis, sharing and memorization. Section 5 introduces the pathway enrichment methods used to link genes within the affected biological context. Section 6 describes the pathway consolidation state of the art pointing out the challenges faced when integrating pathways obtained from different pathway databases. Section 7 presents a case study highlighting the difficulty to perform pathways consolidation and a general list of best practices to produce effective pathway models through consolidation. Finally, Section 8 concludes the manuscript.
Pathway databases
There is no generally accepted pathway definition. Thus, each database can include different pathways, different molecules inside each pathway and different connections among molecules. The consequent substantial discrepancies in pathways databases may influence the outcome of pathway-based analyses [1]. The current version of Pathguide collects and provides information about 702 biological pathway and molecular interaction related resources. Next, we introduce and describe some primary pathway databases covering all the types of pathways and the different approaches they take to curation and file formatting.
Table 1 provides for each database a summary about the number of stored pathways, number of genes/proteins if available and the supported formats used to represent and store pathway data.
A summary of the known information about Homo sapiens organism across the listed databases. (|$\#Pat$|) refers to the number of collected pathways, (|$\#Genes$|) indicates the total number of known genes/proteins, Formats provides information about the supported standard used in each database to represent pathway data
| |${\textrm{DB\ Name}}$| | |${\textrm{\#Pat}}$| | |${\textrm{\#Genes}}$| | |${\textrm{Formats}}$| |
|---|---|---|---|
| Biocarta | |$314$| | |$1396$| | plain text file |
| BioCyc | |$350$| | |$20\,997$| | BioPAX, FASTA, SBML, tabular |
| KEGG | |$551$| | |$19\,618$| | KGML |
| Panther | |$177$| | |$20\,749$| | BioPAX, SBML, SBGN |
| Reactome | |$2553$| | |$31\,506$| | BioPAX, SBML |
| WikiPathways | |$3053$| | |$7858$| | GPML, BioPAX, XGMML, SBGN, SBML, GMT |
Biocarta
Biocarta (https://www.hsls.pitt.edu/obrc/index.php?page=URL1151008585) [2] is a database of maps illustrating common metabolic pathways, signal transduction pathway and other biochemical pathways. Pathway data can be downloaded programmatically by using the provided Rest API or through the Harmonizome web-portal. In the current version, Biocarta provides information on 314 human and 275 mouse pathways (the information about the number of human and mouse pathways are available at https://data.broadinstitute.org/gsea-msigdb/msigdb/biocarta/).
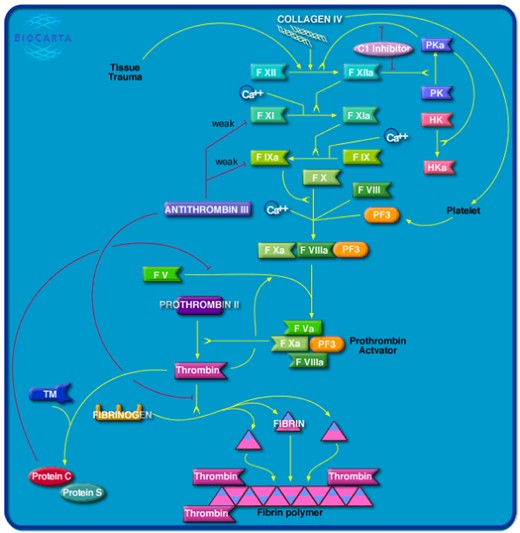
Homo sapiens Extrinsic Prothrombin Activation pathway map downloaded from BioCarta database. Link: https://data.broadinstitute.org/gsea-msigdb/msigdb/biocarta/human/h_extrinsicPathway.gif.
BioCyc
BioCyc (https://biocyc.org) [3] Pathway/Genome Databases (PGDBs) is a collection of pathway and genome data for 20 005 organisms (ver. 26, 13 April 2022), providing data for metabolic pathways and regulatory networks. As a reference, it includes 350 pathways for Homo sapiens. Each organism contains three types of information: (i) computationally inferred information about the metabolic pathways; (ii) Annotation data imported from other databases; (iii) Literature-based curation of new gene functions, pathways, protein complexes, regulation and more. The MetaCyc describes metabolic pathways, enzymes and metabolites from all domains of life. Figure 4 shows a typical pathway visulization in BioCyc. Except for EcoCyc (the manually curated Escherichia coli database) [4] and MetaCyc (the manually curated metabolic pathway database) [5] that are part of the BioCyc genome database collection, the rest of the BioCyc database collection is available via subscription. The whole BioCyc database collection allows data downloading, and data querying through web services.
Homo sapiens TCA pathway downloaded from BioCyc database. Link: https://humancyc.org/cytoscape-js/ovsubset.html?orgid=HUMAN&pwys=PWY66-398.
KEGG
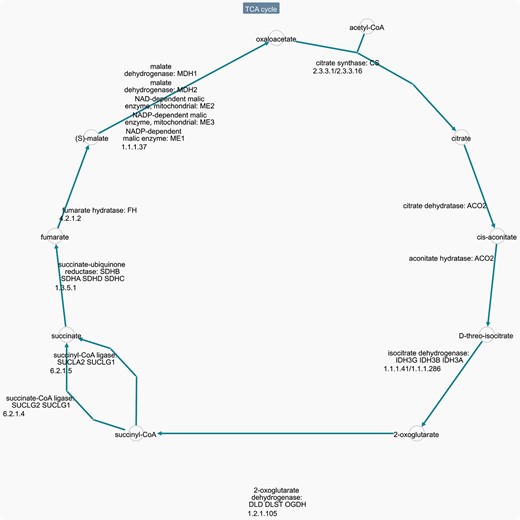
KEGG (https://www.kegg.jp/kegg/) [6] is a pathways database providing a collection of manually drawn pathway maps representing knowledge about metabolism, cellular process, human diseases, drug development, genetic information processing and environmental information processing. All the collected pathways information is organized in classes including metabolic pathways and genetic information pathways. KEGG provides users a web interface to browse each pathway, search and compute biochemical pathways in cellular processes or analyzing the universe of genes in the completely sequenced genomes. Figure 5 shows a common KEGG pathway representation. KEGG pathway data can be accessed by using KEGG API (application programming interface), while the download requires a licence. KEGG API is available only for academic use.
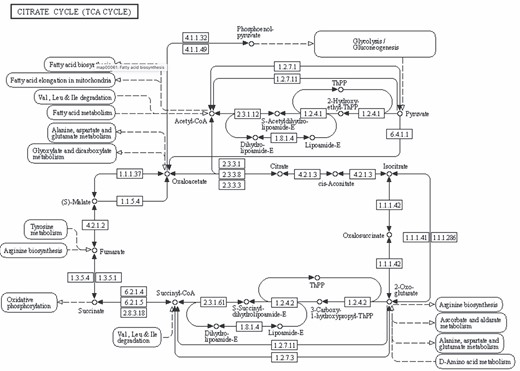
CitrateCycle(TCA Cycle) pathway downloaded from KEGG database. Link: https://www.genome.jp/pathway/map00020.
Panther
PANTHER (http://www.pantherdb.org/) [7] (Protein ANalysis THrough Evolutionary Relationships) classification system annotates proteins and their genes to facilitate high-throughput analyses. The Panther Classifications come from manual literature curation. Panther database includes, among other annotations, metabolic and signaling pathways information. Pathways are represented through a pathway ontology exploiting the SBML format and displayed in diagrams with the CellDesigner. Figure 6 conveys a common Panther pathway representation. Panther in the current version stores pathways from several organisms, including human, for a total of 177 pathways. Data can be accessed using the Panther API, or users may download pathways in the BioPAX, SBML and Protein Sequence Association data format.
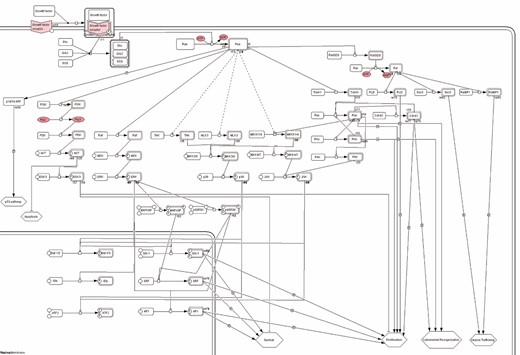
Ras pathway downloaded from Panther database. Link: http://pantherdb.org/pathway/pathwayDiagram.jsp?catAccession=P04393.
Reactome
REACTOME (https://reactome.org/) [8] is a manually curated and peer-reviewed repository of signaling and metabolic pathways and processes. In the current version, Reactome contains pathways for |$15$| different organisms including the Homo sapiens. Reactome includes |$2553$| pathways, and |$11\,071$| annotated proteins for the Homo sapiens. Reactome allows to browse pathways through the Reactome web interface, and to download the data for local analysis using other tools (e.g. BiP [9], cPEA [10], GSEA [11] and pathDIP [12]). Figure 7 displays a standard pathway representation in Reactome. All pathway data are freely available for download in the following formats: Neo4j GraphDB, MySQL, BioPAX, SBML and PSI-MITAB [13] files, and are also accessible through the Reactome Web Services APIs.
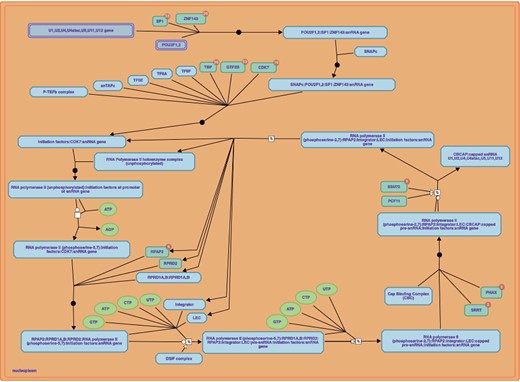
RNA polymerase II transcribes snRNA genes pathway downloaded from Reactome database. Link: https://reactome.org/PathwayBrowser/#/R-HSA-6807505&PATH=R-HSA-74160,R-HSA-73857.
WikiPathways
WikiPathways (https://www.wikipathways.org/) [14] is an open, collaborative platform for the curation of biological pathways. Much like Wikipedia, pathways can be contributed and modified by any person accessing the page. WikiPathways provides a dedicated wiki page, displaying the current diagram, description, editing, references, download options, version history and component gene and protein lists for each pathway. Any pathway can be edited from the embedded pathway editor. WikiPathways are freely available for download as image, in GPML a custom XML format and other formats. Figure 8 shows a common WikiPathways pathway characterization. In addition, data can be accessed programmatically by using the available Webservice/API.
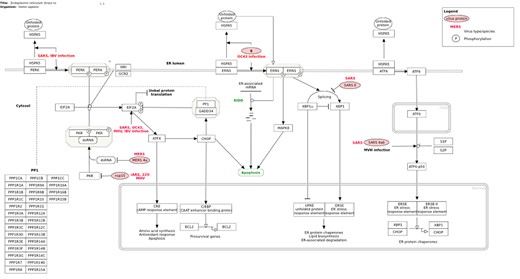
Endoplasmic reticulum stress response in coronavirus infection (Homo sapiens) pathway downloaded from Wikipathways database. Link: https://www.wikipathways.org/index.php/Pathway:WP4861.
Biological pathway
Pathway network representation
An experimental pathway network representation must adequately describe the interactions underlying the signaling, metabolic and genetic processes. A convenient representation of these interactions is through networks. A network is defined by a collection of items, called nodes, with connections between them, called edges. Generally, nodes in biological networks represent biological and physical entities, such as proteins, nucleotides, carbohydrates and small metabolites. In contrast, edges represent the different interactions among physical entities such as, for example, activation, deactivation, phosphorylation. However, a critical aspect is how the pathway processes are represented and implemented into pathway databases. Many biological mechanisms are enabled from the cross-interactions of many nodes belonging simultaneously to several signaling pathways, enabling signal integration among pathways. Indeed, the processes at the base of pathways are intertwined, and processes and pathways should be described and modeled as nodes in a network through pathway ontology constructs. Many representation languages provide pathway ontology constructs, allowing to describe and model pathway interactions, for example gene transcription regulation. Hence, databases using ontology-based language can model several types of pathways interactions, including reactions, biological complexes, depolymerization, positive reaction, etc., as used in Reactome database.
Biological entities in pathways
Each database uses different identifiers to name genes metabolites and proteins, complicating automated data integration, annotation and analysis. Indeed, several different identifiers for genes, transcripts, metabolites and proteins are available such as Entrez Gene IDs , KEGG Compound IDs , Uniprot IDs, Gene Symbols, RefSeq, Ensembl IDs for genes and proteins, and ChEBI IDs, Pubchem IDs for metabolites. The high heterogeneity of identifiers used makes it challenging to employ data mining and artificial intelligence to automate pathway integration and pathway consolidation processes. These activities that have been done manually by researchers are tedious, lengthy and error-prone tasks, and they could add biases, inconsistency and reproducibility issues into any consolidated pathways. Among the listed pathway databases, for example, KEGG uses Entrez Gene IDs to identify transcripts and proteins, while Reactome employs Uniprot IDs. KEGG also uses KEGG Compound IDs for metabolites, and Reactome uses ChEBI IDs.
Pathway compartment organization
Pathways can be thought as composed of several connected and intertwined biological entities, enabling the interactions within the cellular machinery. The identification of functions performed via interaction among those entities, allowed researchers to classify the groups of entities and interactions as functional modules.
Functional modules can be grouped in several different classes that can effectively describe the pathway’ functions according to its cellular location. Metabolic pathways adopted the concept of compartments to effectively represent and elucidate the metabolic reactions and their boundaries. As an example, the glycogen synthesis happens in the cytoplasm. Albeit compartments are very useful to simplify the pathway’s representation and interpretability, pathway databases provide compartment information in very different formats.
Pathway data formats
The number of public and private pathway databases is very large. The main differences between the two include data access, and often level of support and provided annotation. Notably, several large consortia and groups provide public databases of high quality, such as Reactome.
Biologists need both good quality and high coverage of annotation. Broad number of databases provides increased coverage, but with varying quality and complicated access. Thus, integrated database is needed to ensure rich information on pathways is easily accessible and interpretable. Indeed, each database has its conventions of representation and data access methods, making pathways data integration and consolidation from multiple databases a considerable challenge. Hence, there is the need to define a standard pathway representation format that makes it feasible to integrate and consolidate pathways data from different databases. Currently, pathway data are stored using different types of structured representation standards such as XML, Web Ontology Language (OWL) [15], Resource Description Framework Schema (RDF) [16] and XML-based; or unstructured representation standards as plain text txt. The most used structured pathways representation formats include BIOPAX -LEVEL 1,2,3 [17], PSI-MI [18], SBML [19], CELLML [20] and GPML|$[]$|.
The availability of many pathway representation formats introduces a high level of heterogeneity because the same information can be expressed differently, making the automatic data analysis methods, retrieving, consolidation and integration challenging to achieve.
BioPAX -Biological Pathway Exchange- [17] is a meta-language defined in OWL and is expressed in the RDF/XML format. BioPAX aims at being the format of choice to exchange pathway data among databases. It tries to facilitate the integration and exchange of data maintained in biological pathway databases through a unique way to define pathway information. The latest version of BioPAX is Level 3, and it supports the representation of metabolic pathways, signaling pathways (including states of molecules and generic molecules), gene regulatory networks, molecular interactions and genetic interactions.
CellML [20] is an XML-based markup language for describing biological information at various resolutions from the subcellular to organism level through mathematical models. CellML achieves this by providing a comprehensive wordlist representing biological information related to annotation level from the subcellular up to the organism level. It is the only format focused on biological compartments.
GenMAPP Pathway Markup Language (GPML) is an extensible (XML-based) pathway representation format backwards compatible with the GenMAPP MAPP format implying that all information stored in MAPP format can be stored in GPML as well, and pathways can be readily converted. GPML is the file format used to store pathway content at WikiPathways and it is compatible with pathway visualization and analysis tools.
All the listed pathway representation standards are XML-based, computer-readable formats designed to promote the organization, storage, exchange and analysis of pathway databases and annotated experimental evidence. Nonetheless, they do not provide a commonly accepted set of models and rules to comply with, creating a high heterogeneity landscape that makes the consolidation and integration process even more challenging. Even when using a collaborative platform such as WikiPathways, the only one that allows a researcher to directly add new annotations or pathways, provides its own pathway format—GPML. In this scenario, the ability to automatically handle pathway consolidation is restricted and challenging due to the lack of a standard formalism, such as a controlled vocabulary of well-established taxonomies and ontologies suitable for biological pathways.
Pathway enrichment
The principal pathway enrichment analysis (PEA) approaches are Over Representation Analysis (ORA), Gene Set Enrichment Analysis (GSEA) and Topological Enrichment Analysis (TEA). The differences among these complementary approaches are characterized by the used pathway database, the implemented statistical method and the required input data.
Pathway databases play a crucial role in the enrichment results because the choice of the proper database allows researchers to obtain relevant answers (e.g. enriched pathways) to their questions independently from the used enrichment method. In this regard, to obtain relevant results it is necessary to know the features and data included in the database to be used. When analyzing metabolite lists, for example, researchers must choose a metabolic database such as BioCyc or Reactome. Reactome database is also suitable for analyzing signaling pathways, whereas BioCyc is not because it does not contain any signaling pathways data. The input lists to analyze drive the database choice, but it can also influence the PEA method to use. Next, we describe briefly the methods and what is needed for each analysis, but a more detailed review on the enrichment methods was recently published [21]. The input data heavily impact the enrichment results. As best-practice, the input lists should be preprocessed before computing enrichment. The goal of the preprocessing is to reduce the number of entities to use to compute the enrichment, and to map the identifiers of the list to the identifiers of the database. Huge number of entities reduces the number of enriched pathways or provide a specific pathway, while shorter lists can provide enrichment of pathways more specific to the analysis at hand. Statistical tests are mechanisms to determine the probability that an observed phenomenon, in the data or in a cell, is not due to chance. Thus, researchers must be aware when using a statistical test instead of another because this choice heavily impacts the final results [22]. These factors increase the computational power in PEA analysis compared with the use of a generic statistical test. Another aspect regards the statistical correctors employed to limit the occurrences of false positives due to multiple statistical tests. Hence, the enrichment results depend on how conservative is the implemented corrector. The most frequently used statistical correctors are Bonferroni and False Discovery Rate (FDR). Researchers must choose Bonferroni correctors when false positives are an issue. Instead, FDR should be used if type I errors are acceptable. Nonetheless, each methodology produces different output lists of relevant pathways.
Over Representation Analysis (ORA) [23]: ORA methods assess the preliminary candidate list of biological entities provided by the user. ORA method relies on the hypothesis that the gene list of interest can be used for detecting relevant pathways if the overlap of the gene list with the genes in a pathway exceeds the overlap that could be randomly expected. ORA is the most generic and widely used method as it does not require other data than the list of genes of interest and the genes annotated with each pathway. Subsequently, the enrichment score is computed using an iterative methodology evaluating the fraction of overlaps between the candidate genes and the genes belonging to the current pathway. The relevance for each overlap is calculated using statistical tests such as the chi-square, hypergeometric, Fisher’s exact test. The final result of the ORA method is a list of relevant pathways ordered according to the computed enrichment score. The more pathways are tested using ORA, the less likely it is to retain statistical significance after correction, hence why consolidation could provide a stronger signal for important pathways. Moreover, smaller pathways have a higher probability of being significantly enriched due to one or two genes being annotated with that pathway, while to achieve significance using bigger and consolidated pathways it is necessary to have a stronger signal in the list of interest.
Gene Set Enrichment Analysis (GSEA) [11]: GSEA methods rely on the hypothesis that all the up and down expressed entities have a meaningful effect on a pathway. In this way, they can use all the data without being necessary to use a threshold to discard entities. GSEA approaches rely on a three phase methodology to calculate the enrichment score using the entire ordered gene list, including expression values, fold changes, P-values, ranking, etc. The first phase concerns in identifying the statistically most relevant genes. The second phase consists of aggregating each gene’s significance into pathway statistics. The last phase regards the computing of the pathway’s statistical relevance. GSEA, as a final result, produces an enrichment score for the supplied gene set. The main advantages of GSEA are that it uses all the available genes without requiring to define a threshold value, and it can detect genes involved across different pathways. Some drawbacks are that GSEA methods still give the same significance to all biological entities and independently analyzed pathways.
In a pathway, multiple genes are up- or down-regulated at the same time. The enrichment score takes into account also the level of deregulation and the number of genes up- or down-regulated, and it is obvious that the same pathway containing different sets of genes (and consequently different patterns of expression) will have different enrichment scores [24]. A consolidated pathway would reduce this issue [25]. Note that this will still not resolve the interpretation of activated/de-activated pathways based on up- and down-regulated genes, as the relationship has to consider which entities are inhibitors versus activators and how the complex signaling cascade may be modified with different gene expression pattern.
Topological Enrichment Analysis (TEA) [26]: TEA approaches are equivalent to the ORA and GSEA methods but combine the data with the available pathway’s topological information to calculate the enrichment score for the pathways. The fundamental hypothesis of TEA methods is that the interactions found in pathway topology provide more information for assessing the statistical significance of the enriched pathway. The goal is to explicitly reveal the interaction among the most relevant genes of interest and the pathway’s genes, highlighted by the pathway topology. Topological information allows TEA to classify entities by their influence over the pathway. Furthermore, taking into account different topological details, it is possible to enable a more careful analysis of the same set of pathway entities. Since pathway topology introduces one more level of complexity to the previous analyses, analysis of multiple pathways leads to higher variability. Similarly to GSEA, TEA can provide activation status for one pathway in one database and inhibition status for the same pathway in another database. Pathway consolidation could reduce this issue [25] and, if the consolidation includes edges and their annotations, provide a more reliable background for TEA analysis.
Pathways consolidation
Many efforts have been made to integrate pathways from multiple sources. Some approaches unify pathways by collecting pathways from different sources as one big database, with a specific focus. Pathway Commons [27] applies the same format (BioPAX) to represent pathways and interactions about cellular processes from nine public databases of multiple species, to facilitate users to search and download pathways from multiple sources represented in a common language. Various identifiers in the source databases are normalized to consistent ID representation in Pathway Commons. ConsensusPathDB [28] integrates pathways from 32 public databases for human molecular interactions, as well as 15 mouse and 14 yeast databases. When putting pathways together, it focuses on annotations of molecular interactions, such as gene regulations, protein interactions and biochemical reactions. Various tools are provided to perform PEA and build network modules to explore the interactions. pathDIP [29] integrates pathways from 24 sources on six model organisms and 10 domesticated animals. It also provides web service for searching and enrichment analysis. To address the challenge of low proteome coverage, pathDIP predicts significant physical associations between proteins and curated pathways. These integrated databases provide the benefits of increased coverage of biological processes and unified access to pathways, yet the challenge of redundancy and inconsistency in pathways remains. PathCards [30] consolidates pathways from 12 databases and creates consolidated superpathways. Unfortunately, the pathways can only be browsed or searched. There is no enrichment tool nor download function in the website.
Consolidation aims at reducing the redundancy and discrepancy by merging similar pathways. In some works, the idea is to group together pathways that have a large overlap in their gene members so that pathways in the same group may have similar biological functions. Hence, a group represents a coherent function and there is less redundancy since the overlap across groups is small. In such work, the topology of pathways is usually ignored and only gene membership is considered. Belinky et al. [30] show the legitimacy of this strategy by comparing a gene content-based method with a topology-based approach on the task of pairwise pathway alignment. To merge similar pathways, a clustering method is often explored while the measurements of pathway similarity are different. Belinky et al. [30] first applied hierarchical clustering to obtain the cluster cores. Then the clusters are extended by joining every pathway to its most similar pathway, i.e. the one with the highest similarity score measured by Jaccard coefficient of overlapped genes. Using this method, 3215 human pathways from 12 sources are consolidated into 1073 clusters and included in PathCards. Chen et al. [31] also explored a hierarchical clustering approach to construct pathway clusters, with a slightly different similarity measure. Pathways from three databases for three organisms human, mouse and rat are grouped. Doderer et al. [32] explore three approaches to build pathway clusters. In two of them a set of differential genes is used to run ORA and the similarity of pathways is measured using the enrichment. In one method genes are progressively removed if they belong to the most significant pathways and enrichment is re-performed. Any pathway that is not enriched anymore is consolidated with the most enriched from the previous round. In the second one, genes are weighted according to the interactions they have inside a pathway compared with intera ctions they have in the entire genome. Weights for overlapping genes between the pathways are then compared with the weights between overlapping genes enriched in those pathways and provide a similarity measure. Similar pathways are then consolidated. The third approach explores hierarchical clustering and is independent of the enrichment. Clustering is combined with Jaccard Index measures calculated via gene membership, ‘Guilt-by-function’ via Gene Ontology, and ‘Guilt-by-association’ via protein–protein interactions. Similar pathways are then combined; 2665 human pathways from six sources are consolidated in this work. A merit of exploring hierarchical clustering is that granularity of pathway groups can be adjusted naturally by using different cutoff thresholds. Nonetheless, it is difficult to choose the right threshold to get the optimum number of clusters. A metric was developed in [30] to find the optimal parameters taking into account the redundancy of pathways and gene-related pathway informativeness.
Another challenge in clustering-based approaches is the validation of the pathway clusters as there is no standard benchmark and metrics to assess them. Most often the validity of pathway clusters is shown by their effectiveness in target prioritization and biological relevance. Effectiveness of pathway clusters is often shown by comparing the clusters with single pathways on enrichment analysis tasks, even if this does not assess how correct the clustering is.
Belinky et al. [30] claim that SuperPaths (the constructed pathway clusters) reveal new connections between genes and pathways. Gene pairs suggested only by SuperPaths have more shared publications and more protein interactions compared with random pairs. Several assessments were conducted in [31] to show biological coherence of their pathway clusters. One assessment is to compare the Gene Ontology term similarity between constituent genes of a pathway pair within a cluster to that of two pathways from different clusters. The results show that the within-cluster similarity is significantly higher than cross-cluster, suggesting that the pathways within a cluster are functionally more closely related. While [30] and [31] perform quantitative assessments of pathway clusters, [32] conducted case study of enrichment analysis using the generated clusters and shows the biological relevance of the clusters by analyzing specific examples.
In the picture, the pieces with the same color indicate matching by name, meaning that pathways have the same name in both repositories. Nevertheless, the match is partial due to an incomplete protein overlap between KEGG and Biocarta pathway representation. Reactome on the protein list level is a superset to both KEGG and Biocarta databases, but include other proteins not contained in either of the two databases.
Although gene content similarity makes up the base that two pathways may be merged, it is not exclusive. Intuitively, the name of a pathway depicts its theme, e.g. its function or the major components, which may be very helpful in consolidation. Nonetheless, the name evidence is not explored in all the three approaches. As mentioned in [30, 32], the challenge of exploring pathway names is the inconsistency between name similarity and gene content similarity, i.e. pathways with similar names may have very different genes and vice versa. Yet this inconsistency may suggest the complementary role of name evidence in pathway consolidation. Methods exploring names may find it a very beneficial clue. Furthermore, these approaches still face the challenge of interpreting the similar pathways in the same cluster, i.e. lacking of a fine-grained relation description between pathways within a cluster, especially when the clusters vary with different cutoff thresholds.
In addition to the automatic approaches, manual curation is also performed to address the challenges of pathway merging [33–35]. Domingo et al. [36] developed a platform that facilitates curating mappings across pathway sources. Mappings between three databases KEGG, Reactome and WikiPathways were curated manually. While manual curation has the advantage of annotating specific relations between pathways such as equivalence and parent-child, there are only a few source databases due to high demands of human curation (even with the provided platform). Pathway Ontology [37] made the effort to build a unified organization of pathway functions that cover all types of pathways. The ontology provides a reference on the themes covered by available pathway sources as well as their relationships. As the ontology terms often describe synthesized concepts, it is challenging to build the connection between a pathway name and an ontology term, similarly to the mapping between pathway names as described above. Moreover, no mapping is currently available between the Pathway Ontology and other databases.
Case study
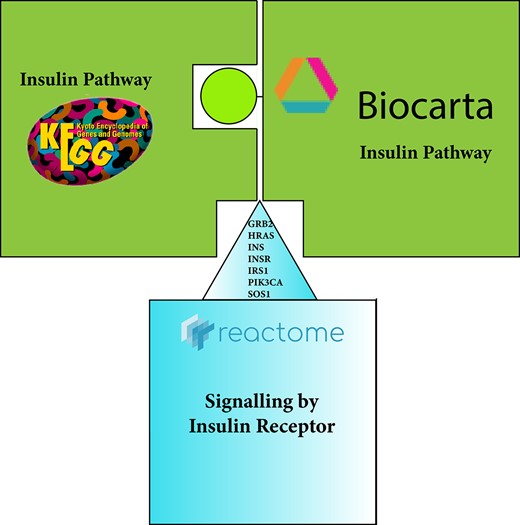
Due to many of the issues mentioned before, the same pathway can be presented in alternative ways in different databases. We will look, as an example, to the insulin signaling pathway. Starting from the name, we can see that the pathway is called insulin signaling pathway in KEGG and BioCarta, while in Reactome signaling by insulin receptor. While this is a minor difference in manual curation, it can create issues when performing automatic name overlaps without text mining techniques. Figure 9 shows this aspect as a difficult to fit puzzle pieces.
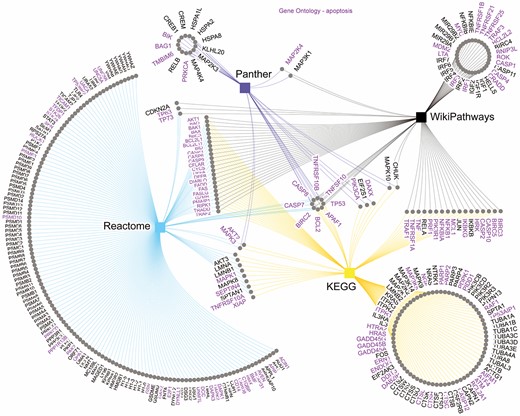
Genes annotated with apoptosis pathway across KEGG, Reactome, Panther and WikiPathways databases. The purple genes are annotated with Gene Ontology Apoptotic Process. Edges color resemble the color of the database nodes, indicating which database each gene is present in. Nodes connected by only one edge represent genes present only in one database. As visible, only eight genes are annotated with apoptosis pathway in all four databases.
The number of proteins is different as well. The insulin signaling pathway includes 11 proteins in BioCarta and 62 proteins in KEGG, respectively, whereas the signaling by insulin receptor holds 85 proteins in Reactome. In addition, the PIK3R1, PTPN11, SHC1, SLC2A14 proteins included in the BioCarta and Reactome pathways are missing in the KEGG one. Table 2 shows the proteins in the signaling by insulin receptor pathway used in BioCarta and the overlap with KEGG and Reactome proteins.
The overlap between BioCarta insulin pathway representation proteins with the KEGG and Reactome representation.
| BioCarta proteins | KEGG | Reactome |
|---|---|---|
| GRB2 | yes | yes |
| HRAS | yes | yes |
| INS | yes | yes |
| INSR | yes | yes |
| IRS1 | yes | yes |
| PIK3CA | yes | yes |
| PIK3R1 | No | yes |
| PTPN11 | No | yes |
| SHC1 | No | yes |
| SLC2A14 | No | yes |
| SOS1 | yes | yes |
| BioCarta proteins | KEGG | Reactome |
|---|---|---|
| GRB2 | yes | yes |
| HRAS | yes | yes |
| INS | yes | yes |
| INSR | yes | yes |
| IRS1 | yes | yes |
| PIK3CA | yes | yes |
| PIK3R1 | No | yes |
| PTPN11 | No | yes |
| SHC1 | No | yes |
| SLC2A14 | No | yes |
| SOS1 | yes | yes |
Finally, comparing the insulin pathway representation through the three databases, each provides different information. BioCarta holds information about the C-JUN transcription factor, missing from KEGG and Reactome representation. KEGG gives information about the Apoptosis pathway missing from BioCarta and Reactome. Reactome contains information about the m-TOR signaling pathway, which is missing from KEGG and BioCarta.
Similarly, an analysis of ‘apoptosis’, a very common and well-studied pathway, in four different databases (KEGG, Reactome, Panther, WikiPathways) reveals the very poor overlap of genes annotated with such pathway across databases, as conveyed in Figure 10.
While these are just two simple examples, a comprehensive pathway comparison across databases revealed a poor overlap across major databases (Figure 2C in [38]). This adds up to the difficulties and limitations of the various biological information used to describe pathways when performing automatic and/or manual pathway consolidation or integration. Because each research group investigates a natural phenomenon from its point of view, it can lead to providing different information, making pathways integration/consolidation from multiple databases challenging across contexts (cell types, diseases, developmental stages, etc). The choice of the databases with which to perform the consolidation is a crucial aspect—combining the insulin pathway from KEGG and BioCarta, due to the different numbers of proteins involved in both representations, can yield inaccurate integration due to the loss of relevant topological information. Because there is no complete overlap between KEGG and BioCarta, this can produce disconnected network modules, leading to an inaccurate interpretation. However, integrating Reactome and BioCarta, this situation may not occur. Many pathway integration and consolidation methods use protein interaction networks to retrieve interactions and directions among the proteins [6]. In addition, the choice of the databases strongly impacts the validation of the results because the validity depends on the pathway representation formats used. Interpreting results affected by various overlapping biological representations can lead to approximate assumptions.
Researchers must follow some best practices to overcome the pathway heterogeneous representation to effectively deal with pathway data from multiple pathway databases and obtain actionable knowledge. Some actions to be taken to mitigate the heterogeneity between pathways to get new, more informative pathway models through consolidation and integration are listed below:
(1) Researchers should choose the pathway databases that contain the same type of pathways, reducing the noise from non-overlapping pathways and contributing to producing more effective new pathway models through consolidation.
(2) When possible, researchers must download pathway data in the same format. The common representation format simplifies and makes the consolidation process more effective. Performing data harmonization and normalization manually through several scripts is a long, tedious and error-prone process even for bioinformaticians.
(3) Researchers, before using automatic merging techniques such as text mining or Natural Language Processing (NLP), must investigate the data organization to determine the best features to use for adequately setting the text mining or NLP method, contributing to obtaining adequate pathway models.
Conclusion
As discussed throughout this paper, pathway consolidation is still in its infancy. Several issues linked to the naming of genes, proteins, metabolites and pathways prevent an easy integration of pathways described in different databases. The integration is further complicated by differences in file formats, edges presence and annotation and cellular localization annotation. While several groups attempted pathway consolidation, the results are still limited to few databases due to the aforementioned challenges. These issues combined with the complete absence of reference pathways make consolidating pathways analogous to building a puzzle with non-matching pieces and no reference picture.
Biological process research generated an unprecedented volume of data, which makes selecting the best data, tools and analysis challenging.
This paper provides a list of challenges to face when it is needed to perform pathway integration, annotation and consolidation using data coming from heterogeneous databases.
We provide an overview of the main challenges in pathway integration, annotation and consolidation and highlight best practices to gain insight into the available pathway data.
Author contributions statement
G.A. and C.P. conceived the paper. G.A., Y.N., C.P. and I.J. wrote and reviewed the manuscript.
Data availability
All data analyzed for this study are available in the reviewed online databases.
Acknowledgments
This research was funded in part by grants to IJ from Ontario Research Fund (|$\#34876$|), Natural Sciences Research Council (NSERC |$\#203475$|), Canada Foundation for Innovation (CFI |$\#29272$|, |$\#225404$|, |$\#33536$|) and CIHR-Eranet Neuron (|$\#NOD-168163$|).
Author Biographies
Giuseppe Agapito is an Assistant Professor at the Magna Græcia University, Catanzaro, Italy. His research interests include biological networks and genomics data analysis using parallel computing.
Chiara Pastrello is a Research Associate at the Schroeder Arthritis Institute, Toronto, Canada. Her research interests include network biology and integrative computational biology.
Yun Niu is a Research Associate at the Krembil Research Institute, Toronto, Canada. Her research interests include machine learning and natural language processing in biomedical domain.
Igor Jurisica is a senior scientist at Schroeder Arthritis Institute and a professor at UofT. His interests include integrative computational biology, and explainable modeling and analysis of chronic diseases.
