


Abstract
The link between tumor genetic variations and immunotherapy benefits has been widely recognized. Recent studies suggested that the key biological pathways activated by accumulated genetic mutations may act as an effective biomarker for predicting the efficacy of immune checkpoint inhibitor (ICI) therapy. Here, we developed a novel individual Pathway Mutation Perturbation (iPMP) method that measures the pathway mutation perturbation level by combining evidence of the cumulative effect of mutated genes with the position of mutated genes in the pathways. In iPMP, somatic mutations on a single sample were first mapped to genes in a single pathway to infer the pathway mutation perturbation score (PMPscore), and then, an integrated PMPscore profile was produced, which can be used in place of the original mutation dataset to identify associations with clinical outcomes. To illustrate the effect of iPMP, we applied it to a melanoma cohort treated with ICIs and identified seven significant perturbation pathways, which jointly constructed a pathway-based signature. With the signature, patients were classified into two subgroups with significant distinctive overall survival and objective response rate to immunotherapy. Moreover, the pathway-based signature was consistently validated in two independent melanoma cohorts. We further applied iPMP to two non-small cell lung cancer cohorts and also obtained good performance. Altogether, the iPMP method could be used to identify the significant mutation perturbation pathways for constructing the pathway-based biomarker to predict the clinical outcomes of immunotherapy. The iPMP method has been implemented as a freely available R-based package (https://CRAN.R-project.org/package=PMAPscore).
Introduction
Immune checkpoint inhibitor (ICI) therapy, which unleashes a patient’s own T cell to kill the tumor, has profoundly altered the therapeutic landscape for patients with advanced-stage cancers. The primary approved agents include T-lymphocyte-associate antigen 4 (CTLA-4), programmed cell death protein 1 (PD-1) and programmed cell death-ligand 1 (PD-L1). However, only a minority of patients achieve clinical benefit from ICI therapy, which highlights the clinical need for identifying better predictive biomarkers.
Recently, tumor mutational burden (TMB), a measure of the total number of nonsynonymous mutations present in a tumor specimen, has garnered considerable attention. The retrospective evidence demonstrated that TMB can predict the efficacy of immunotherapy in solid tumors [1–7]. Researchers found that T cells recognize neoantigens produced as a result of mutations and presented by major histocompatibility complex (MHC) proteins on the surface of cancer cells, and target those cells for destruction. Therefore, higher TMB leads to more neoantigens, thereby increasing the chances for T-cell recognition and then improving the efficacy of immunotherapy. However, Goodman et al. [8] found that poor presentation of driver mutation neoantigens by MHC-I may lead to tumors that do not respond to immune checkpoint blockade (ICB) (even with a high TMB). Shin et al. [9] also found that JAK1/2 loss-of-function mutations can lead to acquired and primary resistance to anti-PD-1 therapy, even in the setting of high TMB, indicating that TMB may not always correlate with ICI responsiveness. Furthermore, there is still no consensus on the definition of TMB cutoffs for patient stratification, because of the tumor heterogeneity in TMB levels [2, 4, 10–12]. Both these studies indicated that TMB is an imperfect predictive biomarker and better predictive biomarkers are needed for immunotherapy response prediction.
Recent genomic studies have reported that TMB-based survival prediction can be improved by establishing gene mutation-based signatures [13–16]. The accumulation of a characteristic set of mutations in specific tumor suppressor genes and oncogenes will activate critical pathways associated with cancer initiation and progression [17]. And previous studies demonstrate that even when patients harbor mutations in different genes, these genes often participate in a common pathway [18–20]. Therefore, capturing the pathways, which are activated by accumulated somatic mutations, may provide new insights into the prediction of immunotherapy efficacy and the development of novel agents. Although there are a few pathway-based mutation signatures currently available for immunotherapy response prediction, they have some important limitations. For example, some approaches consider only the mutation status of pathways (if any one of the genes involved in the pathway is mutated, the pathway is defined as mutated), but ignore the position and the cumulative effect of gene mutations in the pathways [21]. In addition, they treat all gene alterations as equal, which may be unsatisfactory from a biological point of view, as alterations in genes at different positions in the pathway have different effects on the pathway [22]. Taking the insulin signaling pathway as an example, the insulin receptor (INSR) locates at the upstream of the pathway and if the INSR is not present, the entire pathway is shut off. On the contrary, if several genes are involved in a pathway but only appear somewhere downstream, alterations in those genes may not affect the given pathway as much [22]. Therefore, the pathway model considering the position and the cumulative effect of gene mutations would be extremely meaningful for immunotherapy response biomarker development from a biological perspective, but currently, there is no approach to do this.
In this study, we innovatively developed a method called iPMP (individual Pathway Mutation Perturbation) that combines the evidence of the cumulative effect of mutated genes with the position of mutated genes in the pathways to measure the mutation perturbation extent of pathways. In iPMP, we first mapped the mutations to genes in the pathways to calculate the pathway PMPscores for each patient, and then obtain a pathway PMPscore matrix, which allowed us to identify the pathways associated with clinical outcomes. In a melanoma cohort treated with ICIs, we identified seven significant perturbation pathways based on the pathway PMPscores, and a pathway-based risk score signature was constructed with these pathways. With the pathway-based signature, patients were classified into two subgroups with significant distinctive prognoses (log-rank test P < 1.10e–4) and immunotherapy responses (Chi-square test P = 7.10e−03). The prognostic and predictive value of the pathway-based signature was consistently validated in the two independent melanoma immunotherapy cohorts. Moreover, the pathway-based signature had a superior predictive value of immunotherapy efficacy than that of TMB. Additionally, we applied the iPMP method to non-small cell lung cancer (NSCLC) cohorts, and it also presented good performance. Finally, to expand our approach usage, we implemented it as a freely available R-based package (https://CRAN.R-project.org/package=PMAPscore).
Materials and Methods
Data source
To illustrate the effect of the iPMP method, we applied it to melanoma and NSCLC patient cohorts treated with ICIs. For the melanoma analysis, the training set was collated from previous published clinical cohorts of patients treated with T-lymphocyte-associated protein-4 (CTLA-4) blockade, which was composed of 105 metastatic melanoma patients (n = 105 for Van Allen et al.) [23]. In the subsequent validation phase, we employed two immunotherapeutic cohorts: (1) Miao et al. cohort, containing 141 melanoma patients treated with CTLA-4 blockade [24]; (2) Snyder et al. cohort, composed of 55 melanoma patients treated with CTLA-4 blockade [5]. For NSCLC analysis, we collated a total of 68 patients with lung cancer treated with PD-1 plus CTLA-4 blockade from the Hellmann et al. study [25] to construct the lung cancer model. A cohort from the Rizvi et al. study (n = 33) [3] was downloaded as the validation cohort for the lung cancer model. Patients from the above cohorts were available for whole-exome sequencing, overall survival (OS), progression-free survival (PFS) and immunotherapy response. In our study, we extracted the nonsilent somatic mutations in gene-coding regions, including missense, nonsense, insertion, deletion and splice mutations. PFS and OS were defined as the time elapsed between the date of immunotherapy initiation and the date of disease progression or death from disease, or the date of the last follow-up, respectively. If the OS was not available for cohorts, PFS was used. The tumor immunotherapy response was defined by the Response Evaluation Criteria in Solid Tumors 1.1 (RECIST 1.1) criteria. Patients who experienced a complete response or partial response were classified as responders; patients who experienced stable disease or progressive disease were classified as nonresponders. The information of all the cohorts used in our study was listed in Supplementary Table S1 (see Supplementary Data available online at https://dbpia.nl.go.kr/bib).
Acquisition of pathway data
Signaling pathways generally control cell-cycle progression, apoptosis and cell growth, which are common hallmarks of cancer. And compared with metabolic pathways, the signaling pathways tend to be stimulated by the external environment, such as immunotherapy with ICIs. Thus, we focus on the signaling pathways in the study. Somatic mutations in these pathways may not only produce neoantigens but may also functionally affect the outcome of immunotherapy. We used the pathways from the KEGG database [26], which uses the KEGG Markup Language (KGML) to define the whole set of pathway elements, including entities, properties and relationships between a pair of entries. A KEGG pathway is a graph whose nodes are the entities, representing genes/proteins, and edges are the relations, representing gene signals or interactions such as activation or repression. In our study, we downloaded KGML files of 123 signaling pathways from the KEGG database (Release 101.0) and extracted the structure of the pathways from the KGML files using the ‘makeSPIAdata’ function in the package ‘SPIA’ [22]. The detailed information on KEGG human signaling pathways was deposited in our ‘PMAPscore’ package.
Calculate the pathway mutation perturbation score
Previous studies have revealed that the accumulation of a characteristic set of mutations will activate the critical pathways, such as DNA damage response (DDR) pathways, thus resulting in a durable clinical benefit from ICBs [27–30]. To obtain these activated pathways, we mapped the mutations to the genes and screened candidate genes using the following criteria: (i) the gene has to be mutated in more than a certain percentage of patients with cancer (the default value is 3%, and the users could select their interested percentage of patients by using our ‘PMAPscore’ package); (ii) mutations in the gene have to be correlated with a survival benefit, for example, its hazard ratio (HR) < 1 in the univariable Cox proportional hazards regression analysis. This is because we intend to identify the mutation pathways which were positive correlation with the clinical outcomes of immunotherapy.
Construct the pathway-based risk score signature with PMPscore profiles
To test whether the PMPscore could predict the efficacy of immunotherapy, we first performed the differential analysis of the PMPscore between the alive and deceased samples, because OS is the current gold standard for valid end points in cancer ICI trials [31]. The Wilcoxon rank-sum test was performed to identify the significant differential PMPscore pathways. Then, a univariable Cox proportional hazards regression analysis was used to assess the association between the PMPscores of significant differential pathways and survival status (alive and deceased). To further narrow the scope of the candidate pathways, the least absolute shrinkage and selection operator (LASSO) regression was used to select the potential predictive pathways that provided optimal diagnostic value while minimizing overfitting, and the regression shrinkage parameter was determined using 10-fold cross-validation. We selected the LASSO regression in the study because of its appealing ability to choose route features that are associated with survival while also estimating the coefficients in the Cox model. The obtained feature pathways were then used to construct the pathway-based risk score signature through the multivariable Cox proportional hazards regression analysis. Then the median value of the pathway-based risk score was used to stratify patients into high-risk and low-risk groups. Kaplan–Meier survival analysis was used to estimate two subgroups’ survival distributions and the performance of the pathway-based signature was investigated by the receiver operating characteristic (ROC) curve. The Chi-square test was further performed to test the difference in objective response rate (ORR) for immunotherapy between high-risk and low-risk groups.
Results
Inference of the PMPscore profiles to construct the pathway-based signature in the melanoma cohort
We developed a novel iPMP method to measure the mutation perturbation extent of biological pathways by integrating the somatic mutation data and pathway structure information. Figure 1 illustrates the overview of the iPMP method. In iPMP, somatic mutations on a single patient sample were mapped to genes in a single pathway to infer the PMPscore, which captures the importance of the position of the mutated genes in the pathway as well as the evidence of accumulation of mutated genes (see Materials and Methods section). The method produces a matrix of integrated PMPscores, where the rows represent pathways, the columns represent patients and the elements represent PMPscores. The PMPscore matrix can be used in place of the original mutation datasets to identify associations with clinical outcomes.
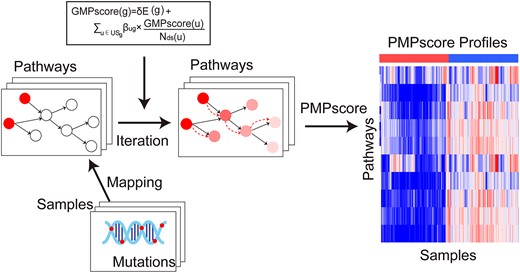
Flowchart of iPMP method.
To test if the PMPscores could be used to identify the biomarker predicting the clinical outcomes, we first applied the PMPscore model to the melanoma patient cohort treated with CTLA-4 inhibitors, and then the univariable Cox proportional hazards regression analysis was performed to assess the association between each gene mutation (mutation frequency |$\ge$| 3% in all cancer patients) and clinical survival data. With HR < 1, 3028 survival benefit mutated genes were retained and mapped to the pathways. Then an individual PMPscore was calculated for each pathway to reflect the pathway perturbation extent triggered by the mutated genes (see Materials and Methods section). With the PMPscore profiles, the Wilcoxon rank-sum test was then performed to identify differential PMPscore pathways, and 18 statistically significant pathways remained (P-value <0.05). To further narrow the scope of the candidate pathways and to prevent overfitting, the univariable Cox proportional hazards regression analyses and LASSO regression were successively performed, which result in seven-candidate pathways (Figure 2A), including gap junction, Janus kinase/signal transducers and activators of transcription (JAK-STAT) signaling pathway, epidermal growth factor receptor (EGFR) tyrosine kinase inhibitor resistance, Fanconi anemia pathway, cytokine-cytokine receptor interaction, hypoxia-inducible factor 1 (HIF-1) signaling pathway and taste transduction. Most of these pathways have been reported to be associated with cancer initiation, progression and drug response. For example, the Fanconi anemia pathway is a biochemical network that assists in DNA repair, DNA replication and other cellular processes, and mutations in this pathway may induce a hypermutation phenotype, resulting in a durable clinical benefit from ICBs [32, 33]. The HIF-1 signaling pathway plays an important role in the pathogenesis of cancer and is considered as a viable pharmacological target in the treatment of solid tumors [34, 35]. And the JAK–STAT signaling pathway, which is related to tumorigenesis and development, is a critical cytokine pathway involved in proliferation, and the immune and inflammatory responses [36]. Researchers also find that cytokines can control proliferation, differentiation, effector functions and survival of leukocytes, and thus have been explored in the treatment of cancer [37–39].
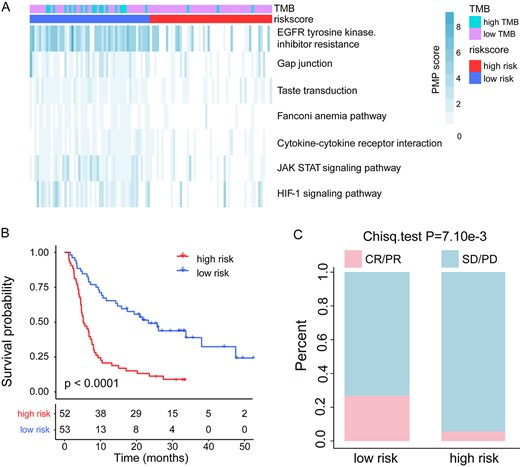
Prediction of clinical outcomes with the pathway-based risk score model in melanoma. (A) PMPscore heatmap of candidate pathways. (B) Kaplan–Meier survival curves of OS comparing the high- and low-risk groups from the melanoma training cohort. (C) Comparison of the ORR between the high- and low-risk groups from the melanoma training cohort.
To test if the seven-candidate pathways could jointly predict the prognosis and response to ICIs treatment, a pathway-based risk score model was constructed for each patient using a formula derived from the PMPscore of the seven pathways weighted by their multivariable Cox proportional hazards regression coefficient (Table 1). The formula is as follows: Pathway-based risk score = |$-$|(0.040 |$\times$| Gap junction) |$-$| (0.121 |$\times$| JAK–STAT signaling pathway) |$-$| (0.119 |$\times$| EGFR tyrosine kinase inhibitor resistance) |$-$| (0.252 |$\times$| Fanconi anemia pathway) |$-$| (0.100 |$\times$| Cytokine-cytokine receptor interaction) |$-$| (0.035 |$\times$| HIF-1 signaling pathway) |$-$| (0.313 |$\times$| Taste transduction). The median value of pathway-based risk score (−0.924) was used to classify melanoma training cohort patients into high-risk and low-risk groups. The Kaplan–Meier survival curve showed that patients in the low-risk group had significantly longer OS than those in the high-risk group (median OS, 21.75 months versus 5.43 months; log-rank test P < 1.10e−4; Figure 2B). We then performed the ROC curve analysis to evaluate the predictive power, and the area under the ROC curve (AUC) for pathway-based risk score with OS was 0.771 (Supplementary Figure S1A, see Supplementary Data available online at https://dbpia.nl.go.kr/bib), indicating that the pathway-based risk score could predict the prognosis of patients with melanoma. Furthermore, a significantly higher ORR was observed in the low-risk patient group than that in the high-risk patient group (26.9 versus 5.7%; Chi-square test P = 7.10e−03; Figure 2C). Moreover, we found that the pathway-based risk score is an independent prognostic factor after adjusting for age, sex, TMB and M stage by the multivariable Cox regression analysis (hazard ratio = 0.31, 95% confidence interval [CI], 0.19–0.49, P < 0.01, Table 2). These results indicated that the pathway-based risk score could be used as a prognostic and predictive factor in the melanoma patient cohorts treated with ICIs.
Multivariable Cox regression analysis of candidate mutation pathways for OS in the melanoma training cohort
| Pathways | Coef | HR | 95% CI | P-value |
|---|---|---|---|---|
| HIF-1 signaling pathway | -0.035 | 0.965 | 0.770–1.211 | 0.761 |
| Gap junction | -0.040 | 0.961 | 0.753–1.225 | 0.746 |
| Cytokine–cytokine receptor interaction | -0.100 | 0.904 | 0.605–1.351 | 0.624 |
| EGFR tyrosine kinase inhibitor resistance | -0.119 | 0.889 | 0.806–0.979 | 0.017 |
| JAK–STAT signaling pathway | -0.121 | 0.887 | 0.709–1.108 | 0.290 |
| Fanconi anemia pathway | -0.252 | 0.777 | 0.466–1.295 | 0.333 |
| Taste transduction | -0.313 | 0.731 | 0.489–1.093 | 0.127 |
Univariable and multivariable Cox analysis of pathway-based risk score and clinicopathological factors (TMB, age, sex and stage) for OS in the melanoma cohorts
| Univariable analysis | Multivariable analysis | |||||
|---|---|---|---|---|---|---|
| HR | 95% CI | P-value | HR | 95% CI | P-value | |
| Training cohort | ||||||
| Risk score (low versus high) | 0.31 | 0.19–0.49 | <0.01 | 0.21 | 0.12–0.39 | <0.01 |
| TMB (high versus low) | 0.73 | 0.43–1.22 | 0.23 | 1.31 | 0.69–2.49 | 0.42 |
| Sex (male versus female) | 0.83 | 0.51–1.34 | 0.44 | 1.04 | 0.62–1.76 | 0.87 |
| Age (≥65 versus <65) | 1.15 | 0.74–1.79 | 0.53 | 1.33 | 0.82–2.15 | 0.24 |
| M_stage (M1 versus M0) | 4.53 | 1.42–14.40 | <0.01 | 6.10 | 1.89–19.72 | <0.01 |
| Miao cohort | ||||||
| Risk score (low versus high) | 0.62 | 0.39–1.00 | 0.05 | 0.56 | 0.33–0.95 | 0.03 |
| TMB (high versus low) | 1.15 | 0.63–2.10 | 0.66 | 1.34 | 0.67–2.68 | 0.40 |
| Sex (male versus female) | 0.85 | 0.51–1.42 | 0.54 | 0.84 | 0.48–1.47 | 0.53 |
| Age (≥65 versus <65) | 1.21 | 0.76–.93 | 0.42 | 1.31 | 0.78–2.21 | 0.30 |
| Snyder cohort | ||||||
| Risk score (low versus high) | 0.29 | 0.14–0.63 | <0.01 | 0.30 | 0.12–0.73 | <0.01 |
| TMB (high versus low) | 0.55 | 0.19–1.59 | 0.27 | 0.97 | 0.30–3.17 | 0.96 |
| Sex (male versus female) | 0.76 | 0.36–1.63 | 0.48 | 1.17 | 0.49–2.75 | 0.73 |
| Age (≥65 versus <65) | 0.57 | 0.25–1.27 | 0.17 | 0.67 | 0.29–1.55 | 0.34 |
| M_stage (M1 versus M0) | 1.27 | 0.17–9.39 | 0.81 | 0.70 | 0.08–6.03 | 0.75 |
Validation of the prognostic and predictive value of the pathway-based signature
To validate the prognostic value of the pathway-based risk score model, two independent melanoma patient cohorts (the Miao cohort and Snyder cohort) treated with CTLA-4 inhibitors were used. For the Miao cohort, 93 of 141 patients were defined as low risk with a good prognosis (median OS, 21.45 months versus 8.01 months; log-rank test P = 1.40e−03; Figure 3A), and the AUC for pathway-based risk score with OS was 0.654 (Supplementary Figure S1B,see Supplementary Data available online at https://dbpia.nl.go.kr/bib). Moreover, a remarkably higher ORR was displayed in the low-risk group than that of the high-risk patient group (30.1 versus 8.3%; Chi-square test P = 6.67e−03; Figure 3B). Similarly, in the Snyder cohort, patients with low pathway-based risk scores had a significantly longer OS than that of the patients with high pathway-based risk scores (median OS, 31.85 months versus 15 months; log-rank test P = 9.30e−04; Figure 3C), and the AUC for pathway-based risk score with OS was 0.766 (Supplementary Figure S1C, see Supplementary Data available online at https://dbpia.nl.go.kr/bib). Also, the low-risk patient group showed an obviously higher ORR than that of the high-risk group (30 versus 13.3%; Chi-square test P = 0.36; Figure 3D). The reason for the differential ORR did not reach statistical significance may be because of the smaller sample size. Moreover, the multivariable Cox regression analysis indicated that the pathway-based risk score was independent of the clinical characteristics (e.g., sex, age, TMB and clinical stage) in these validation cohorts (Table 2).
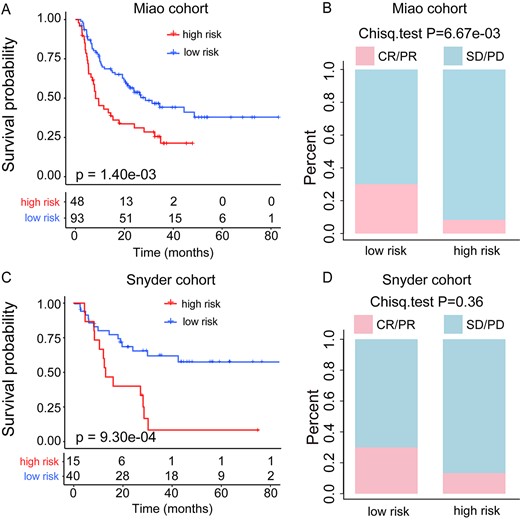
Validation of the predictive value of pathway-based risk score model. (A) Kaplan–Meier survival curves of OS comparing the high- and low-risk groups from the Miao cohort. (B) Comparison of the ORR between the high- and low-risk groups from the Miao cohort. (C) Kaplan–Meier survival curves of OS comparing the high-risk and low-risk groups from the Snyder cohort. (D) Comparison of the ORR between the high- and low-risk groups from the Snyder cohort.
To further explore whether the risk score could predict the immunotherapy efficacy of patients treated with other inhibitors, we also collected data from a third validation cohort from the Hugo et al. study [29], including 37 metastatic melanoma patients treated with PD-1 inhibitors. However, our results found that there was no significant difference between the low-risk and high-risk groups of patients in OS (median OS, 20.8 months versus 14.4 months, log-rank test P = 0.27, Supplementary Figure S1D, see Supplementary Data available online at https://dbpia.nl.go.kr/bib) and immunotherapy response (ORR, 60 versus 47.06%, Chi-square test P = 0.65, Supplementary Figure S1E, see Supplementary Data available online at https://dbpia.nl.go.kr/bib), and the AUC for pathway-based risk score with OS was 0.538 (Supplementary Figure S1F, see Supplementary Data available online at https://dbpia.nl.go.kr/bib), highlighting the necessity for constructing immunotherapy inhibitor-specific risk model.
Comparison of pathway-based signature with other signatures
Many studies have reported a connection between higher TMB and ICI efficacy, indicating that TMB could serve as a good predictive biomarker; thus, a TMB stratification analysis was performed. According to previous studies [2, 4, 10], the 20-percentile of TMB was used as a cutoff to classify patients into TMB-high and TMB-low groups in each cohort. To test if the pathway-based risk score model could provide an additional predicted effect than TMB, we applied it to the TMB-high group and the TMB-low group patients, respectively. In the melanoma training cohort, we found that the pathway-based risk score model successfully classified the TMB-high group patients into low-risk and high-risk groups in terms of OS (median OS, 22.53 months versus 4.57 months, log-rank P < 1.10e−04; Figure 4A), and the low-risk group patients showed higher ORR than that of high-risk groups (22.2 versus 0%, Chi-square test P = 0.91; Figure 4B). With our pathway model, the similar results were observed in TMB-low group patients in terms of OS (median OS, 19.72 months versus 6.13 months, log-rank P < 1.10e−04; Figure 4C) and ORR (29.4 versus 6%, Chi-square test P = 9.20e−03; Figure 4D). These results indicate that the pathway-based risk score can capture patients with survival benefits regardless of TMB levels. Similarly, in the Miao cohort and Synder cohort, the pathway-based risk score model classified the TMB-low group patients into high-risk group and low-risk group (Supplementary Figure S2A and B, see Supplementary Data available online at https://dbpia.nl.go.kr/bib), and the low-risk group patients also showed higher ORR (Supplementary Figure S2C and D, see Supplementary Data available online at https://dbpia.nl.go.kr/bib). Moreover, in these two cohorts, we found that our pathway-based risk score model classified all the patients into the low-risk group for the TMB-high patients (Supplementary Figure S2E and F, see Supplementary Data available online at https://dbpia.nl.go.kr/bib), which is in line with our expectations that the TMB-high patients have a better prognosis by immunotherapy. To further compare the predictive power of the pathway-based risk score model with TMB, the ROC curve analysis of OS status (alive and deceased) was performed in the three melanoma cohorts (one training cohort and two validation cohorts). The results of the ROC curve analysis showed that the AUC of the pathway-based risk score model is superior to TMB (AUC: training cohort, 0.771 versus 0.533; Miao cohort, 0.654 versus 0.538; Synder cohort, 0.766 versus 0.733; Supplementary Figure S1A–C, see Supplementary Data available online at https://dbpia.nl.go.kr/bib). These findings indicated that the pathway-based risk score had additional predictive benefits for response to ICIs in the subgroups of TMB stratification (TMB-high group and TMB-low group). And our pathway-based risk score model can also identify populations with different prognosis and immunotherapy responses, which were not captured by current TMB.
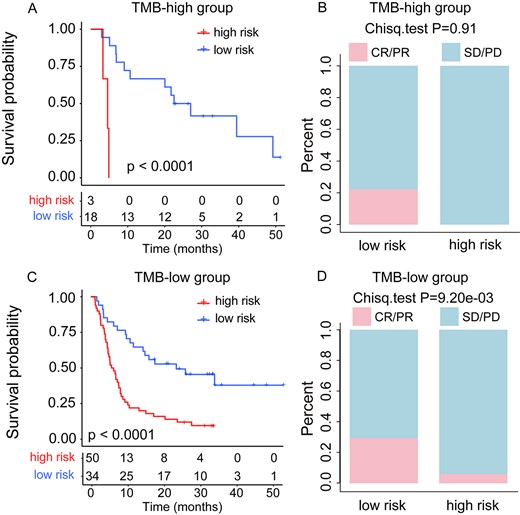
TMB stratification analysis in the melanoma training cohort. (A) Kaplan–Meier survival curves of OS comparing the high- and low-risk groups in TMB-high patients. (B) Comparison of the ORR between the high- and low-risk groups in TMB-high patients. (C) Kaplan–Meier survival curves of OS comparing the high- and low-risk groups in TMB-low patients. (D) Comparison of the ORR between the high- and low-risk groups in TMB-low patients.
To further verify the performance of the iPMP method, we compared our iPMP method with the Long et al. method [40], which developed an 11-gene mutation-based gene set to predict survival benefits after immunotherapy across multiple cancers. We applied the 11-gene mutation-based gene set model in our melanoma training cohort and two independent validation cohorts, the patients in each cohort were then divided into high-risk and low-risk groups, respectively. In the melanoma training cohort (Van Allen cohort), we found that there was no significant difference in patients’ overall survival and immunotherapy response between the two patient groups (median OS, 10.55 months versus 8.22 months, log-rank test P = 7.80e−2; ORR, 16.7 versus 15.4%, Chi-squared test P = 1; Supplementary Figure S3A and B, see Supplementary Data available online at https://dbpia.nl.go.kr/bib), while our iPMP method classified patients into two subgroups with distinctive overall survival (log-rank test P < 1.10e−04, Figure 2B) and objective response rate (Chi-square test P = 7.10e−3, Figure 2C). For the Miao and Synder validation cohorts, the 11-gene mutation-based gene set model identified that the low-risk group patients have a longer OS than the high-risk group patients, but the ORR did not show a significant difference between high-risk and low-risk groups (Supplementary Figure S3C–F, see Supplementary Data available online at https://dbpia.nl.go.kr/bib). However, our iPMP method exhibited good performance in both the two cohorts, and the differences in OS and ORR were obviously greater than Long et al. method (Miao cohort: OS, log-rank test P = 1.40e−03 versus log-rank test P = 0.04, ORR, Chi-square test P = 6.670e−3 versus Chi-Square test P = 0.94; Synder cohort: OS, log-rank test P = 9.30e−04 versus log-rank test P = 2.90e−2, ORR, Chi-square test P = 0.36 versus Chi-square test P = 0.22; Supplementary Figure S3C–F, see Supplementary Data available online at https://dbpia.nl.go.kr/bib). These findings indicated that our iPMP method exhibited better performance than the Long et al. method. This may be because the pathway-based signature may provide more information about the functional alterations in cancer.
Analysis of the pathways in the signature
To explore the mutational patterns of pathways in the pathway-based signature, we tested the mutation status of pathways and genes involved in the pathways. We found that the genes in the pathways tended to be mutated in the low-risk group (Figure 5 and Supplementary Figures S4–S8, see Supplementary Data available online at https://dbpia.nl.go.kr/bib). That is because higher mutations result in more neoantigens, increasing chances for T-cell recognition, thereby improving the efficacy of immunotherapy [2, 41, 42]. On the contrary, an opposite mutation pattern was observed in the gene NRAS (highly mutated in Gap junction and EGFR tyrosine kinase inhibitor resistance pathways), which tended to be mutated in the high-risk subgroup of patients with lower immunotherapy response rate (Figure 5). This may be due to patients with NRAS-mutant melanoma appearing to have a more aggressive disease course, resulting in an overall poorer prognosis [43–45]. And researcher suggested that binimetinib therapy could be used for patients with advanced NRAS-mutant melanoma after the failure of immunotherapy. That is to say, the high-risk group of patients identified by our pathway-based risk model may not be suitable for immunotherapy and could be appropriately treated with binimetinib, requiring more data and clinical trials to verify.
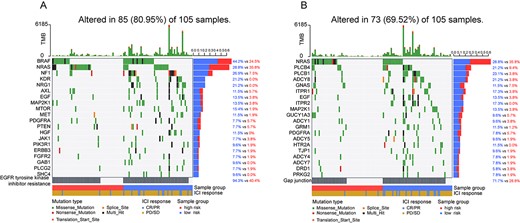
Mutation analysis of genes involved in the signature pathways. (A) Waterfall plot of the top 20 genes in terms of mutation rate involved in EGFR tyrosine kinase inhibitor resistance pathway. (B) Waterfall plot of the top 20 genes in terms of mutation rate involved in Gap junction pathway.
To further explore the position of the mutated genes in the pathway, we took the JAK–STAT signaling pathway as an example. The mutated genes were mapped to the JAK–STAT signaling pathway map in KEEG (Figure 6). The pathway map showed that the mutant genes, such as EGF, IFNA10, IL12B and IL23A, were located at the beginning of the signaling pathway, and their mutation rates were higher than the downstream genes. Additionally, we found that transmembrane receptor-related genes in the JAK–STAT signaling pathway (such as LIFR, OSMR, GHR, IL2RB) were also commonly mutated. Indeed, in the classical signaling pathway, the receptors on the cell membrane are like signal receivers, receiving exogenous signals and then downstream cascade reactions occur, thus affecting the function of the pathway to a large extent. If these receptors are not present, the entire pathway is shut off. Similar results were identified in the other candidate pathways (Supplementary Figures S9–S11, see Supplementary Data available online at https://dbpia.nl.go.kr/bib). These findings confirmed that considering the position of mutated genes in the pathway to identify the perturbation pathways associated with prognosis and drug response is important and necessary.
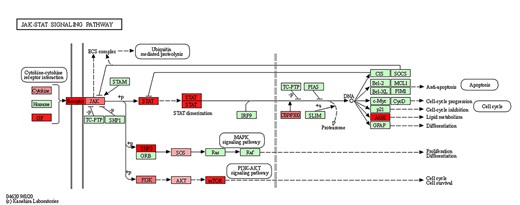
JAK–STAT signaling pathway map marked with mutation genes. Red nodes indicate that the genes are mutated, and the higher the mutation frequency, the darker the color.
To test whether the pathway-based risk model could be used in the nonimmunotherapy cohort, we collected 451 skin cutaneous melanoma (SKCM) samples from the The Cancer Genome Atlas (TCGA) database. With the pathway-based signature, the TCGA-SKCM patients were classified into the low-risk and high-risk groups. The Kaplan–Meier survival analysis demonstrated that patients with low pathway-based risk scores had a longer OS than those with high pathway-based risk scores (median OS, 45.32 months versus 28.23 months, log-rank test P = 0.018, Supplementary Figure S12, see Supplementary Data available online at https://dbpia.nl.go.kr/bib). Moreover, we performed the function enrichment analysis between high-risk and low-risk groups with gene set enrichment analysis (GSEA). The results of GSEA indicated that the low-risk group of patients was significantly enriched in tumorigenesis-related pathways, such as DDR pathways, cell cycle, and antigen processing and presentation pathway, while patients in the high-risk group were significantly enriched in the Wnt signaling pathway and mitogen-activated protein kinase (MAPK) signaling pathway (false discovery rate (FDR) < 0.01, Supplementary Figure S13 and Supplementary Table S2, see Supplementary Data available online at https://dbpia.nl.go.kr/bib). These findings indicated that the pathway-based risk score is also a prognostic factor and can capture tumorigenesis-related functions, partially explaining the association of pathway-based risk score with immunotherapy efficacy.
Identification of pathway-based signature in NSCLC
To test if the iPMP method could be applied to other cancer types to identify the pathway-based risk signature, we applied it to the NSCLC cohort treated with PD-1 plus CTLA-4 blockade obtained from the Hellmann et al. study (n = 68). A pathway-based risk model was constructed in the NSCLC cohort, and the pathways in the model were listed in Supplementary Table S3, see Supplementary Data available online at https://dbpia.nl.go.kr/bib). According to the median value of pathway-based risk score, patients were then stratified into the high-risk and low-risk groups. Kaplan–Meier survival analysis demonstrated that a low pathway-based risk score significantly correlated with improving PFS (median PFS, 13.54 months versus 3.78 months, log-rank P = 6.50e−04; Figure 7A), and the AUC for pathway-based risk score with PFS was 0.849 (Figure 7C). Additionally, a significantly higher ORR was displayed in the low-risk group (48.50 versus 22.90%, Chi-square test P = 2.71e−02; Figure 7B). The univariable and multivariable analysis of clinicopathological factors for PFS indicated that the pathway-based risk score was an independent predictive factor in the NSCLC cohort (Supplementary Table S4, see Supplementary Data available online at https://dbpia.nl.go.kr/bib).
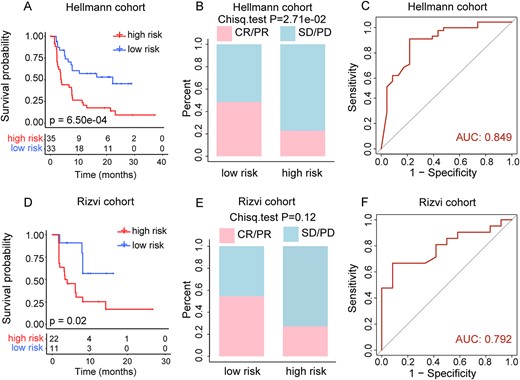
Prediction of clinical outcomes with the pathway-based risk score model in NSCLC. (A) Kaplan–Meier survival curves of OS comparing the high- and low-risk groups from NSCLC training cohort. (B) Comparison of the ORR between the high- and low-risk groups from NSCLC training cohort. (C) ROC curves for prediction of OS by pathway-based risk score in NSCLC training cohort. (D) Kaplan–Meier survival curves of OS comparing the high- and low-risk groups from Rizvi cohort. (E) Comparison of the ORR between the high- and low-risk groups from Rizvi cohort. (F) ROC curves for prediction of OS by pathway-based risk score in Rizvi cohort.
To validate our findings, we further analyzed 33 NSCLC patients treated with PD-1 blockade from the Rizvi et al. study [3]. The results showed that patients with low pathway-based risk scores had significantly higher PFS (median PFS, 8.30 months versus 3.80 months, log-rank P = 0.02; Figure 7D) and ORR (54.50 versus 27.30%, Chi-squared test P = 0.12; Figure 7E) than patients with high pathway-based risk scores, and the AUC for pathway-based risk score with PFS was 0.792 (Figure 7F). And the multivariable Cox regression analysis indicated that the pathway-based risk score remained an independent predictive factor for PFS after adjustment by clinicopathological variables in the validation cohort (Supplementary Table S4, see Supplementary Data available online at https://dbpia.nl.go.kr/bib).
To further compare the predictive power of the pathway-based risk score model with TMB, the ROC curve analyses of OS status were also performed in lung cancer training and validation cohorts. The results of the ROC curve analysis showed that the AUC of the pathway-based signature is superior to TMB in the lung cancer training cohort (AUC, 0.849 versus 0.651; Supplementary Figure S14A, see Supplementary Data available online at https://dbpia.nl.go.kr/bib), and is comparable to TMB in the Rizvi validation cohort (AUC, 0.792 versus 0.810; Supplementary Figure S14B, see Supplementary Data available online at https://dbpia.nl.go.kr/bib). Moreover, compared with TMB, our method only need to detect the mutation status of the genes in the pathway-based signature, which increases cost-effectiveness by offering a smaller panel of genes, and which can be easily translated into an easy-to-use clinical assay. These findings highlighted that the PMPscore model could be used to identify the effective pathway-based signature for predicting survival benefits after immunotherapy.
Discussion
Biological pathways could help to provide insight into the disease states, tumor marker, drug response and altered cellular function [46–50]. The accumulation of a characteristic set of mutations in specific tumor suppressor genes and oncogenes will activate pathways critical for cancer initiation and progression [17]. And previous studies demonstrate that even when patients harbor mutations in different genes, these genes often participate in a common pathway [18–20]. Therefore, capturing the pathways, which are activated by accumulated genetic mutations, may provide new insights into the prediction of immunotherapy and the development of novel agents.
In this study, we developed a novel iPMP method, which considers not only the positions of mutated genes in the pathway but also their cumulative effect on the pathway. In iPMP, we first mapped the mutations to genes in the pathways on a single patient sample, and iteratively calculated the GMPscores of genes in each pathway from the initial nodes to the end nodes in the pathway graphs. Then, a PMPscore model was defined as the total GMPscores of genes involved in the pathways. Thus, iPMP produces a matrix of integrated PMPscores, where the rows represent pathways and the columns represent patients, which can be used to identify the perturbation pathways associated with clinical outcomes.
Higher PMPscore values indicate that the pathway may result in more neoantigens, which increase chances for T-cell recognition, thereby improving the efficacy of immunotherapy. Based on the PMPscore of pathways, we constructed a pathway-based risk score model to predict survival benefits after immunotherapy. With the pathway-based risk score model, patients in the melanoma cohort were classified into two groups with significantly distinctive prognoses (Figure 2B) and immunotherapy responses (Figure 2C). Moreover, our pathway-based risk model had a superior predictive value of immunotherapy efficacy to that of TMB. And the prognostic and predictive value of the pathway-based risk score model was consistently validated in the two independent melanoma immunotherapy cohorts. Additionally, the univariable and multivariable Cox analysis of the pathway-based risk score and clinicopathological factors (age, sex, TMB and stage) for OS indicated that the pathway-based risk score was an independent prognostic factor in the melanoma training and validation cohorts (Table 2). To facilitate the use of the iPMP method, we implemented it as a freely available R-based package (https://CRAN.R-project.org/package=PMAPscore).
In our study, we have established two pathway-based risk score models for melanoma and lung cancer, respectively. We found that only the JAK–STAT signaling pathway appears in both the melanoma and lung cancer models, and the rest of the pathways are different. This may be because the JAK–STAT signaling pathway is a pan-cancer driver mutation pathway, and the rest of the pathways are more cancer-specific. The result suggested that the response mechanisms to immunotherapy may vary for different cancers. To validate these findings, we have added analysis to explore whether the melanoma model could be used in lung cancer cohorts. To do this, the pathway-based risk model of melanoma was applied to predict immunotherapy efficacy for NSCLC patients from Hellmann et al. and Rizvi et al. studies. The results showed that the melanoma risk model did not obtain good results in NSCLC patients (Hellmann cohort: PFS, log-rank P = 0.06; ORR, Chi-square test P = 0.23; Rizvi cohort: PFS, log-rank P = 0.74; ORR, Chi-square test P = 0.40; Supplementary Figure S15A–D, see Supplementary Data available online at https://dbpia.nl.go.kr/bib), indicating that the melanoma model could not predict clinical results of immunotherapy in NSCLC patients. Therefore, the cancer-specific models are necessary for clinical application.
The advantage of our approach is that we innovatively defined a PMPscore to reflect the positions of mutated genes and their cumulative effects on the pathway for the first time. The PMPscore matrix can then be used in place of the original mutation dataset to identify the associations of pathways with clinical outcomes. Additionally, our approach increases cost-effectiveness by offering a smaller panel of genes in the pathway-based signature that can be easily translated into an easy-to-use clinical assay. And we anticipated that our approach will greatly improve clinical decision-making in immunotherapy.
We developed a novel iPMP method to infer the mutation perturbation extent of biological pathways by integrating the somatic mutation data and pathway structure information.
In iPMP, somatic mutations on a single patient sample were mapped to genes in a single pathway to infer the PMPscore by capturing the importance of the position of the mutated genes in the pathway as well as the evidence of accumulation of mutated genes.
The method produces a matrix of integrated PMPscores, where the rows represent pathways and the columns represent patients. The PMPscore matrix can be used in place of the original mutation datasets to identify associations with clinical outcomes.
Funding
National Natural Science Foundation of China (grant no. 62072145); Natural Science Foundation of Heilongjiang Province (grant no. LH2019C042).
Author Biographies
Xiangmei Li is a doctor at the College of Bioinformatics Science and Technology, Harbin Medical University. Her research interest focuses on bioinformatics.
Yalan He is a master at the College of Bioinformatics Science and Technology, Harbin Medical University. Her research interest focuses on bioinformatics.
Jiashuo Wu is a master at the College of Bioinformatics Science and Technology, Harbin Medical University. His research interest focuses on computational system biology.
Jiayue Qiu is a master at the College of Bioinformatics Science and Technology, Harbin Medical University. Her research interest focuses on computational system biology.
Ji Li is a master at the College of Bioinformatics Science and Technology, Harbin Medical University. His research interest focuses on bioinformatics.
Qian Wang is a master at the College of Bioinformatics Science and Technology, Harbin Medical University. Her research interest focuses on bioinformatics.
Ying Jiang is an associate professor at the College of Basic Medical Science, Heilongjiang University of Chinese Medicine. Her research interests focus on the molecular biology and cell biology of cancer.
Junwei Han is a professor and a principal investigator at the College of Bioinformatics Science and Technology, Harbin Medical University. His research interests focus on bioinformatics and computational system biology.
References
Author notes
Xiangmei Li, Yalan He and Jiashuo Wu contributed equally to this work.
