


Abstract
Statistical and machine learning techniques based on relative abundances have been used to predict health conditions and to identify microbial biomarkers. However, high dimensionality, sparsity and the compositional nature of microbiome data represent statistical challenges. On the other hand, the taxon grouping allows summarizing microbiome abundance with a coarser resolution in a lower dimension, but it presents new challenges when correlating taxa with a disease. In this work, we present a novel approach that groups Operational Taxonomical Units (OTUs) based only on relative abundances as an alternative to taxon grouping. The proposed procedure acknowledges the compositional data making use of principal balances. The identified groups are called Principal Microbial Groups (PMGs). The procedure reduces the need for user-defined aggregation of |$\textrm{OTU}$|s and offers the possibility of working with coarse group of |$\textrm{OTU}$|s, which are not present in a phylogenetic tree. PMGs can be used for two different goals: (1) as a dimensionality reduction method for compositional data, (2) as an aggregation procedure that provides an alternative to taxon grouping for construction of microbial balances afterward used for disease prediction. We illustrate the procedure with a cirrhosis study data. PMGs provide a coherent data analysis for the search of biomarkers in human microbiota. The source code and demo data for PMGs are available at: https://github.com/asliboyraz/PMGs.
1 Introduction
High-throughput sequencing has led to an explosive growth of studies on the associations between human microbiome and human disease. Many chronic diseases, including obesity, type 2 diabetes, liver diseases, cancer and allergies have linked alteration in the human gut microbiome [1–7]. Microbiome profiles are typically high dimensional and very sparse, leading to two main problems in data analysis. The main approach to deal with these problems is to annotate constructed microbial features with taxonomy. The majority of microbiome studies (96.9%) used the Operational Taxonomical Unit (OTU) approach to cluster reads and assign taxonomy to the clusters [2]. Agglomerating taxa by rank of interest (phylum, genus, etc.) allows summarizing microbiome abundance with a coarser resolution in lower dimension. Genus was the most frequently used level (75.7%), followed by phylum (55.3%), and only 16.0% of the studies focused on species level [2]. The similarities or relationships between samples are addressed correspondingly. The higher the taxon-level bacteria are collapsed into, the lower dimensionality and sparsity one can achieve [8]. However, bacterial strains in the same taxonomic group have been found to vary in their relationships with the host bioclinical parameters, suggesting that each of them may have a distinct impact on host health [8]. Thus, correlating selected taxa with disease can often lead to controversial results in biomarker studies. If members in a taxon have opposite associations with the same disease, lumping them into one taxon variable will produce degradation of the possible associations with the disease.
Researchers are interested in identifying a single taxonomic unit that may serve as a biomarker of diseases using classical statistical and machine learning techniques [2, 6, 9]. However, considering the preventive or risk effects of each bacteria separately does not adequately account for the variation in the human microbiome and it is rare for a single bacterial species to be associated with a disease [10, 11]. Indeed, it is suggested that dysbiosis (imbalance in microbial communities) [12, 13] is likely to contribute to diseases [14–16]. Thus, detection of bacterial species that are out of balance has become important in developing promising diagnostics.
Recent awareness of the compositional nature of microbiome data has led to employ the compositional approach in microbiome studies [17–28]. Relative abundances are compositional and the relative data contain the relationships between the features of the dataset [17, 18]. If the relative abundance of one microbial feature increases, the relative abundances of some other microbial features must decrease, and vice versa. Pearson correlations of relative abundances are spurious and cannot be relied upon to make coherent inferences about the relationships between pairs of features [29–31]. There is an increasing number of publications motivating and using the log-ratio methodology for statistical processing of microbiome [19, 22, 32–37]. Log-ratio methodology brings a new perspective to the biomarker concept since it deals with ratios of microbial features. So, focusing on a single species is not suitable for log-ratio methodology. Then, the ratio of microbial features can be interpreted as positively or negatively correlated with the disease. However, the most of the current biomarker discovery methodologies do not consider the compositional nature of the microbiome data [38], as they assume implicitly the sample space to be the real space endowed with the usual Euclidean geometry. On the contrary, the compositional approach, which assumes the sample space to be the simplex endowed with the Aitchison geometry [39], could reveal relevant microbiome markers among microbiome samples or groups of samples (e.g. sick versus healthy) [40, 41]. Some recent biomarker discovery methodologies that consider the compositional nature of the data usually work with agglomerated taxa by the rank of interests (phylum, genus, etc.) that might lead spurious results in biomarker studies [8].
1.1 Compositional data (CODA) approach for microbiome data analysis
The main idea of CODA is to represent the original microbiome data in coordinates [39, 42] of the simplex corresponding to the Aitchison geometry. These coordinates are, by construction, real, and their support space is the real space endowed with the usual Euclidean geometry. These new variables are formed by interpretable log-ratios or their linear aggregates (log-contrasts), and then one can continue with standard statistical or machine learning processing [43, 44].
The components of a composition are called parts. Linear functions of a composition onto the real numbers are scale-invariant additive combinations of the logarithms of parts, called log-contrasts. Log-contrasts are characterized by the fact that the weighting coefficients sum up to zero. Log-contrasts are obvious candidates for describing the characteristics of a composition and are then used as statistics from a sample. Examples of such log-contrasts are compositional principal coordinates [43] and balances, the latter understood as log-ratios of geometric means of groups of parts [45, 46]. The interpretability of log-contrasts depends on the characteristics of the combination of logs. Compositional principal components generally involve all parts of the composition in a non-homogeneous way, thus making its interpretation difficult. That is, they are neither simple nor sparse. Balances are a simple class of log-contrasts, as the combination coefficients have only two values different from zero (simplicity), and when the involved groups of parts are small, balances are also sparse [47]. Additionally, orthonormal cartesian coordinates are sets of log-contrasts called isometric log-ratio (ilr/olr) coordinates [42, 48]. Compositional principal components are ilr-coordinates. Alternatively, ilr coordinates can be obtained by a sequential binary partitions (SBP) of the composition [45]. The SBP procedure produces orthonormal coordinates, which are balances. A positive balance means that the group of parts in the numerator has (in geometric mean) more weight in the sample than the group in the denominator (and vice versa for negative balances). Note that amalgamations of parts do, in general, not lead to log-contrasts, unless the composition is extended by a new component or components made up of amalgamated parts.
Several microbiome studies have chosen |$\mathrm{ilr}$| coordinates using an ad hoc SBP [11, 49]. Interpreting the results of general, blind partitions might not be trivial. In order to choose meaningful parts for balances, an expert opinion is necessary [46], but this is not practical for high-dimensional data.
Recently, some effort has been made to choose balances for classification or prediction purposes, defining the significant balances as those that are associated with the outcome of interest [19, 35, 50, 51]. Rivera-Pinto et. al. [19] introduced the ‘selbal’ algorithm, which identifies the smallest number of microbial features with the highest prediction or classification accuracy of a given response variable. Quinn and Erb [35] introduced ‘discriminative balance analysis’ (DBA-distal), which offers a computationally efficient way to select important 2 and 3-part balances. Distal balance-based disease prediction and biomarker discovery platforms have also been introduced: GutBalance [33] and DisBalance [32]. The most recent balance-based feature selection approach is ‘codacore’ [51] and it finds the sparse subset of balances that are maximally associated with the response variable. ‘Philr’ [34] is a different method from the above-mentioned balance selection methods with respect to SBP construction. It does not use data labels for SBP construction, but the phylogenetic tree.
Rather than building balances with geometric means of parts, amalgamation is proposed as an alternative to balances [52, 53], but amalgams need special care as their meaning changes under perturbation, for instance, when centering data. In fact, amalgamation is a nonlinear operation in the simplex endowed with the Aitchison geometry. Moreover, the amalgamation ignores the existence of two different parts in the group. Ratios of involving parts are lost after amalgamation [46]. This is not desirable for biomarker studies, because the association role of microbial features in the groups with disease status is separately important.
We propose a procedure that groups microbial features attending the compositional character of the data making use of the highest possible resolution of microbial features (|$\textrm{OTU}$|s). This mathematically consistent aggregation procedure collapses microbial features into units as an alternative to taxon grouping, here called Principal Microbial Groups (|$\textrm{PMG}$|s), providing a coherent data analysis for the search of biomarkers in human microbiota.
2 Materials and methods
3 Overview of PMGs
|$\textrm{PMG}$|s procedure creates nonoverlapping |$\textrm{OTU}$| groups without using taxonomy. The grouping is based only on relative abundances. Thus, microbial features in the same group might have different taxonomy. |$\textrm{PMG}$|s offer the possibility of working with coarse groups of |$\textrm{OTU}$|s, groups that are not present in a phylogenetic tree. |$\textrm{PMG}$|s can be used for facilitating the use of high-resolution microbial data in the search of biomarkers.
While grouping, the procedure assigns each |$\textrm{OTU}$| to a group (|$\textrm{PMG}$|) such that |$\textrm{OTU}$|s in the group are highly linearly associated in the Aitchison geometry [54]. Grouping of |$\textrm{OTU}$|s in |$\textrm{PMG}$|s is an unsupervised R-mode cluster analysis and acknowledges coda methodology. The selection of nonoverlapping groups of |$\textrm{OTU}$|s is obtained through hierarchical clustering as used to approach principal balances (PBs) [55]. The association between |$\textrm{OTU}$|s is determined using the variation matrix that has been proven to be proportional to the square Aitchison distance between parts [47, 54]. These associated |$\textrm{OTU}$|s form a |$\textrm{PMG}$| and each |$\textrm{PMG}$| is represented by the geometric mean of the relative abundances of |$\textrm{OTU}$|s, thus reducing dimension of the dataset for further analysis. Note that only the grouped |$\textrm{OTU}$|s play a role in each |$\textrm{PMG}$| dimension. Thus, it contributes to the better understanding of dimension reduction procedure.
The overview of the |$\textrm{PMG}$| procedure is illustrated in Figure 1. The proposed procedure consists of three steps: (i) select an appropriate SBP for grouping, (ii) choose the optimal number of |$\textrm{PMG}$|s and (iii) select compositional biomarkers.
![A general workflow overview. (A) PMG construction procedure starts with a compositional $\textrm{OTU}$ table and ends with a $\textrm{PMG}$ table. In the CODA dendrogram, SBP for PBs is visualized. Choosing $n$ PBs results in $n+1 \textrm{PMG}$s. (B) PBs are utilized to choose the optimal number of $\textrm{PMG}$s. The min and max number of PBs to include in the $\textrm{PMG}$ construction process is determined. $\textrm{PMG}$ tables are constructed for each number in between [min+1, max+1]. Then, $\textrm{PMG}$ balances ($\textrm{ilr}$ transformed $\textrm{PMG}$s) are obtained for each $\textrm{PMG}$ table. Logistic regression classifier runs on all $\textrm{PMG}$ balance tables. k $\textrm{PMG}$ balances return the highest AUC value. Thus, the optimal number for PMGs is k+1. (C) Dataset projected on $\textrm{PMG}$s; the $\textrm{PMG}$ table is calculated so that each group is represented by the geometric mean of the relative microbial abundances in the group ( $y_{ij} = \mathrm{geomean}(Si_{\text{otu}_1},\dots ,Si_{\text{otu}_t})$ is the corresponding $\text{PMG}_j$ value for sample $i$ where $t$ is the total number of otus in $\textrm{PMG}_j$). Discriminative $\textrm{PMG}$ balances are chosen by selbal, codacore and DBA-distal and compositional biomarkers are obtained. The box plots show the distribution of selbal selected $\textrm{PMG}$ balance (G26/G14) scores and codacore selected $\textrm{PMG}$ balance (G3,G26/G23) scores for cirrhosis and non-cirrhosis individuals. The $\textrm{PMG}$s that form the balances are specified at the top of the box plots.](https://oup.silverchair-cdn.com/oup/backfile/Content_public/Journal/bib/23/5/10.1093_bib_bbac328/1/m_bbac328f1.jpeg?Expires=1749310327&Signature=eMM8C0kT0oJfPWknvsJDookoPAKbfj8zwVBIj~Bimo1LA7D694Y6blRHjVNLfIFherf57oaCuBCIqHuFY63PlicBm4d2MzSEoRUbYcwy5B8te-SmHsQoWr9jdStVlces7nZlPrOAnb6sTJzbHHD2r1fV2Gi-2A6upOmvSenW7NdQfI0h259LSkkVppNx7yIT92yscqyQTji67fcC2GkP1DR5ebXdDahg2qNa1lxe2sA2P0FW3O78Nnqt~cKKD4yeGNu8cAoEXnesg~tIU~HNDTFcrZ1dfdHbEBvIWahKJoyopZn-1ErrLhV8~B0DL413cHL0J1my5sB6i-szsHxSZQ__&Key-Pair-Id=APKAIE5G5CRDK6RD3PGA)
A general workflow overview. (A) PMG construction procedure starts with a compositional |$\textrm{OTU}$| table and ends with a |$\textrm{PMG}$| table. In the CODA dendrogram, SBP for PBs is visualized. Choosing |$n$| PBs results in |$n+1 \textrm{PMG}$|s. (B) PBs are utilized to choose the optimal number of |$\textrm{PMG}$|s. The min and max number of PBs to include in the |$\textrm{PMG}$| construction process is determined. |$\textrm{PMG}$| tables are constructed for each number in between [min+1, max+1]. Then, |$\textrm{PMG}$| balances (|$\textrm{ilr}$| transformed |$\textrm{PMG}$|s) are obtained for each |$\textrm{PMG}$| table. Logistic regression classifier runs on all |$\textrm{PMG}$| balance tables. k |$\textrm{PMG}$| balances return the highest AUC value. Thus, the optimal number for PMGs is k+1. (C) Dataset projected on |$\textrm{PMG}$|s; the |$\textrm{PMG}$| table is calculated so that each group is represented by the geometric mean of the relative microbial abundances in the group ( |$y_{ij} = \mathrm{geomean}(Si_{\text{otu}_1},\dots ,Si_{\text{otu}_t})$| is the corresponding |$\text{PMG}_j$| value for sample |$i$| where |$t$| is the total number of otus in |$\textrm{PMG}_j$|). Discriminative |$\textrm{PMG}$| balances are chosen by selbal, codacore and DBA-distal and compositional biomarkers are obtained. The box plots show the distribution of selbal selected |$\textrm{PMG}$| balance (G26/G14) scores and codacore selected |$\textrm{PMG}$| balance (G3,G26/G23) scores for cirrhosis and non-cirrhosis individuals. The |$\textrm{PMG}$|s that form the balances are specified at the top of the box plots.
3.1 (i) Select an appropriate SBP
Let |$\textbf{x} = (\text{otu}_1,\text{otu}_2,\text{otu}_3,... \text{otu}_D)$| be a |$D$|-part compositional observation, possibly normalized to |$\sum _{k=1}^{D} \text{otu}_k= 1$|. The dataset is then arranged in an |$(n,D)$| data matrix |$\textbf{X}$|. A hierarchical cluster analysis of the columns of |$\textbf{X}$| (OTUs) is carried out using Ward’s method. The variation matrix can be used to define association between |$\textrm{OTU}$|s. Variation of parts can also be expressed in terms of the Aitchison distance between parts, because the square root of the variation matrix is actually proportional to the Aitchison distance between parts [47, 54]. The entries of the variation matrix are |$\mathrm{var}(\log (\text{otu}_i/\text{otu}_j))$| and they are all positive. The variance of the log-ratio of two |$\textrm{OTU}$|s is |$0$| if they are equal or if they are perfectly proportional [29], i.e. if |$\textrm{otu}_i$| and |$\textrm{otu}_j$| are exactly linearly associated [54]. A small variance indicates approximate linear association. The larger the variance is, the more unreliable the proportionality of the two |$\textrm{OTU}$|s is, and they likely belong to different groups. Thus, the variation matrix is a natural choice of a distance for merging |$\textrm{OTU}$|s.
Each branching of the hierarchical clustering tree is a binary partition that divides the |$\textrm{OTU}$|s under the branch into two groups. The procedure is iterated until all groups contain only one single |$\textrm{OTU}$|. The number of binary divisions of a group comprising |$D \ \textrm{OTU}$|s to attain the end of the process is |$D-1$|. This procedure defines a SBP.
3.2 (ii) Choose the optimal number of |$\textrm{PMG}$|s
Choosing the number of |$\textrm{PMG}$|s is critical for the future analysis because the interpretability of constructed balances depends on it. The aim is to get as many groups as possible with a manageable number of |$\textrm{OTU}$|s in it to make use of |$\textrm{PMG}$| balances in the search of biomarkers. Those groups also should explain the most of the total variance in the dataset. The explained variance of PBs can be used to choose the optimal number of groups. PBs that explain the higher variance than the mean of total variances are chosen to construct |$\textrm{PMG}$|s. The minimum number of |$\textrm{PMG}$|s is decided by the user. Assume that the SBP process is stopped when the number of groups is |$z$|. Denote these groups |$\textrm{PMG}_j$|, |$j=1,2,\dots ,z$|, so that all |$\textrm{otu}_i$| are in one, and only one, |$\textrm{PMG}$|. The value assigned to each |$\textrm{PMG}_j$| is the geometric mean of the |$\textrm{OTU}$|s included. Alternative possibilities are discussed in supplementary data.
The new composition y can be represented by some arbitrary set of |$z-1 \ \text{ilr}$| coordinates denoted |$y_k^*$|, |$k=1,2,\dots ,z-1$|. That is, for each number of groups |$z$|, an |$(n,(z-1))$| matrix of |$\textrm{ilr}$| coordinates (|$\textrm{PMG}$| Balances) is obtained, and they are used in a logistic regression to predict the presence/absence of the disease. Once the minimum (|$a$|) and maximum (|$b$|) number of |$\textrm{PMG}$|s are chosen, the best accuracy measure [e.g. area under the receiving operating characteristic (ROC) curve (AUC)] of these logistic regressions for |$z=a,a+1,\dots ,b$| corresponds to the optimal number of |$\textrm{PMG}$|s-1.
3.3 (iii) Select compositional biomarkers
Selbal [19], codacore [51] and DBA-distal [35] are balance selection methods to find balances associated with response. The input data for those methods can be at any level of the microbial features, i.e. phylum, genus, species or |$\textrm{OTU}$|s. Genus-level aggregation of microbiome data is the commonly used procedure before starting any analysis, thus obtained balances are basically a ratio of genera. Alternatively, |$\textrm{PMG}$|s could provide a set of |$\textrm{OTU}$|s whose aggregated ratios are discriminative. The |$\textrm{PMG}$| balances are called ‘compositional biomarkers’. Compositional biomarkers are in line with the recent understanding that diseases are generally associated with a balance of discrete groups of microbial species, as opposed to individual microbes [10, 12, 14, 35].
4 Dataset and preprocessing
To illustrate the proposed procedure and to reveal the biological meaning of |$\textrm{PMG}$|s, we choose a cirrhosis dataset [56] because the disease state is considered to be highly predictable by machine learning methodologies [57]. The dataset is available in the Knights Lab GitHub repository https://github.com/knights-lab/MLRepo [58]. There are 130 cirrhosis and non-cirrhosis samples with 2145 features (OTUs). We filtered features that had ¡20 counts in at least 30% of samples, resulting in 130 samples and 385 features. Cirrhosis samples (n = 68) and non-cirrhosis samples (n = 62) were used for further analysis.
In a microbiome dataset, each observed sample is a composition of microbial features (|$\textrm{OTU}$|s). Zero values in the compositional dataset must be handled prior to any analysis, as CODA methods rely on logarithms. The percentage of zeros in cirrhosis dataset is 6.8%. Supplementary Figure 4 shows the zero pattern for each sample. The geometric Bayesian multiplicative method, implemented in the cmultRepl function from the zCompositions package in R, is used for zero replacement [59]. As a result, a closed dataset with no zeros was obtained. Before |$\textrm{PMG}$| construction, the optimal number of group has to be determined. As explained in the section ‘Choose the optimal number of |$\textrm{PMG}$|s’, 25 was chosen as the minimum and the optimal number was determined as 27. Eventually, cirrhosis dataset was represented with 27 |$\textrm{PMG}$|s.
5 Benchmark evaluation
We evaluated |$\textrm{PMG}$|s with respect to two aspects: (1) |$\textrm{PMG}$| balances as a dimensionality reduction method for CODA; (2) |$\textrm{PMG}$| as a feature aggregation procedure that provides an alternative to taxon grouping for construction of microbial balances afterward used for disease prediction.
First, we bench-marked |$\textrm{PMG}$| balances (|$\mathrm{ilr}$| transformed |$\textrm{PMG}$|s) against competing dimension reduction methods designed for CODA. This includes (i) PCA, (ii) PBs [55] and (iii) distal balances (DBA-distal) [35]. The |$\textrm{OTU}$| tables and genus-level tables (|$\textrm{OTU}$| tables agglomerated into genus level) were dimensionally reduced by each of the three methods and reduced datasets were fed to logistic regression (LogReg). Note that |$\textrm{PMG}$|s are constructed only on the |$\textrm{OTU}$| table, thus |$\textrm{PMG}$| balances were not calculated on the genus-level table. For fair comparison between methods, the dataset was reduced to the same number of dimensions. The classification performance of the model was assessed by AUC with 10-fold cross-validation. Classification was performed in R using the caret package [60]. More detailed information about benchmarking methods and how to implement them in R are available in supplementary data.
Secondly, whether grouping |$\textrm{OTU}$|s as |$\textrm{PMG}$|s as an alternative to taxon grouping adds value in terms of creating better balances for classification was assessed. The classification performance of balance selection methods (selbal, codacore and DBA-distal) and selected balances on |$\textrm{OTU}$| table, genus-level table and |$\textrm{PMG}$| table were examined.
6 Results
The cirrhosis dataset was preprocessed and a total of 27 |$\textrm{PMG}$|s (G1,..., G27) were identified, as explained in the Material and methods section. We show that |$\textrm{PMG}$| construction is an alternative technique to taxon grouping that enables working with coarse groups of |$\textrm{OTU}$|s. |$\textrm{PMG}$|s have some interpretation advantages in reducing dimensionality and provide balances of microbial groups that can be used for disease prediction.
7 |$\textrm{PMG}$| balances as dimensionality reduction method
|$\textrm{PMG}$| balances were used as a dimensionality reduction method on |$\textrm{OTU}$| table for cirrhosis dataset. PMG table with 27 groups was |$\textrm{ilr}$|-transformed and 26 PMG balances were obtained. Thus, the cirrhosis dataset was reduced to optimal dimension (26) by using different dimension reduction procedures. We benchmarked 26 |$\textrm{PMG}$| balances against competing dimensionality reduction methods designed for CODA: PCA, PBA, DBA-distal. LogReg was used for disease prediction. Reduced datasets were constructed on |$\textrm{OTU}$| table and on genus-level table separately to compare with |$\textrm{PMG}$| balances. Note that |$\textrm{PMG}$| balances were not calculated on the genus-level table, they are constructed only on the |$\textrm{OTU}$| table for Figure 2. Because, |$\textrm{PMG}$|s are designed for grouping |$\textrm{OTU}$|s as an alternative to taxon aggregation. The classification performance of the reduced tables (26 dimensions) was reported (Supplementary Table 1 and Figure 2A). Figure 2B and C show the LogReg classification performances change with the dimension on the reduced datasets obtained by different methods. |$\textrm{PMG}$| balances exhibited performance rivaling common dimension reduction methods for CODA.
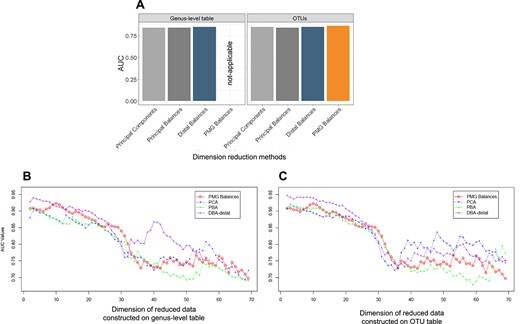
Logistic regression classification performances of dimensionality reduction methods (PCA, PBA and DBA-distal and PMG balances) on |$\textrm{OTU}$| table and genus-level table were assessed by AUC. (A) The cirrhosis dataset was reduced to optimal dimension (26) by using different dimension reduction procedures. Optimal dimension is decided based on the number of |$\textrm{PMG}$| balances. |$\textrm{PMG}$| balances are applied only on |$\textrm{OTU}$| table as the procedure is designed to group |$\textrm{OTU}$|s as an alternative to taxon grouping. Classification performances of reduced datasets were compared. Figure supplements are available in Supplementary Table 1. (B) AUC values that change with the dimension of the reduced datasets on genus-level table and (C) |$\textrm{OTU}$| table were plotted separately to compare with PMG balances. Note that the reduced dataset with PMG balances are the same in both plots.
|$\textrm{PMG}$| balances will not outperform other dimension reduction methods. However, |$\textrm{PMG}$| balances have an interpretation advantage compared with other dimension reduction methods. Reducing a dataset by |$\textrm{PMG}$| balances creates a ratio of nonoverlapping groups and only the grouped |$\textrm{OTU}$|s play a role in each |$\textrm{PMG}$| dimension. Compared with PCA, each principal component generally involve all parts of the composition in a nonhomogeneous way, thus making its interpretation difficult. Moreover, |$\textrm{PMG}$| balances offer the possibility of working with coarse groups of |$\textrm{OTU}$|s, groups that are not present in a phylogenetic tree. It is assumed that the microbial |$\textrm{OTU}$|s related to a given phenotype can be mixed up within coarser units like phylum or genus, leading to degradation of possible associations [8]. Alternatively, representing data by |$\textrm{PMG}$|s, one can obtain balances with richer high-resolution microbial features that could prevent mixed up associations resulting of taxon aggregation. As a result, |$\textrm{PMG}$|s contribute a better understanding of dimension reduction procedures.
8 |$\textrm{PMG}$|s as Feature Aggregation Procedure
PMG is an alternative way of grouping |$\textrm{OTU}$|s for microbiome research. Whether grouping |$\textrm{OTU}$|s as |$\textrm{PMG}$|s adds value in terms of creating better balances compared with |$\textrm{OTU}$|s and genus-level data was assessed. The dataset was redesigned by different data types (|$\textrm{OTU}$| table, genus-level table and |$\textrm{PMG}$| table) and they were fed to balance selection methods (selbal, codacore and DBA-distal). The classification performance of methods and discriminatory power of the selected balances on different data types were examined. Selbal and codacore have a cross-validation procedure in their model and they return an AUC value for discriminatory power of the selected balances. |$\textrm{PMG}$| table exhibited performance rivaling |$\textrm{OTU}$| and genus-level tables on selbal and codacore algorithms (Supplementary Table 3 and Figure 3A). Selbal selects a global balance and the performance of the global balance was reported in the Figure 3A. |$\textrm{PMG}$|s provided a small performance boost for selbal. The reason could be that |$\textrm{PMG}$|s combined |$\textrm{OTU}$|s that have similar discriminative role. The |$\textrm{OTU}$| content of selbal selected |$\textrm{PMG}$| balance examined in the section ‘PMG Balances as Biomarker Candidates’. The |$\textrm{OTU}$| content of |$\textrm{PMG}$|s are consistent with the literature findings in term of association with disease (Figure 4D). A further study is needed for detailed examination.
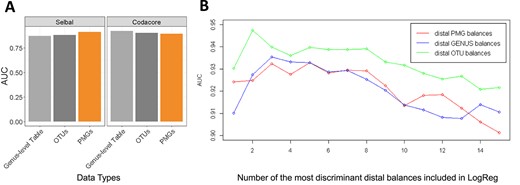
|$\textrm{OTU}$| table, genus-level table and |$\textrm{PMG}$| table were fed to selbal, codacore and DBA-distal method and the classification performances of the selected balances were compared (AUC). (A) Selbal and codacore have a cross-validation procedure in their model and they return an AUC value for discriminatory power of the selected balances. Global balance performance were reported. Note that the dimension of input |$\textrm{PMG}$| table is 27 for those methods. Figure supplements are available in Supplementary Table 2. (B) |$\textrm{OTU}$| table, genus-level table and |$\textrm{PMG}$| table were fed to DBA-distal and the classification performances of the most discriminative 15 distal balances on different data types were compared. Figure supplements are available in Supplementary Table 3. Note that DBA-distal method selects 15 |$\textrm{PMG}$| balances, 56 genera balances and 199 |$\textrm{OTU}$| balances on the cirrhosis dataset, for fair comparison, the most discriminative 15 distal balances are included in LogReg classification.
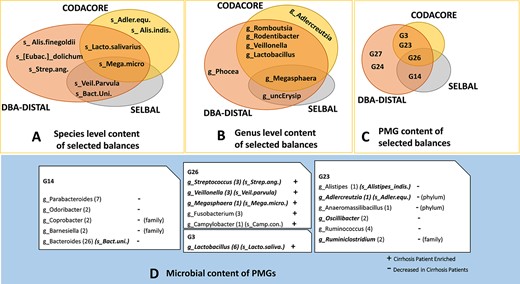
The microbial content of balances selected by different methods are presented at (A) species level, (B) genus level and (C) |$\textrm{PMG}$| level. Different colors indicate different balance selection methods. The selected |$\textrm{PMG}$|s (G14, G26, G23) and the microbial content of |$\textrm{PMG}$|s is presented at genus level in default in the blue box (D). In each |$\textrm{PMG}$| (white boxes), the number of |$\textrm{OTU}$|s belonging to each genus is specified in parenthesis. If a genus is in a |$\textrm{PMG}$| selected by any balance selection method, then it is specified in italic. Selected species by any balance selection methods are specified in the parenthesis next to each genus. Enriched and diminished genera in cirrhosis (according to literature) are specified with |$+$| and − in the |$\textrm{PMG}$|s, respectively. If the association is reported on another phylogeny, it is specified in the parenthesis next to |$+$| and − signs. Note that DBA-distal method selects 15 |$\textrm{PMG}$| balances, 56 genera balances and 199 |$\textrm{OTU}$| balances on the cirrhosis dataset. For the simplicity of the figure, only a set of the most discriminative distal balances are presented in panels A, B and C and only the microbial content of the most two discriminative distal |$\textrm{PMG}$| balances are presented in panel D.
Unlike selbal and codacore, DBA-distal method returns a dataset that consists of many balances with two or three parts (distal balances) on the inputted dataset. |$\textrm{OTU}$| table, genus-level table and |$\textrm{PMG}$| table were fed to DBA-distal method. LogReg performances (AUC) of the distal balances on three different data types were compared. DBA-distal method selects 15 PMG balances, 56 genera balances and 199 |$\textrm{OTU}$| balances on the cirrhosis dataset, for fair comparison, the most discriminative 15 distal balances are included in LogReg classification (Figure 3B). Distal |$\textrm{OTU}$| balances have higher AUC values than distal genus and |$\textrm{PMG}$| balances. On the other hand, distal |$\textrm{PMG}$| balances exhibited performance rivaling distal genus balances, noting that genus level is commonly used grouping procedure for high-dimensional microbiome data. |$\textrm{OTU}$|s are the highest possible resolution of microbial features and the possible associations are more clear on |$\textrm{OTU}$|-level data. Grouped |$\textrm{OTU}$|s (as genus or |$\textrm{PMG}$|s) will be less sparse, thus grouping could cause to degradation of possible associations. |$\textrm{PMG}$|s result in a different grouping of |$\textrm{OTU}$|s than phylogenetic grouping, and new latent functional features related with disease could be inferred. On the contrary of genus-level table, working with |$\textrm{PMG}$|s, one can obtain balances with richer high-level microbial features as biomarker candidates. Figure 4 shows the microbial content of selected balances on different data types. They have overlapping features. It is noticeable that most of the selected taxa by any balance selection methods are already included in |$\textrm{PMG}$|s (specified in italic in white boxes). Moreover, the microbial content of |$\textrm{PMG}$|s is consistent with the literature in terms of association with disease such as microbes enriched or diminished in cirrhosis patient. |$\textrm{PMG}$| balances can be used to enhance existing microbiota analysis pipelines as well as they can be used as a new source in the search of biomarkers.
9 |$\textrm{PMG}$| balances as biomarker candidates
The selected |$\textrm{PMG}$| balances by balance selection methods are called compositional biomarkers. Compositional biomarkers are in line with the recent understanding that diseases are generally associated with a ratio of discrete groups of microbial species, as opposed to individual microbes [10, 12, 14, 35]. The microbial content of the selected balances on different data types was examined with respect to association with disease mentioned in the literature.
Selected balance by selbal on |$\textrm{OTU}$| table was (Veillonella parvula, Megasphaera micronuciformis)/Bacteroides uniformis After |$\textrm{PMG}$| construction, selbal selected the balance of G26/G14 (global balance). G26 has seven unique species that are V. parvula and Mega.micro. as well as Fusobacterium nucleatum, Fusobacterium periodonticum, Campylobacter concisus, Streptococcus mutans, Streptococcus anginosus. Of these, S. anginosus, C. concisus and V. parvula are specifically mentioned in the literature as cirrhosis-related species [56, 57]. Fusobacterium is considered to be associated with cirrhosis at genus level; however the aforementioned Fusobacterium species have not been specifically mentioned in the literature. In contrast with G26, G14 has 19 unique species belonging to Bacteroides, Odoribacter, Parabacteroides, Coprobacter and Barnesiella genera. Of these, Bacteroides is specifically mentioned in the literature as the dominant genus in both cirrhosis and non-cirrhosis groups, but significantly diminished in the liver cirrhosis group [7, 56, 57]. Odoribacter and Parabacteroides are also mentioned as diminished genera in cirrhosis individuals [56]. To the best of our knowledge, Coprobacter and Barnesiella genera in G14 have not been specifically mentioned in the cirrhosis biomarker literature, but the Porphyromonadaceaa that is the family of Coprobacter and Barnesiella genera is mentioned as diminished in patients [61]. Overall, G26 includes species mostly related to, i.e. enriched, in patients with cirrhosis, whereas G14 includes species that are diminished in cirrhosis patients. Since the balance of G26/G14 is discriminant between diseased and nondiseased samples, balance of those species should be one of the priorities for future therapies to prevent and treat cirrhosis. On the other hand, selbal selects the balance of Megasphaera/unclassified Erysipelotrichaceae genera on genus-level table. Megasphaera is mentioned as cirrhosis-enriched taxa [56, 57], but Unc.Erysip has not been mentioned in the literature.
Selected balance by codacore on |$\textrm{OTU}$| table was (Lactobacillus salivarius, Mega.micro.)/(Adlercreutzia equolifaciens, Alistipes indistinctus). After PMG construction, codacore selects the balance of (G26,G3)/G23 on |$\textrm{PMG}$| table. G3 has five unique species from Lactobacillus genus. Lactobacillus is mentioned in the literature as the genus that increases in cirrhosis patients, specifically L. salivarius species [56]. In contrast with G3 and G26, G23 has seven unique species from Ruminococcus, Ruminiclostridium, Oscillibacter, Alistipes, Adlercreutzia, Anaeromassilibacillus genera. Of these, Ruminococcus, Oscillibacter and Alistipes are mentioned as the phyla diminished in cirrhosis patients [56]. Other listed genera are associated at higher level such as phylum and family. Similar to the selbal selected balance, G26 and G3 include species that are mostly enriched in cirrhosis patients, whereas G23 has species that are mostly diminished in cirrhosis patients. The balance of (G26,G3)/G23 might be another important biomarker candidate for future therapies to prevent and treat cirrhosis. On the other hand, codacore selects a balance of (Lactobacillus, Megasphaera, Veillonella, Rodentibacter)/(Adlercreutzia, Romboutsia) on genus-level table. Among them, Rodentibacter and Romboutsia have not been mentioned in the literature and Adlercreutzia has only been mentioned at phylum level.
The selected genera balances are not well supported by literature, whereas the microbial content of the selected |$\textrm{PMG}$| balances are consistent with the literature on species level or on higher taxonomic level. Thus, it can be concluded that the reliability of the selected genera balances is controversial [8].
9.0.1 Compositional biomarker
Selected |$\textrm{PMG}$| balances by balance selection methods be defined as compositional biomarkers. Selbal and codacore methods select a single balance, whereas DBA-distal selects many balances with two or three parts. The box plots at the bottom of Figure 1C show the |$\textrm{PMG}$|s that constitute the balances selected by selbal and codacore on cirrhosis dataset. They can be directly interpreted as an important ratio of groups of microbial features that are highly discriminatory between cirrhosis and non-cirrhosis individuals. DBA-distal method selected 15 distal |$\textrm{PMG}$| balances. It is noticeable that |$\textrm{PMG}$| balances together selected by selbal and codacore were the most two discriminative distal |$\textrm{PMG}$| balances on cirrhosis dataset. Prediction power of balance combinations was tested by LogReg. The classification performance of two |$\textrm{PMG}$| balances together selected by selbal and codacore is higher than separately tested balances. The classification performance of the most three discriminative distal |$\textrm{PMG}$| balances is the best as can be seen in Table 1. Moreover, the |$\textrm{PMG}$|s included in the compositional biomarker explain the most of the total variance covered by all |$\textrm{PMG}$|s. Figure 5 shows the compositional form biplot of |$\textrm{PMG}$|s included in compositional biomarkers on the cirrhosis dataset. Explained variance is 89.5% of the total variance retained by the six selected |$\textrm{PMG}$|s.
Classification performances of |$\textrm{PMG}$| balance combinations selected by balance selection methods
| Method | Compositional biomarkers | AUC |
|---|---|---|
| Selbal | (G26/G14) | 0.91 |
| Codacore | (G3,G26)/G23 | 0.90 |
| DBA-Distal (2 balance) | (G26/G14) | |
| (G3/G26)/G23 | 0.92 | |
| DBA-Distal (3 balance) | (G26/G14) | |
| (G3/G23) | ||
| (G27/G24) | 0.93 |
| Method | Compositional biomarkers | AUC |
|---|---|---|
| Selbal | (G26/G14) | 0.91 |
| Codacore | (G3,G26)/G23 | 0.90 |
| DBA-Distal (2 balance) | (G26/G14) | |
| (G3/G26)/G23 | 0.92 | |
| DBA-Distal (3 balance) | (G26/G14) | |
| (G3/G23) | ||
| (G27/G24) | 0.93 |
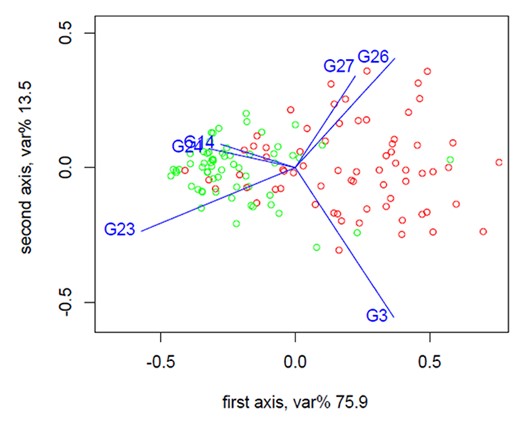
Form biplot of selected |$\textrm{PMG}$|s by balance selection methods (G26, G14, G3, G23, G24, G27). Red points indicate cirrhosis samples, whereas green points indicate non-cirrhosis samples in the dataset. Explain variance is 89.5% of the total variance retained by the six selected |$\textrm{PMG}$|s.
10 CODA dendrogram to discover discriminatory power of the balances
The CODA dendrogram is a powerful tool to explore a compositional dataset. The aim of the CODA dendrogram is to represent most of the information contained in the SBP in a comprehensive plot [62–64]. Figure 6A shows a list of species mentioned in the literature as associated with cirrhosis and non-cirrhosis samples and in which |$\textrm{PMG}$|s those species are located. In Figure 6B, the CODA dendrogram of |$\textrm{PMG}$|s is presented. Red and green horizontal bars represent the cirrhosis and non-cirrhosis samples, respectively. The length of each colored horizontal bar is proportional to the balance contribution to the total variance of the sample. The discriminatory power of each balance can be visually seen in the dendrogram. The first balance has almost double variance in cirrhosis patients than in non-cirrhosis patients. Reviewing literature about taxa associated with cirrhosis, cirrhosis-related genera are all placed in |$\textrm{PMG}$|s located at the bottom of the coda dendrogram, whereas non-cirrhosis-related genera are all placed in |$\textrm{PMG}$|s located on the upper side of the coda dendrogram.
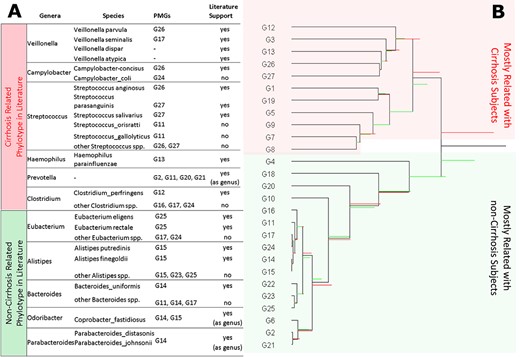
Species mentioned in the literature as associated with cirrhosis and non-cirrhosis samples take place on the different side of the first balance of the CODA dendrogram. (A) Cirrhosis and non-cirrhosis related genera mentioned in the literature are listed. Then, species exist in cirrhosis dataset belong to each genus are listed. In which |$\textrm{PMG}$|s those species are located is determined. If there is a research that mentions a species specifically associated with cirrhosis, then literature support is marked as ‘yes’. Some phylotypes are only associated with cirrhosis as genus, so they are marked ’yes (as genus)’ under the literature support column. (B) CODA dendrogram of |$\textrm{PMG}$|s for the cirrhosis dataset. Red and green horizontal bars on the CODA dendrogram represent the cirrhosis and non-cirrhosis samples, respectively. The length of each colored horizontal bar is proportional to the balance contribution to the total variance of the sample. Cirrhosis-related genera mentioned in the literature are mostly placed at the bottom of the CODA dendrogram, whereas non-cirrhosis related genera mentioned in the literature are mostly placed in the upper side of the CODA dendrogram.
The location of |$\textrm{PMG}$|s included in compositional biomarkers on the CODA dendrogram reveals the discriminative property of selected balances. The numerator groups (G3, G26, G27) include bacteria that have been mostly associated with cirrhosis and lie on the upper part of the dendrogram, whereas the denominator (G14, G23, G24) groups include bacteria that are enriched in non-cirrhosis (diminished in cirrhosis) and lie at the bottom of the dendrogram.
The members of |$\textrm{PMG}$|s are consistent with the literature in terms of association with cirrhosis disease. However, we can make inferences using the CODA dendrogram on association of species that are not previously reported with cirrhosis in the literature. For example, Campylobacter and Veillonella are two cirrhosis-related genera mentioned in the literature. The cirrhosis dataset has two species that belong to Campylobacter: C. concisus and C. coli. C. concisus is a cirrhosis-associated species specifically mentioned in the literature [56] and is located in G26. There is not any finding about C. coli specifically in the literature that we are aware of and it is located in G24. Since G24 lies at the bottom of the CODA dendrogram, there is a high probability that C. coli should not be strongly enriched, relative to the other species, in cirrhosis. Similarly, the cirrhosis dataset has two species that belong to Veillonella: V. parvula and Veillonella seminalis. Veillonella parvula is a cirrhosis-associated species specifically mentioned in the literature [57] and is located in G26, whereas V. seminalis, which is not mentioned specifically in the cirrhosis literature, lies in G17 and each group is laying on different sides of the CODA dendrogram. Since G17 lies at the bottom of the CODA dendrogram, there is a high probability that V. seminalis should not be strongly enriched with respect to V. parvula in cirrhosis. Streptococcus is another genus strongly associated with cirrhosis in the literature. In the CODA dendrogram, all species belonging to the Streptococcus genus were located in three |$\textrm{PMG}$|s: G11, G26 and G27. Two of 22 species belong to G11, which lies at the bottom of the CODA dendrogram. The remaining 20 out of the 22 species belong to G26 and G27 laying on the upper side of the CODA dendrogram. Streptococcus anginosus, Streptococcus parasanguinis and Streptococcus salivarius species are specifically mentioned in the literature as enriched in cirrhosis patient [56, 57]. Streptococcus anginosus is located in G26 and S. parasanguinis and S. salivarius are located in G27. Streptococcus species in G26 and G27 have high potential to be relatively enriched in cirrhosis, whereas species in G11 have a high potential of being relatively diminished in cirrhosis samples.
It is important to note that the balance of species is the key aspect to take into account, not the individual species. It is because focusing on a single bacteria and trying to find association with the classical statistical and machine learning techniques might detect some species that might be delusively associated with disease since the correlation of relative abundances is unreliable.
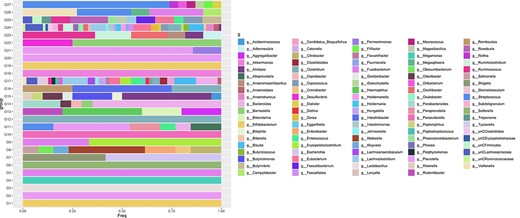
The frequency of genera (g) in each |$\textrm{PMG}$|. The members of |$\textrm{PMG}$|s are approximately proportional across samples. There are cases in which many genera participate in one PMG and conversely there are PMGs that contain exclusively |$\textrm{OTU}$|s coming from a single genus.
11 Discussions and conclusions
Recognising microbiome datasets as CODA leads researchers to utilize log-ratio methodology that brings a new perspective to biomarker research. Instead of focusing on a single or a group of microbial features assumed to be associated with a disease, focus is placed on ratios of microbial features—balances of species—and shall be one of the priorities for future therapies to prevent and treat diseases.
However, a known obstacle in the construction of balances is the choice of partition such that the resulting balances are meaningful. Some effort has been made to choose balances for classification or prediction purposes, defining the significant balances that are associated with the outcome of interest [19, 35, 51]. Philr [34] is another study that define balances utilizing phylogenetic tree. Phylogenetic agglomerated data might not be suitable for biomarker research since the microbial |$\textrm{OTU}$|s related to a given phenotype can be mixed up within coarser units like phylum or genus [8].
In this study, we introduce a novel SBP methodology utilizing PBs that naturally groups microbial features based only on relative abundances making use of the highest possible resolution of microbial features. It offers the possibility of working with coarse group of |$\textrm{OTU}$|s, which are not present in a phylogenetic tree. Each |$\textrm{PMG}$| could contain species from different genera so that the constructed balances based on |$\textrm{PMG}$|s have a unique microbial characterization. Figure 7 shows the frequencies of genera represented in each |$\textrm{PMG}$|. There are cases in which many genera participate in one |$\textrm{PMG}$| and conversely there are |$\textrm{PMG}$|s that contain exclusively |$\textrm{OTU}$|s coming from a single genus.
Filtering options and the number of |$\textrm{PMG}$|s constructed on |$\textrm{OTU}$| table could change the members of |$\textrm{PMG}$|s. Even though the number of |$\textrm{OTU}$|s change in each |$\textrm{PMG}$| with the total number of |$\textrm{PMG}$|s, core |$\textrm{OTU}$|s usually lie in the selected discriminative |$\textrm{PMG}$| balances. The construction of a different number of |$\textrm{PMG}$|s will not affect the core species composition in the groups dramatically, but will change their density. The stability of |$\textrm{PMG}$|s has been assessed under resampling and changing the sample size (similar to subsampling). The discussion about the stability of |$\textrm{PMG}$|s is available in supplementary data. The conclusion is that construction of |$\textrm{PMG}$|s are quite stable.
|$\textrm{PMG}$| balances have an interpretation advantage compared with other dimension reduction methods. Reducing a dataset by |$\textrm{PMG}$| balances creates a ratio of nonoverlapping |$\textrm{OTU}$| groups. Comparing to PCA dimension reduction, only the grouped |$\textrm{OTU}$|s play a role in each |$\textrm{PMG}$| dimension, but each principal component does not create a discrete groups of |$\textrm{OTU}$|, thus making its interpretation difficult.
The important |$\textrm{PMG}$| balances are determined using discriminative balance selection methods: selbal, codacore and DBA-distal. The results show that the |$\textrm{PMG}$| balances selected by those methods (compositional biomarkers) are highly discriminatory for the cirrhosis dataset. The content of balances are reliable since they include microbial features supported by literature. Combination of selected balances increases the classification performance for predicting cirrhosis. A set of the most informative distal |$\textrm{PMG}$| balances has a potential to be a set of strong biomarker candidates.
The proposed mathematically consistent aggregation procedure collapses |$\textrm{OTU}$|s into |$\textrm{PMG}$|s as a new alternative to taxon grouping and provides a possibility of working with high-resolution microbial features. |$\textrm{PMG}$|s overcome the high-dimensionality problem of analyzing microbiome data. |$\textrm{PMG}$| balances provide a coherent data analysis in the search of biomarkers and have a potential to identify biomarkers candidates.
High dimensionality, sparsity and the compositional character of microbiome data present statistical challenges on the way of translating research to clinical practice. Recently, the use of the log-ratio methodology developed for CODA to process statistically the microbiome has been shown to be a successful option for biomarker research.
Taxon grouping of microbiome data and inferences based on genera level, or the attempt to identify a single bacterial species associated with a disease, are up to now the main techniques for biomarker studies. As an alternative to taxon grouping, |$\textrm{PMG}$|s offer the possibility of working with coarse groups of |$\textrm{OTU}$|s, groups that are not present in a phylogenetic tree. |$\textrm{PMG}$|s can contain species from different genera so that constructed |$\textrm{PMG}$| balances have a unique microbial characterization other than phylogenetic agglomeration.
Reducing dimensionality of the data by |$\textrm{PMG}$|s contributes to the better understanding of dimension reduction procedures. |$\textrm{PMG}$| balances creates a ratio of nonoverlapping |$\textrm{OTU}$| groups and only the grouped |$\textrm{OTU}$|s play a role in each |$\textrm{PMG}$| dimension. Representing data by |$\textrm{PMG}$|s, one can obtain balances with richer high-resolution microbial features. Discriminative balance selection methods can be used to determine important |$\textrm{PMG}$| balances, termed ‘compositional biomarkers’. Compositional biomarker can be directly interpreted as an important ratio of two groups of microbial features that are discriminatory between health status. |$\textrm{PMG}$| balances can be used to enhance existing microbiota analysis pipelines as well as they can be used as a new source in the search of biomarkers.
A cirrhosis dataset has been analyzed as a demo to illustrate how |$\textrm{PMG}$| balances work. Most |$\textrm{PMG}$| members of the compositional biomarkers selected by balance selection methods are individually consistent with the literature in terms of association with disease. We strongly emphasize that researchers should focus on compositional biomarkers, preferably represented by balances, to develop promising therapies.
Acknowledgments
We thank the Knights Lab for implementing a machine learning repository for microbiome datasets.
Funding
The Scientific and Technological Research Council of Turkey [1059B141601395]; Spanish Ministry of Science, Innovation and Universities and the European Regional Development Fund [grant RTI2018-095518-B-C21 (C22) (MCIU/AEI/FEDER) to J.J.E. and V.P.G].
Aslı Boyraz. She studied Mathematics at the Hacettepe University, Turkiye and received her master's degree in 2010 in the Information Science program from the School of Computing and Information Science at the University of Pittsburgh in USA. She is currently a PhD student of Medical Informatics program at the Middle East Technical University (METU) Graduate school of Informatics, Turkiye. She is also a lecturer at the Recep Tayyip Erdoğan University, Department of Computer Technologies since since 2010. Her primary areas of interest is medical data analysis. She is currently interested in microbiome data analysis using compositional data approaches.
Vera Pawlowsky-Glahn. She studied Mathematics at the University of Barcelona, Spain, and received her PhD (doctor rerum naturam) in 1986 from the Free University of Berlin, Germany. She has been titular professor at the School of Civil Engineering of the Technical University of Catalonia (UPC) in Barcelona, Spain (1986–2000), and full professor of Statistics at the Department of Computer Science, Applied Mathematics, and Statistics of the University of Girona, Spain (2001–2018), where she is now emeritus professor of Statistics. Her main research topic is, since 1982, the statistical analysis of compositional data (CoDa) both in the spatial and non-spatial case. She developed together with Dr. J.J. Egozcue the sample space structure to CoDa. The impact of the methodology has grown exponentially in the last years, as CoDa are present in all applied sciences. She has over 150 publications and 4 books related to this topic. Her research group on compositional data analysis involves professors from different Spanish universities. They started a workshop series, known as CoDaWork, which 9 th edition took place in 2022 in Toulouse (France). Her research has received regularly financial support from the Spanish Ministry for Education and Science. Vera has been vice-chancellor at UPC 1990–1994, head of the Department of Computer Science and Applied Mathematics at the University of Girona 2004–2005, and dean of the Graduate School of the University of Girona 2005-06. The International Association for Mathematical Geosciences (IAMG) has been an important professional society in her career, supporting and promoting her research. She received from IAMG the William Christian Krumbein Medal in 2006, she was Distinguished Lecturer in 2007, and received the J.C. Griffiths Teaching Award in 2008. She was the 2008–2012 President of IAMG and the founding President of the Association for Compositional Data (L'Escala, Spain, 2015). She was the 2019 IAMG Matheron Lecturer.(Web of Science ResearcherID: B-6569-2009, https://orcid.org/0000-0001-9775-6434,Publons h-index: 30)
Juan José Egozcue. He studied Physics, oriented to Geophysics and Meteorology, at the University of Barcelona (Spain). He obtained his PhD in the same university with a dissertation on maximum entropy spectral analysis (1982). He taught several topics of Applied Mathematics and Probability and Statistics at the Civil Engineering School in the Universidad Politécnica de Cataluña (UPC, Barcelona, Spain). He became Full Professor in 1989, at the UPC and retired in February 1st 2016. In July 2016 he became UPC Professor Emeritus and continues with his research on compositional data analysis. His research activities are presently centred in the statistical analysis of compositional data, with special emphasis in the geometry of the simplex as sample space. He has been leader of several research projects. Most of them on hazard and vulnerability of coastal and port structures under action of severe ocean-waves. At present, he participates actively in a project on compositional data analysis. Research contributions have been published in many journal articles (h-index 30, Web of Science ID: B-6499-2009) and most important results are summarized in the book ``Modeling and Analysis of Compositional Data'' (Wiley 2015), coauthored by V. Pawlowsky-Glahn and R. Tolosana-Delgado and the invited contribution ``Compositional data: the sample space and its structure'' (Egozcue and Pawlowsky-Glahn, TEST, 2019).
Aybar Can Acar. He is a faculty member at the Middle East Technical University (METU) Graduate School of Informatics, Turkiye. He received his BS ans MS degrees in Chemical Engineering from METU, and his PhD in Computer Science from George Mason University, in USA. His primary areas of interest are probabilistic modeling, machine learning, transcriptomics and systems biology. He is currently the director of the Cancer Systems Biology Laboratory at METU.
References
Yuanpei Cao, Anru Zhang, and Hongzhe Li.
