


Abstract
Computerized methods for drug-related side effect identification can help reduce costs and speed up drug development. Multisource data about drug and side effects are widely used to predict potential drug-related side effects. Heterogeneous graphs are commonly used to associate multisourced data of drugs and side effects which can reflect similarities of the drugs from different perspectives. Effective integration and formulation of diverse similarities, however, are challenging. In addition, the specific topology of each heterogeneous graph and the common topology of multiple graphs are neglected.
We propose a drug-side effect association prediction model, GCRS, to encode and integrate specific topologies, common topologies and pairwise attributes of drugs and side effects. First, multiple drug-side effect heterogeneous graphs are constructed using various kinds of similarities and associations related to drugs and side effects. As each heterogeneous graph has its specific topology, we establish separate module based on graph convolutional autoencoder (GCA) to learn the particular topology representation of each drug node and each side effect node, respectively. Since multiple graphs reflect the complex relationships among the drug and side effect nodes and contain common topologies, we construct a module based on GCA with sharing parameters to learn the common topology representations of each node. Afterwards, we design an attention mechanism to obtain more informative topology representations at the representation level. Finally, multi-layer convolutional neural networks with attribute-level attention are constructed to deeply integrate the similarity and association attributes of a pair of drug-side effect nodes. Comprehensive experiments show that GCRS’s prediction performance is superior to other comparing state-of-the-art methods for predicting drug-side effect associations. The recall rates in top-ranked candidates and case studies on five drugs further demonstrate GCRS’s ability in discovering potential drug-related side effects.
Introduction
Drug-related side effects are adverse changes beyond the expected therapeutic effect after normal use of drugs, and are usually one of the main reasons for the failure of drugs in clinical trials [1–3]. Therefore, identifying potential drug-related side effects can help to reduce its development costs [4, 5].
Computer prediction methods have demonstrated the ability to identify drug-related side effects to help biologists in further experiments [6–8]. The existing methods are mainly divided into three classes. The first class of docking-based methods is to identify the potential candidate drug-related side effects based on drug-related proteins, these methods require information on the three-dimensional structure of the proteins [9, 10]. However, these methods cannot be applied to drugs related to proteins with unknown three-dimensional structures information [11].
The second class of prediction methods utilizes machine learning techniques to predict drug-related side effect associations. Liu et al. used five machine learning algorithms, including logistic regression, naive bayes, |$k$|-nearest neighbor algorithm, random forest and support vector machine to predict drug-related side effects [12]. Several methods used the multi-label learning [13], multi-kernel learning [14], and the minimal-redundancy-maximum-relevancy algorithm [15] to predict potential drug-related side effects. Methods based on matrix factorization and graph models have also been explored to integrate drugs and side effects related to similarities and associations. Hu et al. constructed multiple drug similarity networks and combined random walk and skip-gram algorithm for prediction [16]. The graph regularized matrix factorization model (FGRMF) [17], triple matrix factorization model based on nuclear target alignment [18], and non-negative matrix factorization [19] are proposed to infer drug-related side effects associations. However, these methods are shallow prediction methods, which are difficult to extract deep and complex associations of drug and side effect nodes from multisource data.
With the development of deep learning technology, recent methods can extract deeper-level features to improve prediction performance. Zhao et al. integrated multiple similarities of drugs and side effects and utilized multilayer perceptron and convolutional neural network to predict drug-side effect associations and frequencies [20]. [21] proposed a model for predicting the frequency of potential drug-related side effects based on graph attention network. However, these methods have not fully utilized the wide variety of drug similarities. A couple of methods are presented based on graph neural networks [22] and graph convolutional network [23] to predict the interactions between drugs and targets, respectively. In addition, a node representation learning method is proposed based on graph convolutional network and it is applied to the general networks, such as research paper-citation network, for node classification [24]. The importance of multiple heterogeneous graphs constructed by using multiple drug similarities for drug-side effect association prediction has been neglected.
In this article, a new prediction model, GCRS, is proposed to learn and integrate the specific topologies, common topologies and pairwise attributes from multiple drug-side effect heterogeneous graphs. The contributions of this model include the following:
Based on the similarity of drugs at the chemical substructures level and the similarity of drugs at the associated diseases level, we constructed two drug-side effect heterogeneous graphs, respectively. Since these similarities reflect the similarity degrees of the drugs from different perspectives. Each graph comprises intralayer similarity edges and interlayer association edges to embed similarities and associations across multi-sources of data containing drugs and side effects.
We propose graph convolutional autoencoder (GCA) based modules to encode specific topology representations of drug and side effect nodes in each heterogeneous graph. To learn common topology representations of all nodes between two heterogeneous graphs, we propose another GCA module with sharing parameters.
Since specific topology representations and common topology representations of drug and side effect nodes have different contributions to predicting drug-side effect associations, we further establish a representation-level attention mechanism to distinguish their contributions for adaptive fusion.
Based on the biological premise that a pair of drug-side effect nodes with common drugs or side effects are more likely to be associated, two kinds of attribute embeddings of drug side-effect pair are extracted from two heterogeneous graphs. Since each attribute in each attribute embedding has different importance for drug-side effect associations prediction, we propose an attribute-level attention mechanism to distinguish the importance of each attribute, then learn these with multi-layer convolutional neural network to obtain pairwise attribute representation of the drug and side effect nodes. The improved prediction performance is demonstrated by comparison with several state-of-the-art models, ablation studies and case studies on five drugs.
Materials and methods
To predict candidate side effects for a given drug of interest, we constructed two different bilayer heterogeneous graphs based on two types of drug similarities and proposed a drug-related side effects prediction model GCRS (Figure 1). The model includes two branches: the first branch learns the specific topology representations of drug and side effect nodes in each heterogeneous graph and common topology representations of all nodes between two heterogeneous graphs, based on GCA modules and GCA module with sharing parameters, respectively. Afterwards, a representation-level attention mechanism is established to fuse the specific topology representations and common topology representations of the drug and side effect nodes. For the second branch, two types of drug similarity are considered to construct two different pairwise attribute embeddings of the drug-side effect pair. Then, the importance of each attribute in each embedding is measured by an attribute-level attention mechanism. Finally, for each pairwise attribute embedding, the multi-layer convolutional neural network is constructed to deeply integrate pairwise attributes of a pair of drug-side effect nodes.
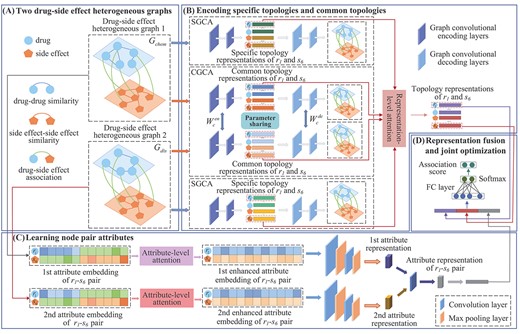
Framework of the proposed GCRS model. (A) construct two drug-side effect heterogeneous graphs based on two kinds of drug similarities (B) encode specific topologies and common topologies of drug and side effect nodes (C) learn attributes of |${r_i}$|-|${s_j}$| pair (D) fusion multiple representations for final drug-side effect association prediction.
Dataset
The dataset of drug-related side effect associations prediction is extracted from [25], containing drug-side effect associations, drug-disease associations and drug-drug similarities based on chemical substructure. A total of 80 164 pairs of associations involving 708 drugs and 4192 side effects were derived from the SIDER database [26]. The original drug-disease associations are extracted from the Comparative Toxicogenomics database [27], which covers 199 214 pairs of associations for 708 drugs and 5603 diseases.
Drug-side effect heterogeneous graphs
Based on two types of drug similarities, two bilayer heterogeneous graphs containing the drug layer and the side effect layer are constructed, respectively are expressed as |${G_{chem}}=(V,{E_{chem}},{W_{chem}})$| and |${G_{dis}}=(V,{E_{dis}},{W_{dis}})$|, the construction process is shown in Figure 2. The node-set |$V$| is composed of drug node-set |$V^{drug}$| and side effect node-set |$V^{se}$|, and the edge |${e_{ij}} \in E$| represents the edge between |${v_i},{v_j} \in V$|, whose weight is |${{\text{w}}_{ij}}\in W$|. Since different kinds of edges reflect different connection relationships between drug and side effect nodes, so the types of edges can be divided into intralayer similarity edges and interlayer association edges. |$W$| is defined as |$W = (S,D)$|, where |$S$| is the intralayer similarity matrix and |$D$| is the interlayer association matrix. The intralayer similarity matrix represents the similarity between nodes of the same type, and the interlayer association matrix represents the association relationship between different types of nodes.
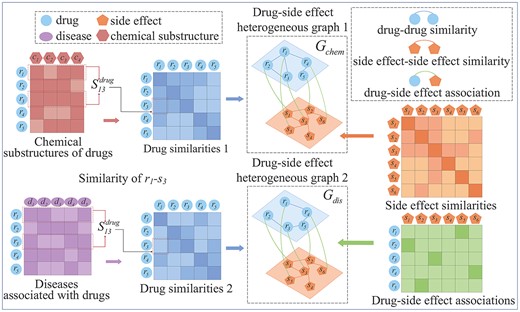
Illustration of constructing two drug-side effect heterogeneous graphs based on two kinds of drug similarities.
Encoding specific topologies and common topologies based on specific graph convolution autoencoder
Each heterogeneous graph contains the drug similarity, the side-effect similarity, and the associations between drugs and side effects. The drug similarities in the first heterogeneous graph (|${G_{chem}}$|) are calculated based on their chemical substructures, and the drug similarities in the second heterogeneous graph (|${G_{dis}}$|) are calculated based on their associated diseases. Therefore, each graph has its specific topologies. These two heterogeneous graphs reflect the complex relationships among all the drug and side effect nodes, which make them have common topologies. No matter specific topology structures and common topology structures are crucial for predicting drug-side effect associations. Therefore, we first learn the specific topology representations of all the drug and side-effect nodes in |${G_{chem}}$|, |$Z_{chem}^s$|, based on a graph convolutional autoencoder module (SGCA). We also encode the specific topology representations of all these nodes within |${G_{dis}}$| by another SGCA, and then we get |$Z_{dis}^s$|. |${G_{chem}}$| and |${G_{dis}}$| pass through the graph convolution autoencoder module with parameter sharing (CGCA), respectively. Thus, we get the common topology representation matrices |$Z_{chem}^c$| and |$Z_{dis}^c$|.
Encoding specific topologies based on SGCA
The weight matrix |${W_l}$| of the |$l$|-th heterogeneous graph represents the adjacency relationship between all drug and side effect nodes and the weight of the edges, it can be regarded as being between the nodes of the |$l$|-|$th$| heterogeneous graph the adjacency matrix |${A_l}$|, |${A_l} = {W_l}$|. The row where the |$i$|-th drug in |${W_l}$| is located, records the similarities between the |$i$|-|$th$| drug and all other drugs and the associations with all side effects. Similarly, the associations between the |$j$|-th side effect and the drug nodes and the similarity with all other side effect nodes are included in the row of this side effect. Therefore, |${W_l}$| can also be viewed as the |$l$|-th drug and side effect nodes’ attribute matrix |${X_l}$|, |${X_l} = {W_l}$|. Given the adjacency matrix |${A_l}$| and attribute matrix |${X_l}$|, we established the |$l$|-th SGCA module to encode specific topology representation of all drug and side effect nodes, as shown in Figure 1(b).
Encoding common topologies based on CGCA
The CGCA module is established, as shown in Figure 1(b). Two heterogeneous graphs |${G_{chem}}$| and |${G_{dis}}$| related to adjacency and attribute matrix both pass through the encoder of CGCA, to encode the common topology representations |$Z_{chem}^c$| and |$Z_{dis}^c$| of drug and side effect nodes. Then, |$Z_{chem}^c$| and |$Z_{dis}^c$| are input into the decoder to obtain the reconstructed matrices |$\hat X_c^{chem}$|and |$\hat X_c^{dis}$|.
Representation-level attention mechanism
Optimization
Learning pairwise attributes based on multi-layer convolutional neural networks with attribute-level attention
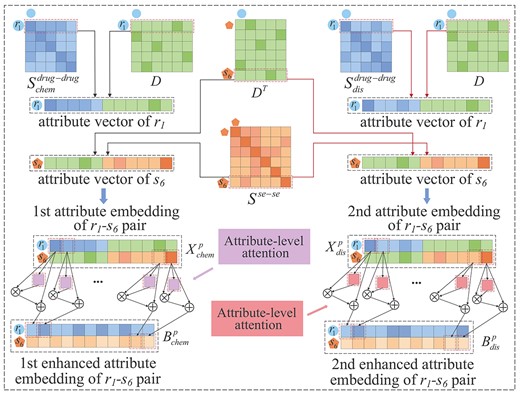
Construction of two enhanced attribute embeddings of a drug-side effect pair with attribute-level attention.
Representation fusion and joint optimization
Experimental results and discussions
Parameter setting and evaluation metrics
The proposed method uses the PyTorch framework to implement and run with a GPU (Nvidia GeForceRTX2060) with 6GB of memory. The number of encoding and decoding layers of module SGCA and module CGCA in the GCRS method were both set to 2. The dimensions of the output features of the two encoding layers in the SGCA and CGCA were set to 2500 and 1250, respectively. For multi-layer convolutional neural networks with attention, the size and number of filters in the first convolution layer was set to 2|$\times $|2 and 16, respectively, the step size was 2, and the number of zero padding was 1. The second convolution layer contained 32 filters of size 2|$\times $|2, the step size and the number of zero padding were 2 and 1, respectively. The filter sizes in the two pooling layers were 1 |$\times $| 2 and 2 |$\times $| 2, and the step sizes were 1 and 2, respectively.
Five-fold cross-validation was performed to evaluate GCRS’s performance. The positive samples composed of all known drug-side effect associations, were randomly divided into five parts, where four parts were used for training, and the remaining for testing. The unobserved drug-side effect associations were all taken as negative samples. Negative samples were randomly chosen whose equal amounts to four parts positive samples and added to the training set, and the remaining negative samples were used for testing.
In addition, biologists usually select the high-ranked drug candidate side effects for verification in the prediction results that we have obtained. Thus, we calculated the recall rates in top-ranked candidates of the predicted results. The higher recall rate indicates that more positive samples are correctly identified.
Ablation studies
Ablation studies were used to verify the independent contributions of the learned specific topologies, common topologies, pairwise attributes and the attribute-level attention mechanism (Table 1). Without SGCA(or CGCA) encoding specific topologies (or encoding common topologies), the AUC and AUPR decreased by 2.4% and 6.5% (or 2.0% and 3.3%), respectively, compared with our model. Compared with the model without pairwise attributes, the performance of GCRS in AUC and AUPR improved by 2.8% and 8.7%, respectively. Compared with the final model GCRS, the AUC without attribute-level attention model decreased by 1.6% and AUPR decreased by 5.3%. The experimental results show that pairwise attributes contribute the most to the prediction of drug-side effect associations. The experimental results show that pairwise attributes contribute the most to the prediction of drug-side effect associations. The primary reason is that the pairwise attributes contain the similarity and association connections between a drug node (side effect node) and its neighboring drug and side effect nodes. And, the results indicated the specific topology of each heterogenous graph is more important than its common topology for the prediction. The attribute-level attention assigned higher weights to the more informative attributes, and thus the attention is helpful for the prediction model to capture the more important attributes.
Results of the ablation studies
| Specific topologies | Common topologies | Pairwise attributes | Attribute-level attention | Average AUC | Average AUPR |
|---|---|---|---|---|---|
| ✗ | ✓ | ✓ | ✓ | 0.933 | 0.207 |
| ✓ | ✗ | ✓ | ✓ | 0.937 | 0.239 |
| ✓ | ✓ | ✗ | ✗ | 0.929 | 0.185 |
| ✓ | ✓ | ✓ | ✗ | 0.941 | 0.219 |
| ✓ | ✓ | ✓ | ✓ | 0.957 | 0.272 |
Comparison with other methods
The several state-of-the-art methods are compared with GCRS, including DTI-MGNN [22], SDPred [20],EEG-DTI [23], AM-GCN [24], Galeaon’s method [19], RW-SHIN [16], Ding’s method [14] and FGRMF [17]. In 5-fold cross-validation, our method GCRS and all comparison methods were trained and tested using the same dataset. The super parameters of the comparison methods were set to the best reported values, where the number of attention heads = 4 for DTI-MGNN; learning rate = 1e-4, batch size = 128, dropout rate = 0.5, |$r$| = 32 and |$\mu $| = 1e-5 for SDPred; the number of layers of GCN = 3 for EEG-DTI; the dropout rate = 0.5 for AM-GCN; |$\alpha $| = 0.05 for Galeaon’s method; embedding dimension = 32 for RW-SHIN; |$\lambda $| = 1 for Ding’s method; |$\mu $| = 8 and |$\lambda $| = 4 for FGRMF. We briefly introduce the comparison methods in below:
DTI-MGNN [22]: The method constructed the topology graph and the feature graph, respectively. The potential drug-related targets were predicted based on the model composed on graph neural network and graph convolutional network. It ignored to learn the attributes about a pair of drug and target nodes. We developed the method and then utilized it to predict drug-related side effects.
SDPred [20]: SDPred integrated the multisource data about drugs and side effects and it learned the features of the drug and side effect nodes. These node features were fed into the multilayer perceptron to get the prediction results. The method failed to learn the topology structure among the drug and side effect nodes.
EEG-DTI [23]: EEG-DTI constructed a drug-target heterogenous network and then built a prediction model based on graph convolutional network. It did not construct multiple heterogenous networks which make it fail to completely utilize multiple kinds of drug similarities. We also developed it and used it for drug-side effect association prediction.
AM-GCN [24]: AM-GCN constructed a topology network and a feature network, and then it built its model based on graph convolutional network. It was originally applied on the general networks, such as a research paper-citation network. It was implemented and used for predicting drug-related side effects. It did not construct the decoding layer of graph convolutional network, and it ignored to learn the attributes for a pair of drug-side effect nodes.
Galeano’s method [19]: It predicted the drug-related side effects based on the constructed matrix factorization model. The model decomposed the drug-side effect association matrix into a feature matrix of drugs and a feature matrix of side effects. The model is a shallow prediction one, so it fail to encode the complex relationships which are contained by the multiple kinds of connections among the drug and side effect nodes.
RW-SHIN [16]: RW-SHIN built multiple networks composed of drug nodes and the connections among them by using drug-related data. The embeddings of drug nodes were learned by random walk on each drug network and then followed by utilizing the skip-gram algorithm. It only learned the topology information of drug nodes, but it ignored that of side effect nodes.
Ding’s method [14]: Multiple kinds of drug similarities (side effect similarities) were fused based on centered kernel alignment-based multiple kernel learning. The association propensities between drugs and side effects were estimated by the kronecker regularized least squares. However, it did not utilize the topology structure among the heterogeneous network composed of drug nodes and side effect nodes.
FGRMF [17]: The method inferred the candidate drug-related side effects based on matrix factorization. It did not belong to the deep learning methods which make it difficult to learn nonlinear and complex associations among drugs and side effects.
The average ROC curves of all the methods with the 708 drugs are shown in Figure 4 (A). The AUC value of our model is optimal, which is 0.957, 1.8% higher than DTI-MGNN, 1.1% higher than SDPred, 2.4% higher than EEG-DTI, 3.0% higher than AM-GCN, 4.5% higher than Galeaon’s method, 6.5% higher than RWSHIN, 1.2% higher than Ding’s method and 3.8% higher than FGRMF. The second-best model SDPred integrates multiple kinds of drugs and side effects similarities information, and the results show that this information helps predict drug-side effects associations. The AUC value of DTI-MGNN is slightly lower (0.6%) than that of Ding’s method, and the AUPR value of DTI-MGNN is slightly higher (0.7%) than that of the latter. The values of AUC and AUPR of EEG-DTI were 0.6 and 1.6 higher than those of AM-GCN, respectively. Galeaon’s method and FGRMF are based on matrix factorization, the AUC and AUPR of FGRMF are 0.7% and 4.8% higher, respectively, than that of Galeaon’s method. This may be because FGRMF introduces information on drug similarity. The performance of the RW-SHIN method is worse than that of the other methods, which may be because it ignored the topology information of side effect nodes. In summary, GCRS integrates two types of drug similarities, the similarity of side effects and the specific topologies and common topologies of drug and side effect nodes of the two drug-side effect heterogeneous graphs.
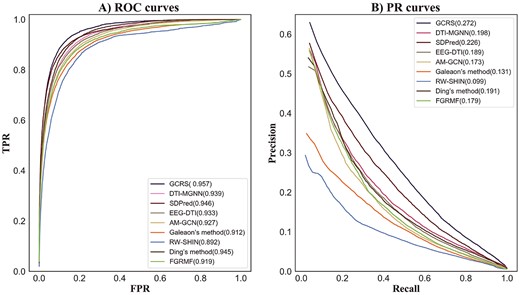
ROC and PR curves of different prediction methods.
For 708 drugs, the average AUPR value of all the methods are given in Figure 4 (b). The AUPR value of GCRS is 0.272, which is 7.4%, 4.6%, 8.3%, 9.9%, 14.1%, 17.3%, 8.1%, 9.3% higher than DTI-MGNN, SDPred, EEG-DTI, AM-GCN, Galeaon’s method, RW-SHIN, Ding’s method, and FGRMF, respectively.
In addition, the paired Wilcoxon test method was also used to compare whether the performance of the GCRS was significantly higher than that of the other methods. Each prediction method obtains 708 AUCs (AUPRs) for 708 drugs. We used 708 AUC pairs (AUPR pairs) of two methods to calculate their Wilcoxon test value. The statistical results in Table 2 showed that when the |$p$|-values were <0.05, our model was superior to other methods both in terms of AUC and AUPR, which statistical significance (|$p$| < 0.05).
The results of the paired Wilcoxon test on the AUCs and AUPRs over all the 708 drugs by comparing GCRS and other methods
| DTI-MGNN | SDPred | EEG-DTI | AM-GCN | Galeaon’s method | RW-SHIN | Ding’s method | FGRMF | |
|---|---|---|---|---|---|---|---|---|
| |$p$|-value of AUC | 1.5676e-09 | 3.0138e-06 | 5.4767e-32 | 7.3653e-42 | 3.1407e-57 | 4.9418e-87 | 2.7548e-15 | 3.5504e-53 |
| |$p$|-value of AUPR | 3.8317e-14 | 4.4753e-06 | 8.0434e-17 | 3.2244e-26 | 6.5506e-41 | 3.5356e-61 | 6.5825e-18 | 1.6100e-41 |
The recall rates of the top-|$k$| side effect candidates are given in Figure 5. With |$k$| was 30, The optimal recall rate of our model was 47.0%, SDPred obtained the second best 41.8%.The recall rate of 36.6% was obtained by DTI-MGNN. Ding’s method recall rate was 35.5%. EEG-DTI and AM-GCN achieved 34.7% and 33.7% recall rate, respectively. FGRMF and Galeaon’s method recall rates were 32.8% and 32.3%, respectively. The recall rate of RW-SHIN was 23.7%. With |$k$| was 60,90 and 120, our model still outperformed the other methods, the recall rate was 59.6%, 66.8% and 71.9%, respectively. The second best was the SDPred, the recall rates were 54.9%, 62.3% and 67.4%. DTI-MGNN obtained recall rates of 49.6%, 57.5% and 62.9%. The recall rates of Ding’s method were 48.2%, 56.3% and 62.2%. The recall rate of EEG-DTI in the top 30, 60 and 120 was 47.3%, 54.6% and 59.8%, respectively. AM-GCN achieved the recall rates of 45.0%, 52.1%, 58.2% in the top 30, 60 and 120. The recall rates of FGRMF were very close to Galeaon’s method in the top 30, 60 and 120. FGRMF obtained recall rates of 45.2%, 52.5% and 58.1%, whereas Galeaon’s method obtained recall rates of 43.6%, 51.7% and 56.8%. RW-SHIN ranked 34.3%, 41.3% and 47.2% in top 30, 60 and 120, respectively, which all lower than the other methods. The results show that GCRS outperformed the other methods at different values.
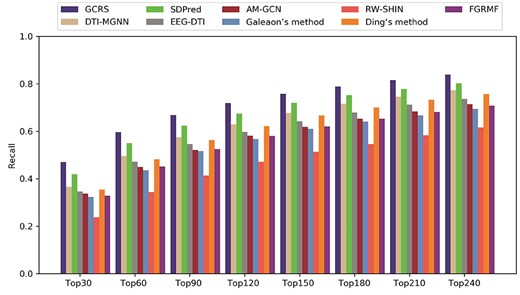
Recall rates over all drugs at different top |$k$| values.
Case studies on five drugs
To further demonstrate the ability of GCRS to discover the potential drug-side effect associations, case studies on Clozapine, Amitriptyline, Ziprasidone, Ciprofloxacin and Aripiprazole, are conducted. First, the association score of each drug’s candidate side effects can be obtained through the model and arranged in descending order. The top 15 candidate side effects of each drug are collected for validation and analysis. The experimental results are presented in Table 3.
Top 15 candidate side effects of five drugs
| Drug name | Rank | Side effect name | Evidence | Rank | Side effect name | Evidence |
|---|---|---|---|---|---|---|
| 1 | Hallucinations | MetaADEDB | 9 | Anxiety | Drugcentral, MetaADEDB | |
| 2 | Pain | Drugcentral, MetaADEDB, Rxlist | 10 | Agranulocytosis | Drugcentral, MetaADEDB, Rxlist | |
| 3 | Blurred vision | Rxlist | 11 | Arrhythmia | Drugcentral, Rxlist | |
| Clozapine | 4 | Tardive dyskinesia | Drugcentral, MetaADEDB, Rxlist | 12 | Angioedema | Drugcentral, MetaADEDB, Rxlist |
| 5 | Seizures | MetaADEDB, Rxlist | 13 | Disorientation | Drugcentral, MetaADEDB | |
| 6 | Somnolence | Drugcentral, MetaADEDB, Rxlist | 14 | Flushing | Drugcentral, MetaADEDB | |
| 7 | Alopecia | Drugcentra, MetaADEDB | 15 | Nasal congestion | Drugcentral | |
| 8 | Abdominal pain | Drugcentral, MetaADEDB, Rxlist | ||||
| 1 | Hypotension | Drugcentral, MetaADEDB | 9 | Lethargy | Drugcentral, MetaADEDB | |
| 2 | Confusion | Rxlist | 10 | Anxiety | Drugcentral, MetaADEDB, Rxlist | |
| 3 | Seizures | Literature[38] | 11 | Dystonia | Drugcentral, MetaADEDB | |
| Amitriptyline | 4 | Pruritus | Drugcentral, MetaADEDB | 12 | Abdominal pain | Drugcentral, MetaADEDB, Rxlist |
| 5 | Hypersensitivity | Drugcentral, MetaADEDB | 13 | Dry mouth | Drugcentral, Rxlist | |
| 6 | Jaundice | Drugs.com, MetaADEDB | 14 | Delirium | Drugcentral, MetaADEDB | |
| 7 | Dizziness | Drugcentral, MetaADEDB, Rxlist | 15 | Infection | Drugcentral, MetaADED | |
| 8 | Pain | Drugcentral, MetaADEDB | ||||
| 1 | Dystonia | Drugcentral, MetaADEDB, Rxlist | 9 | Tremor | Drugcentral, MetaADEDB, Rxlist | |
| 2 | Hyperventilation | Literature[39] | 10 | Nervousness | Rxlist, MetaADEDB | |
| 3 | Hostility | Rxlist | 11 | Postural hypotension | Rxlist | |
| Ziprasidone | 4 | Gynecomastia | Drugcentral, Rxlist | 12 | Pruritus | MetaADEDB |
| 5 | Rash | Drugcentral, Rxlist | 13 | Glaucoma | Literature[41] | |
| 6 | Dysarthria | Literature[40] | 14 | Fatigue | Drugcentral, MetaADEDB | |
| 7 | Vesiculobullous rash | Rxlist | 15 | Dysphagia | Drugcentral, Rxlist | |
| 8 | Tachycardia | Drugcentral, MetaADEDB, Rxlist | ||||
| 1 | Fever | MetaADEDB, Rxlist | 9 | Syncope | Drugcentral, MetaADEDB, Rxlist | |
| 2 | Diarrhea | MetaADEDB, Rxlist | 10 | Hypotension | Drugcentral, MetaADEDB, Rxlist | |
| 3 | Abdominal pain | Drugcentral, MetaADEDB, Rxlist | 11 | Asthma | Drugcentral, MetaADEDB, Rxlist | |
| Ciprofloxacin | 4 | Vomiting | Drugcentral, MetaADEDB, Rxlist | 12 | Back pain | Drugcentral, MetaADEDB, Rxlist |
| 5 | Thrombocytopenia | MetaADEDB | 13 | Agranulocytosis | Drugcentral, MetaADEDB | |
| 6 | Dyspnea | MetaADEDB, Rxlist | 14 | Tachycardia | MetaADEDB, Rxlist | |
| 7 | Constipation | MetaADEDB | 15 | Infection | Drugcentral, MetaADEDB | |
| 8 | Alopecia | Drugcentral, MetaADEDB | ||||
| 1 | Syncope | MetaADEDB, Rxlist | 9 | Pain in extremity | Drugcentral, Rxlist | |
| 2 | Spasm | Literature[39] | 10 | Dizziness | Drugcentral, MetaADEDB, Rxlist | |
| 3 | Insomnia | Drugcentral, Rxlist | 11 | Bronchitis | Drugcentral, MetaADEDB | |
| Aripiprazole | 4 | Arthralgia | Drugcentral, MetaADEDB, Rxlist | 12 | Diarrhea | Rxlist |
| 5 | Anxiety | Drugcentral, MetaADEDB | 13 | Hallucinations | Drugcentral, MetaADEDB | |
| 6 | Somnolence | Drugcentral, MetaADEDB,Rxlist | 14 | Pruritus | Drugcentral, MetaADEDB, Rxlist | |
| 7 | Abdominal pain | Drugcentral, MetaADEDB, Rxlist | 15 | Pancreatitis | Literature[40] | |
| 8 | Tremor | Drugcentral, MetaADEDB, Rxlist |
MetaADEDB is an adverse drug event database that contains information on side effects associated with 8498 drugs with clinically reported evidence [35]. DrugCentral integrates information such as drug-related proteins and indications, and the indications contain information on drug-related side effects [36]. Rxlist is an online drug-related information query database that records prescription information such as side effects and drug interactions of more than 5000 drugs in clinical applications [37]. Among the 75 candidate side effects, 54 were included in MetaADEDB, and DrugCentral covered 50, with 44 recorded by Rxlist, suggesting that the side effects were indeed associated with the corresponding drugs. The six side effects labeled ”Literature” are supported by published literature, indicating that they are more likely to be related to the corresponding drugs. In conclusion, the case studies of five drugs demonstrated that GCRS could indeed find potential drug-side effect associations.
Prediction of novel drug-side effect associations
After validating the GCRS of the predictive performance through comprehensive evaluation, we applied it to predict the potential side effects for novel drugs. All known drug-side effect associations are utilized to train the GCRS model, and we randomly selected the unobserved drug-side effect pairs whose number is equal to that of the known associations for training. Then, the trained model is applied to obtain each drug’s top candidate side effects and listed in supplementary table ST1 to help biologists find new drug-related side effects in further experiments.
Conclusion
We propose the GCRS model to learn and integrate the specific topologies, common topologies and pairwise attributes of the drug and side effect nodes to predict drug-side effect associations. Two heterogeneous graphs are constructed to benefit the topology encoding of the drug and side effect nodes and node pair attribute embedding. The SGCA is established to encode the specific topology representations of drug and side effect nodes in each heterogeneous graph. To learn the common topology representations of all nodes between two heterogeneous graphs further establish the CGCA. Representation-level attention mechanism is proposed to assign higher weights to more important topology representations. The pairwise attributes are learned by multi-layer convolutional neural networks with attribute-level attention. The ablation experiential results indicated that it is essential for the improved performance to integrate the specific topologies, common topologies, pairwise attributes. Comparing with several state-of-the-art models shows GCRS’s improved performance in AUC and AUPR. GCRS is more attractive to biologists because its recall rates in top-ranked candidates often contain more reliable drug-side effect associations. Case studies further demonstrate the powerful prediction ability of the GCRS. In addition, each heterogeneous graph contains various connections and these connections form multiple meta-paths with different semantics. Therefore, we plan to integrate the information from the meta-paths in the future.
Constructed two bilayer heterogeneous graphs, to help extract and integrate multiple similarities and associations between drugs and side effects.
A novel framework is proposed to learn the multiple representations. The specific topologies of the drug and side effect nodes in each heterogeneous graph are revealed by the specific topology representations, and the common topologies of nodes in multiple heterogeneous graphs are revealed by the common topology representations. Pairwise attribute representation reveals the drugs and side effects information related to a pair of drug and side effect nodes.
Novel attention mechanisms at representation-level and attribute-level to distinguish the different contributions of different topology representations and different attributes to the prediction of final drug side-effect associations, respectively.
Improved prediction performance is demonstrated by comparison with several state-of-the-art methods, the recall rates in top-ranked candidates, the paired Wilcoxon test and the case studies on five drugs.
Data availability
The dataset about this study is available at https://github.com/pingxuan-hlju/GCRS.
Funding
The Natural Science Foundation of China (62172143, 61972135); Natural Science Foundation of Heilongjiang Province (LH2019A029); China Postdoctoral Science Foundation (2020M670939, 2019M650069); Heilongjiang Postdoctoral Scientific Research Staring Foundation (BHLQ18104).
Author Biographies
Ping Xuan, PhD (Harbin Institute of Technology), is a professor at the School of Computer Science and Technology, Heilongjiang University, Harbin, China. Her current research interests include complex network analysis, deep learning and medical image analysis.
Meng Wang is studying for her Master’s degree in the School of Computer Science and Technology at Heilongjiang University, Harbin, China. Her research interests include complex network analysis and deep learning.
Yong Liu, PhD (Harbin Institute of Technology), is an associate professor at the School of Computer Science and Technology, Heilongjiang University, Harbin, China. His current research interests include social network analysis, and deep learning.
Dong Wang is studying for his Master’s degree in the School of Computer Science and Technology at Heilongjiang University, Harbin, China. His research interests include complex network analysis and deep learning.
Tiangang Zhang, PhD (The University of Tokyo), is an associate professor of the School of Mathematical Science, Heilongjiang University, Harbin, China. His current research interests include complex network analysis and computational fluid dynamics.
Toshiya Nakaguchi, PhD (Sophia University), is a professor at the Center for Frontier Medical Engineering, Chiba University, Chiba, Japan. His current research interests include medical image processing, machine learning, image-guided surgery and biomedical measurement.
