


Abstract
One of the most difficult problems that hinder the development and application of herbal medicine is how to illuminate the global effects of herbs on the human body. Currently, the chemo-centric network pharmacology methodology regards herbs as a mixture of chemical ingredients and constructs the ‘herb-compound-target-disease’ connections based on bioinformatics methods, to explore the pharmacological effects of herbal medicine. However, this approach is severely affected by the complexity of the herbal composition. Alternatively, gene-expression profiles induced by herbal treatment reflect the overall biological effects of herbs and are suitable for studying the global effects of herbal medicine. Here, we develop an online transcriptome-based multi-scale network pharmacology platform (TMNP) for exploring the global effects of herbal medicine. Firstly, we build specific functional gene signatures for different biological scales from molecular to higher tissue levels. Then, specific algorithms are designed to measure the correlations of transcriptional profiles and types of gene signatures. Finally, TMNP uses pharmacotranscriptomics of herbal medicine as input and builds associations between herbs and different biological scales to explore the multi-scale effects of herb medicine. We applied TMNP to a single herb Astragalus membranaceus and Xuesaitong injection to demonstrate the power to reveal the multi-scale effects of herbal medicine. TMNP integrating herbal medicine and multiple biological scales into the same framework, will greatly extend the conventional network pharmacology model centering on the chemical components, and provide a window for systematically observing the complex interactions between herbal medicine and the human body. TMNP is available at http://www.bcxnfz.top/TMNP.
Introduction
Herbal medicine, as a complementary or alternative medicine of modern medicine, plays an important role in maintaining human health. Its prescription is characterized by mixing multiple herbs into a single formula to tame complex diseases from a combinatorial/systems-based fashion. However, the mechanisms underlying the complex interactions between herbal medicine and the human body remain largely uncovered. In recent years, with a similar holistic concept, network pharmacology was introduced to this area, in which herbs are regarded as a combination of chemical components, and the biological targets of each herb are predicted based on the chemical structures of herbal ingredients. Then, the targets are mapped to biological processes and diseases to build the herb-ingredient-target-disease network. Finally, the association network is used to help understand the molecular mechanism of herbal treatment [1–3]. Till now, there have been some online databases to take on this task, such as SYMMAP [4], BATMAN-TCM [5], HIT [6], TCMID [7] and TCMSP [8]. Network pharmacology-based methods organize current knowledge by integrating different types of data including drugs, targets and diseases, allowing researchers to rapidly decode the complexity of herbal medicine within the context of systems-level interactions [9, 10]. However, the key step of this methodology is based on the construction of herbal ingredient-target interactions, which is severely affected by the quantity and quality of the herbal composition, and the potency of the compound-target predicting algorithm.
Herbs are mixtures of chemical compounds, of which, a fraction are active and hit multiple biological targets. Their complexity embodies many aspects, such as the enormous ingredient quantity, content differences, active ingredient identification and cooperative effects between ingredients [11, 12]. Even we only focus on the chemical ingredients, there is still a considerable discrepancy between herbs, which might be attributed to the species and genus variation or the distinct herbal component research situations. This composition difference inevitably leads to a gap in the results of subsequent network pharmacology analysis. In addition, a chemo-centric approach for predicting compound-target interactions is to compare the similarity among the chemistry of compounds and their protein targets. The motivating principle is that two similar molecules will bind to a similar group of proteins. Whereas this principle can be violated in specific cases—a small change in chemical structure can dramatically change binding affinity. These situations are more prominent in the target prediction of herbal medicine, as herbs with multiple components will predict more redundant targets, making researchers difficult to concentrate on pharmacologically related targets. For example, when we predict the protein targets for an herbal ingredient phillyrin from the famous herb Forsythia suspensa (Thunb.) Vahl by a delicate drug-target prediction algorithm Similarity Ensemble Approach (http://sea.bkslab.org/) [13], 82 candidate targets can be obtained for phillyrin with a stringent threshold (P-value ≤ 1.00e-16). If we predicted the targets for all 251 known ingredients from Forsythia suspense in the SYMMAP database (http://www.symmap.org/detail/SMHB00241), hundreds of targets can be obtained even considering the overlapping targets among different compounds. Researchers have to make arbitrary judgments dependent on prior knowledge, leading to a suboptimal result in the follow-up analysis.
We consider that there should be some alternative approaches to untangle the complexity of herbal medicine by requisitioning their existing biological features. Among them, gene-expression profiles are naturally suited to capture unbiased, large-scale readouts from complex systems [14]. Actually, expression profile-based methods have been widely used for evaluating the therapeutic efficacy and molecular actions of drugs, both in modern and herbal medicine [15]. The prime example is the method based on the connectivity map (CMap), which is the largest pharmacotranscriptomic database, including transcriptomic-level perturbation datasets for thousands of well-annotated small molecules [16]. CMap-based methods use transcriptional profiles as signatures of a given drug, pathway or disease to build ‘connections’ between them, and have helped researchers find potential drugs for some diseases. For example, Chen et al. [17] discovered hyperforin, a phytochemical compound, promoting adipose tissue thermogenesis to suppress obesity by the CMap approach. Liu et al. [18] identified celastrol, which acts as a leptin sensitizer to treat obesity. Similarly, CMap-based methods have been applied for exploring the molecular mechanism of herbal medicine. For example, we have detected the mechanism of a herbal formula Qishenkeli for treating heart failure by applying the CMap-based methods on the transcriptome data of Qishenkeli, and found some effective components including salvianolic acid A, luteolin, cryptotanshinone, glycyrrhizin A and glycyrrhetinic acid, and their corresponding pharmacological targets, CACNA1C (Voltage-dependent L-type calcium channel subunit alpha-1C), ACE2 (Angiotensin-converting enzyme 2), COX2 (Prostaglandin G/H synthase 2) and PPARA (Peroxisome proliferator-activated receptor alpha) [19]. Moreover, a high-throughput experiment- and reference-guided database of traditional Chinese medicine (HERB) has recently been developed to analyze the gene expression of herbal medicine. HERB summarized transcriptomic data of 20 herbs and 152 ingredients, and mapped them to the CMap tool [20]. However, the utilization of HERB is limited by the insufficient data set for herbal pharmacotranscriptomics. There is a clear need for constructing a customized real-time and effective analysis platform for herbal medicine.
Here we developed an online transcriptome-based multi-scale network pharmacology platform (TMNP) for exploring the global effect of herbal medicine (Figure 1). Firstly, it is conceived to build-specific functional gene signatures for different biological scales from molecular to higher tissue levels. The commonly used pathway and GO terms can simply be regarded as the signatures of molecular function modules. Similarly, we have established a curriculum of gene signatures for target genes, pathological processes, cells, tissues and diseases. Based on this knowledge, TMNP uses pharmacotranscriptomics of herbal medicine as input and builds associations between herbs and biological scales to explore the multi-scale effects of herb medicine. We applied TMNP to a single herb Astragalus membranaceus and Xuesaitong injection to demonstrate the power of TMNP to reveal the multi-scale effects of herbal medicine. TMNP that integrates herbal medicine and multiple biological scales into the same framework for multi-scale association analysis, will greatly extend the conventional network pharmacology model centering on the chemical components, and provide a window for systematically observing the complex interactions between herbal medicine and the human body.
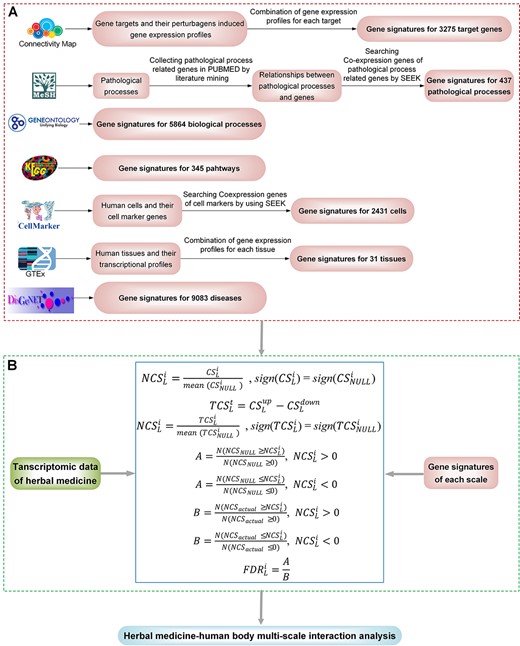
Scheme of the TMNP. (A) The curated gene signatures for seven biological scales including target genes, biological processes, pathways, pathological processes, cells, tissues and diseases. (B) Algorithms for multi-scale association analysis between query transcriptional profiles and multi-scale gene signatures.
Materials and Methods
TMNP contains two core modules: (1) gene signatures curated for multiple biological scales including target gene, biological process, pathway, pathological process, cell, tissue and disease (Figure 1A); (2) algorithms for multi-scale association analysis between query transcriptional profiles and multi-scale gene signatures (Figure 1B). The construction of gene signatures and the analysis algorithms are exhaustively detailed in the Supplementary text.
Results
SCHEME of TMNP
There are four major sections on the TMNP website, including ‘Homepage,’ ‘Data submission,’ ‘Results’ and ‘User Guide’ (Figure 2). Users upload types of gene expression data for herbs in the ‘Data submission’ page, such as the transcriptional profiles induced by a single herb, herbal formula and its component herbs, or an herbal drug and its corresponding disease model. Then, TMNP performs association analyses against a function scale or all scales appointed by users. Finally, the table results of each scale and the corresponding plots are easily reviewed on the ‘Results’ page. The ‘User Guide’ page details the procedure and the principle of the algorithm embedded in the TMNP and offers some cases.
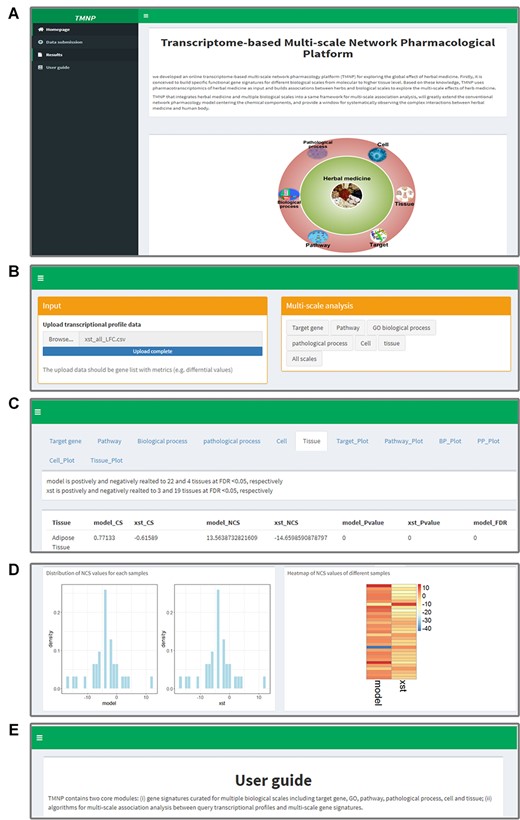
An illustration of the TMNP website. (A) The ‘Homepage’ of TMNP shows the overview. (B) The ‘Data submission’ page for uploading the query gene expression data. (C) The detailed result data of the multi-scale association analysis in the ‘Results’ page. (D) The further plotting of the result data in the ‘Results’ page. (E) The ‘User Guide’ page details the procedure and the principle of the algorithm embedded in the TMNP, and also offers two cases.
Application of TMNP
The basic aim of TMNP is to explore the multi-scale effects of herbal medicine by measuring the associations between gene-expression profiles induced by herbs and the catalog of multi-scale gene signatures. Therefore, the primary input of TMNP is a gene expression profile induced by an herbal drug, which may be a single herb or an herbal formula. The expression profile is ordered in a ranked list, according to some metrics (e.g., the differential expression values between the herb-treated and control samples). Then, TMNP calculates the correlation scores that reflect the correlation between the herbal gene list and the multi-scale signatures. Based on the types of signatures, the association analyses were divided into two categories: signatures with one gene set, and signatures with a ranked gene list. Signatures with one gene set are those at the scales of biological process, pathway, pathological process, cell and disease. The correlation scores (CS) of the herbal gene list against these signatures were measured using the same method as the Gene Set Enrichment Analysis approach [21]. Signatures with a ranked gene list are those at the levels of target gene and human tissue. We could extract two gene sets including a top gene set and a bottom one from the gene signatures as the signature specific gene module pair. We then calculated the total CS (TCS) for the herbal gene list against these module pairs. Moreover, to allow for the comparison of scores across multiple signatures without size bias, a normalized CS (NCS) is calculated by normalizing the CS/TCS for each signature to account for the size of the signature (See more details in Supplementary text). The significance of both scores is assessed by comparing them with a null distribution of scores computed by random permutations of the query gene list. For the CS/TCS, we randomly permute the query gene list 1000 times and recalculated the CS/TCS for the corresponding signature, yielding a null distribution of the CS/TCS. Then, the nominal P-value of the real CS/TCS is calculated relative to the distribution. For the NCS, we calculate the false discovery rate (FDR), which is the estimated probability that the NCS represents a false-positive finding. The FDR is adjusted for the signature size and multiple hypotheses testing.
On the TMNP website, the above procedures are performed automatically on the server and all results can be easily obtained on the ‘Results’ page (Figure 2). For each biological level, the results show: (1) the number of gene signatures significantly enriched in the query gene list (FDR ≤ 0.05); (2) a detailed result table that provides information of all signatures in the scale and their association scores with the query gene list including CS and NCS, as well as the corresponding significance indicated by a nominal P-value and an FDR; (3) the distribution of NCS values for the scale; (4) a heatmap that displays all signatures with their NCS. These results may generate interesting clues and drive further research of the multi-scale interactions between herbs and the human body.
In addition, TMNP supports multiple queries of gene-expression profiles for comparison/combinational analyses. In this case, we can compare different compositive herbs of formula and deconvolute their combinational effects from a multi-scale level. And this function can also be used to compare the effects between herbs and diseases by the input of their transcriptional data. When users input multiple queries, except the four outputs mentioned above, a bar graph is produced for summarizing the number of all significant signatures and the number of signatures with positive or negative scores. And a correlation analysis is performed to evaluate the correlation between different queries.
Use Case
Analysis of a single herb Astragalus membranaceus in TMNP
Astragalus membranaceus Bge. var. mongolicus (Bge.) Hsiao (AM in short; Huang Qi in Chinese), a traditional Chinese medicine, is one of the common herbs widely used in South and East Asia. AM was reported to possess anti-inflammation, anti-oxidation, anti-diuretic, antitumor, antiperspirant and immunopotentiative effects [22, 23]. However, the knowledge about the global effects of AM is limited. We here use AM as an example to demonstrate the usage of TMNP for the exploration of the multi-scale effects of a single herb. We collected AM-induced transcriptional data from the microarray experiment deposited in GEO (GSE accession: GSE70772), which detects expression genes from colon cancer cell HCT116 mouse xenograft and includes two groups of control and AM-treated (Supplementary Table S1).
Following the instruction of TMNP, the differential profile of AM was submitted to TMNP and connected to the multi-scale signatures. AM was associated to 2292 targets, 62 pathways, 610 biological processes, 227 pathological processes, 2004 cells and 12 tissues (FDR < 0.05; Figure 3A; Supplementary Table S2). AM could significantly regulate a large number of signatures on each scale. This is reasonable considering the multi-target and multi-function features of herbal medicine. As it is hard to cover all facets of the multi-scale effects of AM in the actual analysis, we focused on the top signatures with large NCS values. For each scale, the distribution of NCS was displayed and we can observe that AM has distinct impacts on positive and negative parts of these biological scales. Out of the 12 significantly related tissues, AM positively regulated ‘Blood’ and ‘Bone marrow’ with NCS of 5.87 and 4.59, followed by ‘Spleen’ (NCS = 4.36), ‘Kidney’ (NCS = 3.95), ‘Brain’ (NCS = 3.89) and ‘Liver’ (NCS = 3.79), suggesting AM strongly enhances the function of these tissues, especially ‘Blood’ and ‘Bone marrow’ (Table 1). This is in agreement with the traditional use of AM as a tonic to enhance the body’s natural defense mechanisms and also the pharmacological action of AM on bone marrow-derived cells [24, 25].
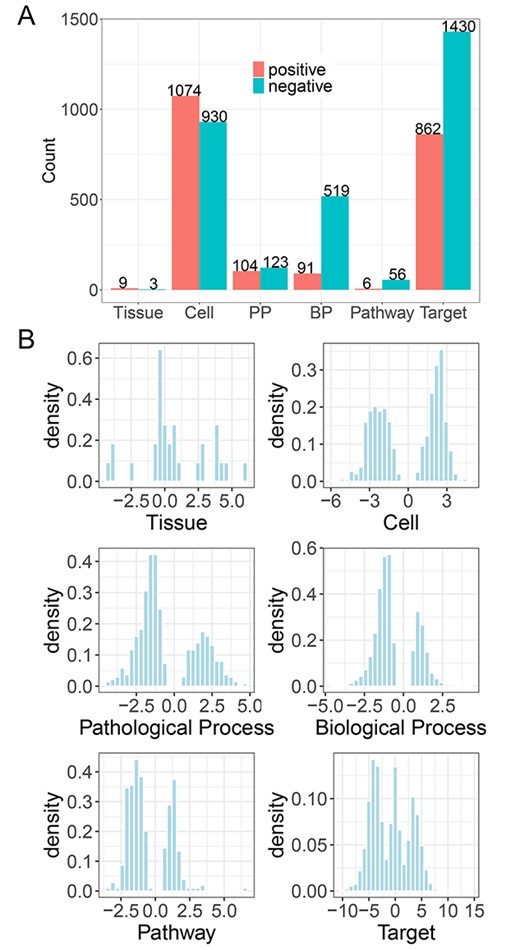
Analysis of a single herb A. membranaceus in TMNP. (A) The number of the significantly associated gene signatures on each scale by A. membranaceus (FDR < 0.05). A. membranaceus can relate different signatures positively (NCS > 0) and negatively (NCS < 0). (B) The distribution of NCS values on each scale. NCS: normalized correlation score.
The top related signatures for A. membranaceus on each scale
| Scale name | Signature description | CS/TCS | NCS | P-value | FDR |
|---|---|---|---|---|---|
| Tissue | Blood | 0.36 | 5.87 | 0.00 | 0.00 |
| Bone marrow | 0.34 | 4.59 | 0.00 | 0.00 | |
| Brain | 0.27 | 3.89 | 0.00 | 0.00 | |
| Fallopian tube | −0.28 | −4.34 | 0.00 | 0.00 | |
| Kidney | 0.26 | 3.95 | 0.00 | 0.00 | |
| Liver | 0.27 | 3.79 | 0.00 | 0.00 | |
| Spleen | 0.30 | 4.37 | 0.00 | 0.00 | |
| Bladder | −0.26 | −3.90 | 0.00 | 0.00 | |
| Thyroid | −0.25 | −3.97 | 0.00 | 0.00 | |
| Adipose tissue | 0.19 | 2.77 | 0.00 | 0.01 | |
| Testis | 0.18 | 2.66 | 0.01 | 0.02 | |
| Skin | 0.18 | 2.54 | 0.01 | 0.02 | |
| Cell | Epithelial cell | −0.34 | −6.04 | 0.00 | 0.00 |
| Hepatocyte | −0.22 | −5.72 | 0.00 | 0.00 | |
| Pathological process | Purpura, hyperglobulinemic | 0.24 | 4.67 | 0.00 | 0.00 |
| Purpura fulminans | 0.24 | 4.18 | 0.00 | 0.00 | |
| Yellow Nail syndrome | 0.23 | 4.17 | 0.00 | 0.00 | |
| Waterhouse-Friderichsen syndrome | 0.22 | 3.85 | 0.00 | 0.00 | |
| Pathway | Ribosome | 0.56 | 6.44 | 0.00 | 0.00 |
| Thyroid hormone signaling pathway | −0.29 | −3.52 | 0.00 | 0.00 | |
| Proteasome | 0.42 | 3.29 | 0.00 | 0.00 | |
| Olfactory transduction | 0.16 | 3.28 | 0.00 | 0.00 | |
| Adherens junction | −0.33 | −3.20 | 0.00 | 0.00 | |
| Neuroactive ligand–receptor interaction | 0.15 | 3.18 | 0.00 | 0.00 | |
| Focal adhesion | −0.19 | −2.98 | 0.00 | 0.00 | |
| Proteoglycans in cancer | −0.19 | −2.93 | 0.00 | 0.00 | |
| Coronavirus disease – COVID-19 | 0.17 | 2.78 | 0.00 | 0.00 | |
| Herpes simplex virus 1 infection | −0.11 | −2.70 | 0.00 | 0.00 | |
| Biological process | Negative regulation of nucleobase-containing compound metabolic process | −0.13 | −4.67 | 0.00 | 0.00 |
| Chromatin organization | −0.17 | −4.54 | 0.00 | 0.00 | |
| Negative regulation of RNA metabolic process | −0.12 | −4.30 | 0.00 | 0.00 | |
| Cell morphogenesis | −0.14 | −4.30 | 0.00 | 0.00 | |
| Histone modification | −0.19 | −4.19 | 0.00 | 0.00 | |
| Positive regulation of transcription by RNA polymerase II | −0.13 | −4.15 | 0.00 | 0.00 | |
| Regulation of small GTPase-mediated signal transduction | −0.21 | −4.15 | 0.00 | 0.00 | |
| Negative regulation of RNA biosynthetic process | −0.12 | −4.15 | 0.00 | 0.00 | |
| Covalent chromatin modification | −0.19 | −4.12 | 0.00 | 0.00 | |
| SRP-dependent cotranslational protein targeting to membrane | 0.37 | 4.10 | 0.00 | 0.00 | |
| Target | ADH1C | 0.97 | 14.15 | 0.00 | 0.00 |
| MTERFD1 | 0.97 | 13.86 | 0.00 | 0.00 | |
| PPP1CC | −0.66 | −10.42 | 0.00 | 0.00 | |
| CANT1 | 0.68 | 10.15 | 0.00 | 0.00 | |
| PLK3 | −0.66 | −9.85 | 0.00 | 0.00 | |
| PLK1 | −0.64 | −9.32 | 0.00 | 0.00 | |
| PPP1CA | −0.66 | −9.23 | 0.00 | 0.00 | |
| PPP2CA | −0.62 | −9.15 | 0.00 | 0.00 | |
| ATM | −0.64 | −8.87 | 0.00 | 0.00 | |
| BTG2 | −0.62 | −8.85 | 0.00 | 0.00 |
Correspondingly, we focused on the top regulated signatures on the cell scale and found that AM is most related to epithelial cell (NCS = –6.04), which is uniquely positioned at the interface and is the prime protective barrier of the human body [26]. Similarly, the second most associated is hepatocyte (NCS = –5.72), which is a specialized epithelial cell as the main cell type of the liver and is involved in a number of vital functions, including protein synthesis, detoxification and metabolism of lipids and carbohydrates. Although these cells only represent a part of cells regulated by AM, This result suggests the enhancement of AM on the human body, well consistent with the analysis of the tissue scale. Furthermore, we inspected the pathological processes, pathways and biological processes significantly regulated by AM. We get a similar conclusion from the three scales (Table 1). For example, the top four pathological processes are associated with hemorrhage and inflammatory immune response, including ‘Purpura, Hyperglobulinemic’ (NCS = 4.67), ‘Purpura Fulminans’ (NCS = 4.18), ‘Yellow Nail Syndrome’ (NCS = 4.17) and ‘Waterhouse-Friderichsen Syndrome’ (NCS = 3.85). In the pathway scale, AM is significantly related to the ‘thyroid hormone signaling pathway’ with the most negative NCS value (NCS = –3.52), which is essential for the animal’s growth, development and energy metabolism, and pathways related to virus infection, including ‘Coronavirus disease – COVID-19’ (NCS = 2.78) and ‘Herpes simplex virus 1 infection’ (NCS = –2.7). The top biological processes are mostly related to the basic transcription and translation functions. Finally, we tried to explore potential targets of AM and found that the top targets linked to AM treatment mostly participate in cell proliferation (Table 1). For example, out of the top 10 targets, MTERFD1 (Transcription termination factor 3, mitochondrial; NCS = 13.87) binds promoter and regulates mitochondrial transcription and translation [27]. PPP1CC (Serine/threonine-protein phosphatase PP1-gamma catalytic subunit; NCS = −10.42), PPP1CA (Serine/threonine-protein phosphatase PP1-alpha catalytic subunit; NCS = −9.23) and PPP2CA (Serine/threonine-protein phosphatase 2A catalytic subunit alpha isoform; NCS = −9.15) are protein phosphatases that regulate many cellular processes, including cell division. CANT1 (Soluble calcium-activated nucleotidase 1; NCS = 10.15) functions as a calcium-dependent nucleotidase with a preference for UDP. PLK3 (Serine/threonine-protein kinase PLK3; NCS = −9.85) and PLK1 (Serine/threonine-protein kinase PLK1; NCS = −9.32) are Polo-like kinases and are important regulators of cell cycle progression. ATM (Serine-protein kinase ATM; NCS = −8.87) belongs to the PI3/PI4-kinase family and is an important cell cycle checkpoint kinase. BTG2 (Protein BTG2; NCS = −8.85) is a member of the BTG/Tob family and is involved in the regulation of the G1/S transition of the cell cycle.
In summary, we took AM as an example to show the functions of TMNP to explore the multi-scale effects of a single herb and found AM can impact multiple signatures in all scales. This is consistent with the multi-functional feature of herb medicine. More important, an inspection of the top signatures regulated by AM indicates the main function of AM is to enhance the hematopoietic and immune systems, in agreement with the traditional use of AM as a tonic to enhance the body’s natural defense mechanisms.
Multi-scale analysis of Xuesaitong injection against stroke
This section displays the application of TMNP on multiple queries of gene-expression profiles for comparative analyses. As an example, the multi-scale effects of Xuesaitong injection (XST) against ischemic stroke were explored in TMNP based on the transcriptional data induced by the cerebral ischemia–reperfusion injury (Model) and the XST treatment. XST is a standardized patent Chinese medicine of Panax notoginseng roots (Sanqi in Chinese) and has long been used for the prevention of stroke in China [28]. Their transcriptional data were obtained from the microarray experiment deposited in GEO (GSE accession: GSE61616) (Supplementary Table S1) and were submitted to the TMNP website.
Based on the multi-scale analysis, we found that the disease model was linked to 2058 target genes, 176 pathways, 2081 biological processes, 334 pathological processes, 2250 cells and 27 tissues. And XST treatment could significantly impact a similar amount of signatures in each scale (FDR < 0.05; Figure 4A; Supplementary Table S3). Interestingly, on the whole, the disease and XST have inverse regulations for all signatures. This can be observed more clearly in the heatmap of NCS values, in which the disease-regulated signatures are mostly reversed by XST in each scale (Figure 4B; Supplementary Figure S1). The result is desirable as it implies XST reverses the most effects of the disease model. To quantify the multi-scale relationships between the disease and XST, we calculated the Pearson correlation of all NCS values for each scale and found that the two groups have correlations of −0.94, −0.84, −0.79, −0.92, –0.95 and −0.95 on the target, pathological process, pathway, biological process, cell and tissue scales, respectively (Figure 4C). This fact proves that XST definitely reverses the effects of the disease, consistent with its therapeutic ability for the stroke in the clinic [29].
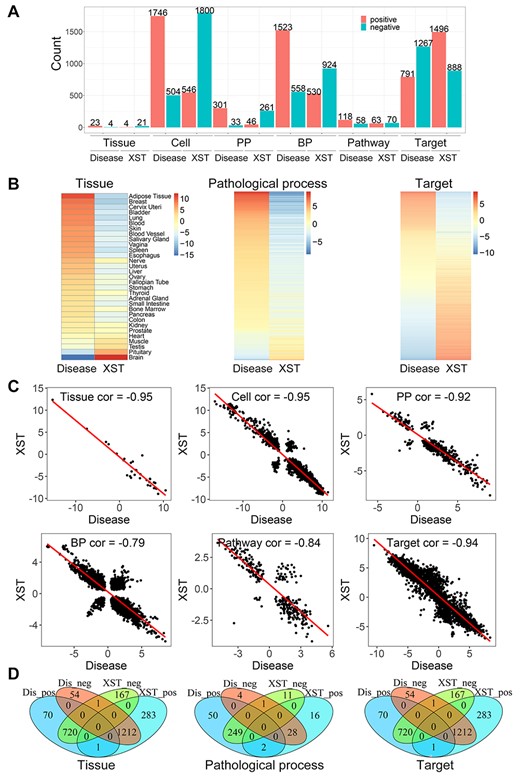
Multi-scale analysis of Xuesaitong injection against stroke in TMNP. (A) The number of the significantly associated gene signatures on each scale by Xuesaitong and disease model (FDR < 0.05). They can relate to different signatures positively (NCS > 0) and negatively (NCS < 0). (B) The heatmap of NCS values on each scale for Xuesaitong and disease model. Only three scales are shown and other heatmaps can be found in Supplementary Figure S1. (C) The correlation of NCS values on each scale between Xuesaitong and disease model. (D) The Venn diagram for the significantly associated gene signatures on each scale by Xuesaitong and disease model. Dis_neg indicates those signatures negatively related to the disease model. Dis_pos indicates those signatures positively related to the disease model. XST_neg indicates those signatures negatively related to Xuesaitong. XST_pos indicates those signatures positively related to Xuesaitong. Only three scales are shown and other diagrams can be found in Supplementary Figure S2. NCS: normalized correlation score.
Moreover, we compared the detailed signatures that are significantly influenced by the disease model and XST. In the tissue scale, out of the 27 signatures regulated by the disease, 24 (~89%) can be significantly reversed by XST (Figure 4D; Supplementary Figure S2). And as expected, the impact is greatest in the pathological site, brain, with NCS of −15.27 and 12.35 for the disease and XST, respectively (Table 2). Then, we investigated which cells XST regulates to treat the disease. Out of the 2250 cell signatures regulated by the disease, 2134 (~95%) can be significantly reversed by XST (Supplementary Figure S2). We mainly focused on the top signatures and found that both the top negatively and positively disease regulated signatures can be reversed by XST. The main types of cells include neurons, lymphoid cells, microglial cells and macrophages (Table 2). This is reasonable as a neuron is the main functional cell of the brain and the other cells mostly repair the cerebral ischemia–reperfusion injury.
The top related signatures for Xuesaitong injection and stroke model on each scale
| Scale name | Signature description | Model CS/TCS | XST CS/TCS | Model NCS | XST NCS | Model P-value | XST P-value | Model FDR | XST FDR |
|---|---|---|---|---|---|---|---|---|---|
| Tissue | Brain | −1.08 | 0.91 | −15.27 | 12.35 | 0.00 | 0.00 | 0.00 | 0.00 |
| Cell | Microglial cell | 0.49 | −0.36 | 11.45 | −8.42 | 0.00 | 0.00 | 0.00 | 0.00 |
| Macrophage | 0.65 | −0.55 | 10.20 | −8.35 | 0.00 | 0.00 | 0.00 | 0.00 | |
| Lymphoid cell | −0.56 | 0.47 | −13.84 | 11.26 | 0.00 | 0.00 | 0.00 | 0.00 | |
| Neuron | −0.65 | 0.45 | −14.63 | 10.53 | 0.00 | 0.00 | 0.00 | 0.00 | |
| Pathological process | Necrobiotic xanthogranuloma | 0.55 | −0.52 | 9.06 | −8.45 | 0.00 | 0.00 | 0.00 | 0.00 |
| Visceral prolapse | 0.46 | −0.36 | 8.67 | −6.69 | 0.00 | 0.00 | 0.00 | 0.00 | |
| Inflammation | 0.16 | −0.12 | 8.67 | −6.36 | 0.00 | 0.00 | 0.00 | 0.00 | |
| Nephrogenic fibrosing dermopathy | 0.55 | −0.45 | 8.40 | −7.21 | 0.00 | 0.00 | 0.00 | 0.00 | |
| Serositis | 0.51 | −0.39 | 8.19 | −6.19 | 0.00 | 0.00 | 0.00 | 0.00 | |
| Granuloma, plasma cell | 0.52 | −0.47 | 8.11 | −7.61 | 0.00 | 0.00 | 0.00 | 0.00 | |
| Uterine prolapse | 0.45 | −0.37 | 8.06 | −6.51 | 0.00 | 0.00 | 0.00 | 0.00 | |
| Bisphosphonate-associated osteonecrosis of the jaw | 0.41 | −0.33 | 7.94 | −6.64 | 0.00 | 0.00 | 0.00 | 0.00 | |
| Granuloma, respiratory tract | 0.41 | −0.32 | 7.61 | −5.87 | 0.00 | 0.00 | 0.00 | 0.00 | |
| Granuloma annulare | 0.49 | −0.45 | 7.52 | −6.97 | 0.00 | 0.00 | 0.00 | 0.00 | |
| Pathway | Coronavirus disease – COVID-19 | 0.39 | −0.21 | 5.61 | −2.96 | 0.00 | 0.00 | 0.00 | 0.00 |
| Glutamatergic synapse | −0.42 | 0.31 | −4.95 | 3.65 | 0.00 | 0.00 | 0.00 | 0.00 | |
| Circadian entrainment | −0.39 | 0.33 | −4.25 | 3.47 | 0.00 | 0.00 | 0.00 | 0.00 | |
| Neuroactive ligand–receptor interaction | −0.22 | 0.16 | −4.19 | 3.16 | 0.00 | 0.00 | 0.00 | 0.00 | |
| Ribosome | 0.36 | −0.38 | 4.07 | −4.18 | 0.00 | 0.00 | 0.00 | 0.00 | |
| Cytokine–cytokine receptor interaction | 0.25 | −0.19 | 4.05 | −2.96 | 0.00 | 0.00 | 0.00 | 0.00 | |
| NF-kappa B signaling pathway | 0.36 | −0.19 | 3.91 | −2.01 | 0.00 | 0.00 | 0.00 | 0.02 | |
| NOD-like receptor signaling pathway | 0.30 | −0.14 | 3.88 | −1.81 | 0.00 | 0.01 | 0.00 | 0.04 | |
| Measles | 0.32 | −0.15 | 3.88 | −1.80 | 0.00 | 0.03 | 0.00 | 0.04 | |
| Cholinergic synapse | −0.32 | 0.25 | −3.76 | 2.94 | 0.00 | 0.00 | 0.00 | 0.00 | |
| Biological process | Synaptic signaling | −0.36 | 0.25 | −8.97 | 6.00 | 0.00 | 0.00 | 0.00 | 0.00 |
| Chemical synaptic transmission | −0.37 | 0.25 | −8.90 | 5.92 | 0.00 | 0.00 | 0.00 | 0.00 | |
| Anterograde trans-synaptic signaling | −0.37 | 0.25 | −8.86 | 6.05 | 0.00 | 0.00 | 0.00 | 0.00 | |
| Trans-synaptic signaling | −0.36 | 0.25 | −8.75 | 5.92 | 0.00 | 0.00 | 0.00 | 0.00 | |
| Cell activation | 0.27 | −0.20 | 8.50 | −6.07 | 0.00 | 0.00 | 0.00 | 0.00 | |
| Immune effector process | 0.28 | −0.17 | 8.27 | −5.02 | 0.00 | 0.00 | 0.00 | 0.00 | |
| Leukocyte activation | 0.27 | −0.19 | 8.08 | −5.79 | 0.00 | 0.00 | 0.00 | 0.00 | |
| myeloid leukocyte activation | 0.31 | −0.22 | 7.56 | −5.48 | 0.00 | 0.00 | 0.00 | 0.00 | |
| Leukocyte-mediated immunity | 0.29 | −0.21 | 7.47 | −5.44 | 0.00 | 0.00 | 0.00 | 0.00 | |
| Response to cytokine | 0.26 | −0.11 | 7.31 | −3.20 | 0.00 | 0.00 | 0.00 | 0.00 | |
| Target | NCOR2 | −0.74 | 0.63 | −10.48 | 8.85 | 0.00 | 0.00 | 0.00 | 0.01 |
| JOSD1 | −0.60 | 0.56 | −8.73 | 8.12 | 0.00 | 0.00 | 0.00 | 0.00 | |
| GDI1 | −0.60 | 0.54 | −8.46 | 7.29 | 0.00 | 0.00 | 0.00 | 0.00 | |
| E2F6 | 0.58 | −0.48 | 8.34 | −6.87 | 0.00 | 0.00 | 0.01 | 0.00 | |
| IQGAP1 | −0.61 | 0.52 | −8.29 | 7.68 | 0.00 | 0.00 | 0.00 | 0.00 | |
| LARS | −0.55 | 0.55 | −8.16 | 7.77 | 0.00 | 0.00 | 0.00 | 0.00 | |
| FAM69A | −0.56 | 0.41 | −8.15 | 6.00 | 0.00 | 0.00 | 0.00 | 0.00 | |
| ACO2 | −0.57 | 0.47 | −8.11 | 6.62 | 0.00 | 0.00 | 0.00 | 0.00 | |
| RNF186 | −0.59 | 0.55 | −8.09 | 7.65 | 0.00 | 0.00 | 0.00 | 0.00 | |
| HGS | −0.56 | 0.47 | −7.95 | 6.42 | 0.00 | 0.00 | 0.00 | 0.00 |
Similarly, we compared the pathological processes, pathways and biological processes between the disease model and XST treatment. Out of the 334 pathological process signatures regulated by the disease, 277 (~83%) can be significantly reversed by XST (Figure 4D; Supplementary Figure S2). Out of the 176 pathway signatures regulated by the disease, 113 (~64%) are significantly reversed by XST (Supplementary Figure S2). Out of the 2081 biological process signatures regulated by the disease, 1178 (~57%) are significantly reversed by XST (Supplementary Figure S2). And the top signatures reversed by XST are mostly associated to the immuno-inflammatory responses or nervous system function. For example, in the top 10 XST regulated pathological processes, there are kinds of granuloma, which is composed predominantly of macrophages and a few scattered lymphocytes (Table 2). The top 10 disease-related pathways that are significantly reversed by XST include nervous system pathways, such as ‘glutamatergic synapse,’ ‘cholinergic synapse’ and ‘neuroactive ligand–receptor interaction and biological processes,’ as well as immuno-inflammatory pathways, such as ‘cytokine–cytokine receptor interaction’, NF-kappa B signaling pathway and NOD-like receptor signaling pathway. This is similar to the biological processes (Table 2). Finally, we inspected the target scale and found out of the 2058 target signatures regulated by the disease, 1932 (~94%) are significantly reversed by XST (Figure 4D; Supplementary Figure S2). The disease most associated gene is nuclear receptor corepressor 2 (NCOR2) with NCS of −10.48, which is a member of a family of thyroid hormone- and retinoic acid receptor-associated co-repressors. Thyroid hormone treatment has been proved to protect the ischemia-induced brain injury, probably by its anti-apoptotic and anti-inflammatory mechanism [30]. In addition, we found that some genes are related to the phagocytosis of macrophages (Table 2). For example, Josephin-1 (JOSD1) is a membrane-targeted deubiquitinating enzyme and regulates membrane dynamics, cell motility and endocytosis [31]. IQGAP1 (Ras GTPase-activating-like protein IQGAP1) plays a crucial role in regulating the dynamics and assembly of the actin cytoskeleton and has been proved to be involved in post-ischemic neovascularization by regulating angiogenesis and macrophage infiltration [32]. GDI1 (Rab GDP dissociation inhibitor alpha) is involved in the vesicular trafficking of molecules between cellular organelles.
This section used two queries of gene-expression profiles from the stroke model and XST to explore the multi-scale effects of herbal medicine. We compared the two groups in all scales and found XST reverses most effects of the disease. And further analysis of the top signatures indicates that the regulation of macrophage function is pivotal for the treatment of XST, and provides plenty of clues for further mechanism study.
Discussion
Transcriptional responses induced by drug treatment are ideal biological signatures of drugs and have been used to discover drug targets, evaluate the therapeutic efficacy of drugs and reveal possible side effects. This methodology is quite suitable for studying the global effects of herbal medicine as transcriptomic analysis allows us to ignore the complexity of herbal medicine and directly explore its biological and pharmacological properties. Here, we built a bioinformatics analysis platform TMNP for multi-scale effects of herbal medicine based on the constructed gene signatures for different biological scales. TMNP uses pharmacotranscriptomics as input and builds associations between herbs and biological scales.
TMNP features several advantages. First, compared with the ‘herb to compound to target’ methods, TMNP uses the gene-expression profiles to avoid parsing the chemical complexity of herbal medicine. Second, except for the common gene signatures for functional modules (e.g., pathways and GO terms), TMNP contains customized gene signatures for other biological scales, including targets, pathological processes, cells, tissues and diseases. Third, TMNP enables the exploration of the multi-scale effects of herbal medicine by calculating gene correlation at the transcriptional level. Fourth, the number of input gene-expression profiles is unrestricted, and thus different types of input are allowed, such as the expression profiles induced by a single herb, herbal formula and its component herbs, or a herbal drug and its corresponding disease model.
Several other tools and databases have abilities to analyze the gene expression of herbal medicine. For example, HERB is a recent database that collects datasets of all available microarray and RNA-seq data for herbs and ingredients and mapped them to the new CMap tool [20]. However, the utilization of HERB is limited by the insufficient data set for herbal pharmacotranscriptomics. Now, transcriptomic data of only 20 herbs and 152 ingredients were curated in the database, which is far less than the coverage of herbal medicine. We have exhaustively collected existing herb-induced transcriptomic data for 40 herbs from the GEO database and embedded them into the TMNP website for multi-scale analysis. These data will be updated periodically. More importantly, TMNP provides an online analysis platform for customized data and is not restricted by the known data. In addition, the online CMap tool (https://clue.io/) accepts the input of the gene expression profile to measure the similarity between query drugs and the landmarked perturbagens in the CMap database [16]. The CMap-based methods have been applied for a wide range of herbal medicine studies in these years [15]. For example, Lv et al. [33] have sequenced the gene-expression profiles for 102 representative small molecules of TCM and mapped them to the drugs in the CMap dataset. However, the CMap-based methods must use the landmarked perturbagens as a medium to link the query drug and the potential biological functions. The resultant links are severely constrained by the knowledge of the landmarked perturbagens, and lack the multi-scale information of the perturbagens. TMNP solves this problem by manually constructing gene signatures of each biological scale from prior knowledge.
In summary, TMNP takes herbal medicine as a whole and uses the herb-induced transcriptional profiles to represent the biological activity of herbs, providing an effective way for studying the multi-scale connections of herbal medicine with the human body. However, there are still some limitations to this platform. First, herbs are a combination of chemical components, and it is still a top priority to understand the actions of the complicated composition of herbal medicine. Therefore, the next key step is to integrate the analysis of chemical ingredients of herbal medicine into TMNP. Second, the result of TMNP is affected by the quantity and quality of the signatures of biological scales. We have created an initial molecular signature dataset for different scales, including ones based on biological pathways, functional modules, pathological processes, cells, diseases, gene-expression responses induced by target genes and human tissues. In the future, we will enlarge the number of current signatures, for example, based on the L1000 dataset, signatures were built for 3275 target genes, which are a small part relative to the overall genome and can be improved. We will also expand new biological scales (e.g., gene signatures of symptoms). In addition, we encourage users to create customized gene signatures with a particular purpose and professional knowledge and combine the analysis results given by TMNP to make the most proper conclusion. To facilitate users to flexibly apply the algorithm for the customized transcriptomic data and gene signatures, except for the online TMNP website, we have submitted the R code to GitHub (https://github.com/lipi12q/TMNP).
Construction of specific gene signatures for target genes, pathological processes, cells, tissues and diseases
Avoiding the chemical complexity of herbal medicine, directly parsing the pharmacological functions of herbal medicine based on the gene-expression profiles
Establishment of a transcriptome-based multi-scale network pharmacology platform for detecting the global effects of herbal medicine on the human body
Funding
This work was supported by the National Natural Science Foundation of China (Nos 81703945, 31800678) and the Science and Technology Innovation Project of Colleges and Universities in Shanxi Province (Nos 2019 L0360, 2019 L0365).
Peng Li is an associate professor at the College of Basic Sciences, Shanxi Agricultural University. His research interests are bioinformatics, drug discovery, network pharmacology and artificial intelligence.
Haoran Zhang is a graduate student at the College of Basic Sciences, Shanxi Agricultural University. His research interests are bioinformatics and network pharmacology.
Wuxia Zhang is an associate professor at the College of Basic Sciences, Shanxi Agricultural University. Her research interests are drug discovery and pharmacology.
Yuanyuan Zhang is a graduate student at the College of Basic Sciences, Shanxi Agricultural University. His research interests are bioinformatics and chemoinformatics.
Lingmin Zhan is a graduate student at the College of Basic Sciences, Shanxi Agricultural University. His research interests are bioinformatics and chemoinformatics.
Ning Wang is a doctoral student at the School of Computer and Information Technology and Beijing Key Lab of Traffic Data Analysis and Mining, Beijing Jiaotong University. His research interests are biological modeling and simulation and machine learning.
Caiping Chen is an associate professor at the College of Basic Sciences, Shanxi Agricultural University. Her research interests are chemoinformatics and systems biology.
Bangze Fu is an associate professor at the School of Biomedicine, Beijing City University. His research interests are cardiovascular drug discovery and network pharmacology.
Jinzhong Zhao is a professor at the College of Basic Sciences, Shanxi Agricultural University. His research interests are medicinal chemistry and chemoinformatics.
Xuezhong Zhou is a professor at the School of Computer and Information Technology and Beijing Key Lab of Traffic Data Analysis and Mining, Beijing Jiaotong University. His research interests are biological modeling and simulation and machine learning.
Shuzhen Guo is a professor at the School of Traditional Chinese Medicine, Beijing University of Chinese Medicine. Her research interests are cardiovascular drug discovery and pharmacology.
Jianxin Chen is a professor at the School of Traditional Chinese Medicine, Beijing University of Chinese Medicine. His research interests are network pharmacology, machine learning and artificial intelligence.
References
Edelblum KL, Turner JR.
