


Abstract
Increasing evidences have proved that circRNA plays a significant role in the development of many diseases. In addition, many researches have shown that circRNA can be considered as the potential biomarker for clinical diagnosis and treatment of disease. Some computational methods have been proposed to predict circRNA-disease associations. However, the performance of these methods is limited as the sparsity of low-order interaction information. In this paper, we propose a new computational method (KGANCDA) to predict circRNA-disease associations based on knowledge graph attention network. The circRNA-disease knowledge graphs are constructed by collecting multiple relationship data among circRNA, disease, miRNA and lncRNA. Then, the knowledge graph attention network is designed to obtain embeddings of each entity by distinguishing the importance of information from neighbors. Besides the low-order neighbor information, it can also capture high-order neighbor information from multisource associations, which alleviates the problem of data sparsity. Finally, the multilayer perceptron is applied to predict the affinity score of circRNA-disease associations based on the embeddings of circRNA and disease. The experiment results show that KGANCDA outperforms than other state-of-the-art methods in 5-fold cross validation. Furthermore, the case study demonstrates that KGANCDA is an effective tool to predict potential circRNA-disease associations.
Introduction
CircRNA is a kind of single-strand circular non-coding RNA without 5′ and 3′ polyadenylated tails [1, 2]. It can be classified into four categories including exonic circRNAs [3], intronic circRNAs [4], exonintron circRNAs [5] and intergenic circRNAs [6]. The circRNA was first found as plant viroid by Sanger et al. [7] in 1976. However, it had been regarded as the ‘noise’ of genomic transcription for a long time. In recent years, with the development of high-throughput sequencing technology, it is discovered that circRNA can participate in many important biological processes such as the sponge of miRNA [8] and translation regulation [9]. Furthermore, increasing evidences have demonstrated that circRNA has a close association with various diseases [10–12]. For example, it has been found that the circCDYL can promote autophagic level in breast cancer cells by binding miR-1275-ATG7 axis [13]. In addition, it has been proved that the circSEPT9 can significantly suppress the proliferation, migration and invasion of triple negative breast cancer cells [14]. Therefore, identifying associations between circRNAs and diseases can help biologists understand disease pathology and further for disease diagnosis.
However, it is time-consuming and expensive to identify circRNA-disease associations by using traditional biological experiment. To address the problem, more and more computational methods have been proposed in recent years. These methods could be divided into three categories. The first category is based on information propagation in the network. Fan et al. [15] proposed a computational model based on KATZ to predict circRNA-disease associations. It constructed a heterogeneous network based on circRNA expression profiles, disease phenotype similarity and Gaussian interaction profile (GIP) kernel similarity. Then, the KATZ was used to predict similarity scores between circRNAs and diseases. Similar works were developed by Deng et al. [16] and Zhao et al. [17], they constructed heterogeneous networks using different kinds of biological data. Then, the improved KATZ was utilized to predict circRNA-disease associations. Hüseyin et al. [18] presented a computational method based on random walk with restart (RWR) to identify circRNA-disease associations. Similarly, Li et al. [19] introduced a new model (DWNCPCDA) based on deepwalk and network consistency projection to predict circRNA-disease associations. Ge et al. [20] designed a computational model to identify circRNA-disease associations based on locality-constrained linear coding (LLCDC). The second category is based on machine learning. Zhang et al. [21] presented a new method (MVMF) to identify associations between circRNAs and diseases based on metapath2vec++ and matrix factorization. It used metapath2vec++ to learn the embedded features and initial prediction score. Then, the matrix factorization was utilized to obtain the final prediction results. Wei et al. [22] proposed a computational method (iCircDA-MF) for circRNA-disease association prediction by using matrix factorization. It calculated the potential circRNA-disease association based on circRNA similarity and disease similarity. Furthermore, to correct the false negative associations, circRNA-disease interaction profiles were updated by neighbor interaction profiles. Finally, the matrix factorization was employed to predict the circRNA-disease associations based on the updated interaction profiles. Xiao et al. designed two computational models (MRLDC [23] and ICDA-CMG [24]) to predict circRNA-disease association by using low-rank approximation optimization algorithm and collective matrix completion, respectively. The third category is based on deep learning. Wang et al. [25] proposed a computational model to predict disease-related circRNA by combing multisource information with convolutional neural network (CNN). Similar work was developed by Fan et al. [26], they constructed a feature matrix by fusing multiple similarities and associations among circRNA, miRNA and disease. Then, the two-layer CNN was employed on the feature matrix to predict the novel circRNA-disease associations. To improve the accuracy of predicting circRNA-disease associations, Lu et al. [27] designed a model (CDASOR) to infer associations between circRNAs and diseases. It extracted features from sequence of circRNA and ontology representations of disease based on convolutional and recurrent neural networks, respectively. Although CNN can extract latent features effectively, it also requires the specific form of the data which may limit its application. Deepthi et al. [28] introduced an ensemble method (AE-RF) by combining a deep autoencoder and a random forest classifier to predict circRNA-disease associations. In the same way, Wang et al. [29] developed a new computational method (IMS-CDA) to infer potential circRNA-disease associations. They constructed feature vectors of each pair of circRNA and disease based on disease semantic similarity, the Jaccard similarity and GIP kernel similarity of circRNA and disease. Then, the stacked autoencoder was employed to extract hidden feature of the constructed feature, and the rotation forest classifies was used to compute the affinity scores of each pair of circRNA-disease association based on the extracted feature. Wang et al. [30] proposed a computational method (GCNCDA) to predict circRNA-disease associations based on graph convolutional network algorithm. These methods have achieved great successes in circRNA-disease association prediction. However, some methods identify potential circRNA-disease associations only based on sparse low-order interaction data. Therefore, the performance of these methods is limited as the sparse low-order data cannot provide enough neighbor information. For example, given a circRNA i, the most similar circRNA will be obtained in traditional methods. The affinity scores between circRNA i and the diseases related with most similar circRNA will be assigned higher values than other associations. However, it is hard to find similar circRNAs for circRNA i as the association data are always sparse.
In this paper, we propose a new computational framework (KGANCDA) based on Knowledge Graph Attention Network to identify Associations between CircRNAs and Diseases. In our model, two circRNA-disease knowledge graphs (cancer and non-cancer) are constructed by integrating different kinds of biological association information including circRNA, disease, lncRNA and miRNA. Then, the knowledge graph attention network is designed to obtain high quality embeddings of different kinds of entities by distinguishing the importance of information from neighbors. Besides low-order neighbor information, KGANCDA can also capture high-order neighbor information from multisource associations, which can address the problem of data sparsity. Further, a designed multilayer perceptron is utilized to predict the affinity score of circRNA-disease associations based on the embeddings of circRNA and disease. The experimental results demonstrate KGANCDA outperforms than other state-of-the-art models in term of 5-fold validation. Moreover, the case study shows that our algorithm is an effective tool for identifying potential circRNA-disease associations. The contributions are summarized as follows:
We collect multiple association data (circRNA, disease, lncRNA and miRNA) from several databases. Based on these association data, two knowledge graphs (cancer and non-cancer) are constructed.
A new framework (KGANCDA) is proposed in this paper. Besides low-order neighbor information, our method can capture high-order neighbor information from multisource neighbor information, which can alleviate the problem of data sparsity. To the best of our knowledge, this is the first work to apply knowledge graph attention network to predict circRNA-disease association. The codes of methods and datasets are uploaded at https://github.com/lanbiolab/KGANCDA for further research.
Materials and methods
Data collection
Two datasets are constructed by integrating different kinds of biological association information. In dataset1, the associations of circRNA-cancer, circRNA-miRNA and miRNA-cancer are downloaded from circR2Cancer database [31]. In addition, we collect the associations of lncRNA-miRNA and lncRNA-disease from lncRNASNP2 [32] and LncRNADisease [33], respectively. After removing duplicates, 514 circRNAs, 62 cancers, 564 miRNAs, 573 lncRNAs, 647 circRNA-cancer associations, 756 circRNA-miRNA associations, 1066 lncRNA-cancer associations, 308 lncRNA-miRNA associations and 732 miRNA-cancer associations are collected in dataset1. In dataset2, the associations between circRNA, disease (non-cancer) and miRNA are collected from circad database [34] and circRNADisease database [35]. Then, the associations of lncRNA-miRNA and lncRNA-disease from lncRNASNP2 [32] and LncRNADisease [33], respectively. In final, 330 circRNAs, 79 diseases, 245 miRNAs and 297 lncRNAs, 346 circRNA-disease associations, 146 circRNA-miRNA associations, 528 lncRNA-disease associations, 241 lncRNA-miRNA associations and 106 miRNA-disease associations are collected in dataset2. The brief information of the datasets is shown in Table 1 and the details of dataset1 and dataset2 are listed in the Supplementary Files S1 (https://github.com/lanbiolab/KGANCDA/blob/main/Additional%20Files) and S2 (https://github.com/lanbiolab/KGANCDA/blob/main/Additional%20Files), respectively. In addition, to show the sparsity of circRNA-disease associations of dataset1 and dataset2, the degree distribution of diseases is shown in Figures 1 and 2, respectively. It can be observed that the circRNA-disease associations are sparse in two datasets. Furthermore, the specific-related circRNAs of each disease are listed in Supplementary File S3 (https://github.com/lanbiolab/KGANCDA/blob/main/Additional%20Files).
The brief information of the datasets
| Dataset | circRNA | Disease | lncRNA | miRNA | circRNA-disease | circRNA-miRNA | miRNA-disease | lncRNA-disease | lncRNA-miRNA |
|---|---|---|---|---|---|---|---|---|---|
| Dataset1 | 514 | 62 | 573 | 564 | 647 | 756 | 732 | 1066 | 308 |
| Dataset2 | 330 | 79 | 297 | 245 | 346 | 146 | 106 | 528 | 241 |
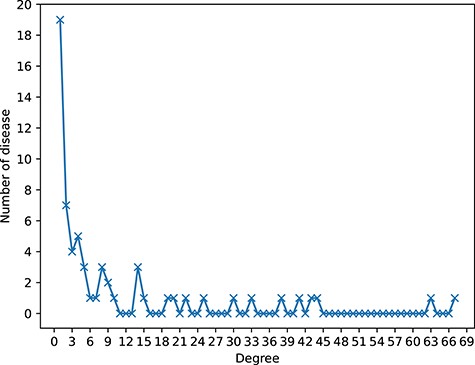
The sparsity of circRNA-disease associations of dataset1. The horizontal axis (Degree) represents the number of related circRNAs of each disease. The longitudinal axis (Number of disease) represents the number of diseases with corresponding degree. For example, there are 19 diseases that only have association with one circRNA.
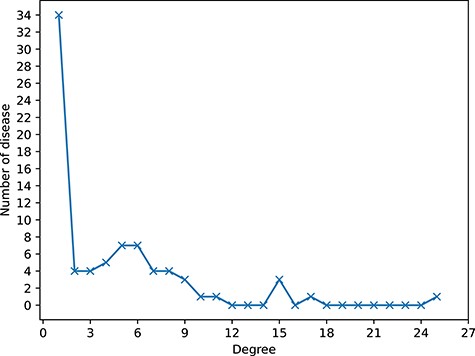
The sparsity of circRNA-disease associations of dataset2. The horizontal axis (Degree) represents the number of related circRNAs of each disease. The longitudinal axis (Number of disease) represents the number of diseases with corresponding degree. For example, there are 34 diseases that only have association with one circRNA.
Knowledge graph
As shown in Figure 3A, there are two sets: circRNA (C1, C2 and C3) and disease (D1, D2 and D3), which are represented as green circles and orange circles, respectively. Taking C1 as an example, C1 directly links to three disease nodes (D1, D2 and D3). Supposing that the association C1–D1 is the potential association that needs to be predicted. Based on the hypothesis that similar circRNAs tend to be related with similar diseases [27, 36, 37], many traditional methods may find that C2 and C3 are similar to C1. Because C2 and C3 are associated with D1, the prediction score of the association C1–D1 is higher than other candidate associations. However, as shown in Figure 3C, the association data are sparse in circRNA-disease association network and C1 is usually not similar with any circRNAs. Thus, the performance of these methods only based on low-level interaction information is limited. However, it can be found from Figure 4 that the knowledge graph of circRNA-disease contains more kinds of entities and associations. Besides the low-order association information, the embeddings of it will contain high-order neighbor information. Supposing that the C1–D1 is the potential association that needs to be predicted. It can be found that circRNA C1 is related with miRNA M1 and lncRNAs L1, and these nodes are related with the candidate disease D1. After repeatedly propagating in knowledge graph attention network, the embedding of circRNA C1 will contain neighbor information from miRNA, lncRNA, etc. Therefore, the method based on knowledge graph can effectively predict potential association C1–D1.
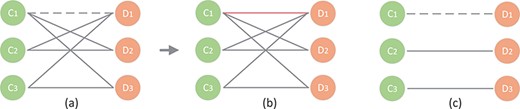
A toy example of traditional method.
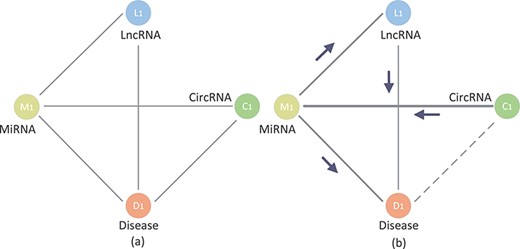
The example of circRNA-disease knowledge graph.
Graph attention network
Graph attention mechanism
Aggregation information from neighbors
Prediction and optimization
Multiple layer perceptron
Loss function
As shown in Figure 5, KGANCDA mainly contains three parts: dataset collection, circRNA-disease knowledge graph and graph attention neural network. Specifically, it collects multiple entities and relationships from public databases [31–35]. The new knowledge graph is constructed based on the collected datasets. Then, the graph neural network is designed to obtain the embeddings of each entity. After propagating in the graph attention neural network, the embeddings of each entity contain information from their multi-hop neighbors. Furthermore, the attention mechanism is utilized to improve the quality of the embeddings by aggregating information of each neighbor based on the importance of them. Furthermore, the designed multilayer perceptron is employed on the embeddings of each pair of circRNA-disease association and the prediction scores are obtained.
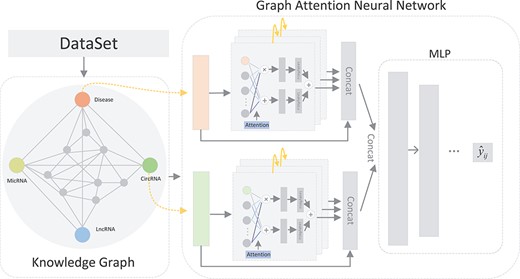
The flowchart of KGANCDA.
Experiments and results
Evaluation metrics
Five-fold cross validation
To verify the performance of KGANCDA, we compare it with six state-of-the-art models including RWR [18], DMFCDA [37], GCNCDA [30], KATZHCDA [15], DWNN-RLS [41] and CD-LNLP [42]. All models are compared in the same experiment settings, and the parameters of compared model are best parameters as they recommended. As shown in Figure 6, the AUC of KGANCDA achieves average value 0.8714 on dataset1, which is better than other six state-of-the-art methods on dataset1 (RWR: 0.7046, DMFCDA: 0.5715, GCNCDA: 0.7468, KATZHCDA: 0.6994, DWNN-RLS: 0.5797, CD-LNLP: 0.6933). The result of dataset2 is shown in Figure 7 that the AUC of KGANCDA achieves average value 0.8847, which outperforms the other methods (RWR: 0.8487, DMFCDA: 0.6001, GCNCDA: 0.7084, KATZHCDA: 0.7946, DWNN-RLS: 0.7674, CD-LNLP: 0.8034). As Figure 8 shows, it can be found that the average AUPR value of KGANCDA is 0.0907 on dataset1, which is superior to the other methods (RWR: 0.0086, DMFCDA: 0.0045, GCNCDA: 0.0095, KATZHCDA: 0.0122, DWNN-RLS: 0.0050, CD-LNLP: 0.0080). Moreover, it is shown in Figure 9 that the average AUPR of KGANCDA is 0.0237 on dataset2, which is better than the other methods (RWR: 0.0115, DMFCDA: 0.0032, GCNCDA: 0.0048, KATZHCDA: 0.0097, DWNN-RLS: 0.0069, CD-LNLP: 0.0088). Figures 10 and 11 show the number of correctly identified circRNA-disease associations in 5-fold cross validation on dataset1 and dataset2, respectively. As Figures 10 and 11 show, due to the sparsity of the circRNA-disease association, the performance of the other methods is limited. However, KGANCDA can identify more associations of circRNA-disease (67, 79, 90 pairs of associations identified successfully in top-10, top-20 and top-50 on dataset1 and 24, 29, 47 in top-10, top-20 and top-50 on dataset2, respectively). The reason may be that miRNAs and lncRNAs in knowledge graph can provide high-order neighbor information to the embeddings of circRNAs and diseases, which help to improve the performance of the model. The correctly predicted specific circRNA-disease associations of all methods are recorded in Supplementary Files S4 for dataset1 (https://github.com/lanbiolab/KGANCDA/blob/main/Additional%20Files) and S5 for dataset2 (https://github.com/lanbiolab/KGANCDA/blob/main/Additional%20Files). In addition, the values of other performance metrics are listed in Table 2 (including accuracy, precision, recall and F1_score, KGANCDA obtained 0.4943, 0.0154, 0.8731, 0.0272 on dataset1 and 0.4953, 0.0084, 0.8867, 0.0157 on dataset2, respectively.). These results indicate that KGANCDA outperforms other state-of-the-art methods.
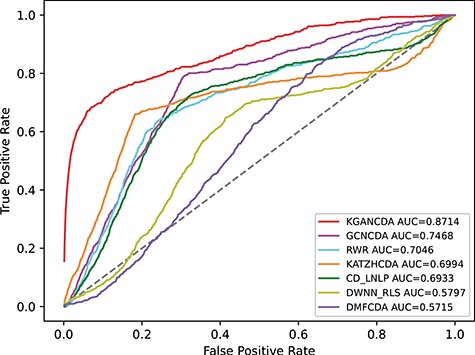
The performance comparison of KGANCDA, RWR, DMFCDA, GCNCDA, KATZHCDA, DWNN-RLS and CD-LNLP in term of AUC value on dataset1.
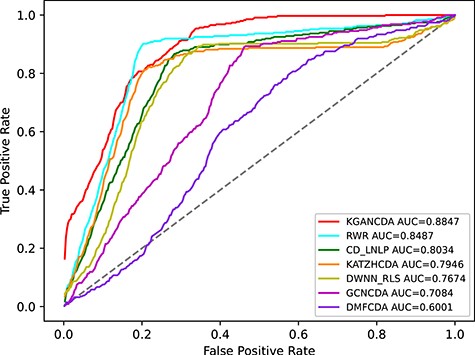
The performance comparison of KGANCDA, RWR, DMFCDA, GCNCDA, KATZHCDA, DWNN-RLS and CD-LNLP in term of AUC value on dataset2.
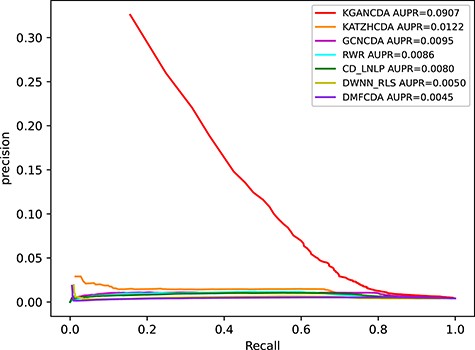
The performance comparison of KGANCDA, RWR, DMFCDA, GCNCDA, KATZHCDA, DWNN-RLS and CD-LNLP in term of AUPR value on dataset1.
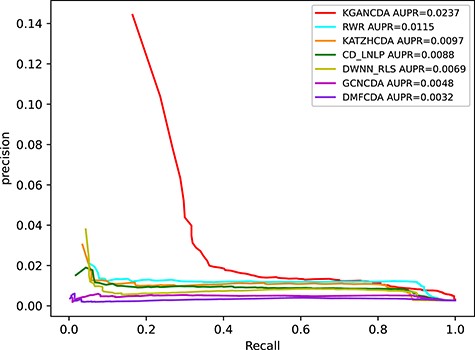
The performance comparison of KGANCDA, RWR, DMFCDA, GCNCDA, KATZHCDA, DWNN-RLS and CD-LNLP in term of AUPR value on dataset2.
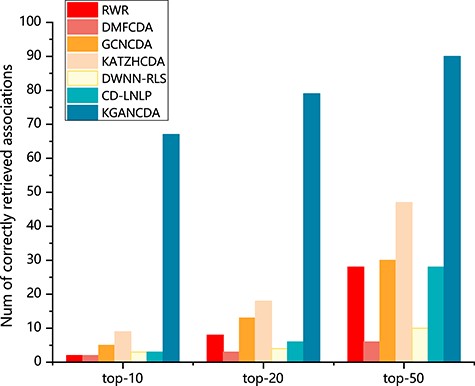
The number of correctly identified circRNA-disease associations of all methods on dataset 1 based on 5-fold cross validation.
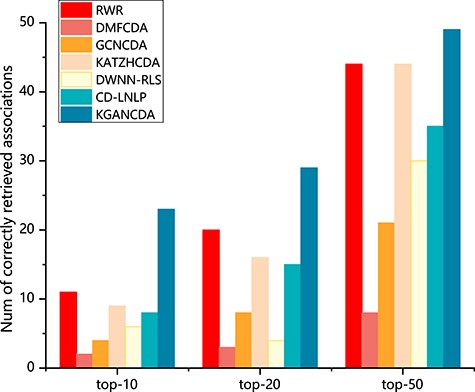
The number of correctly identified circRNA-disease associations of all methods on dataset 2 based on 5-fold cross validation.
Comparison of methods on two datasets based on 5-fold cross validation
| Methods | Acc | Pre | Rec | F1_score | |
|---|---|---|---|---|---|
| Dataset1 | RWR | 0.4929 | 0.0068 | 0.7094 | 0.0134 |
| DMFCDA | 0.4936 | 0.0044 | 0.5637 | 0.0085 | |
| GCNCDA | 0.4933 | 0.0074 | 0.7509 | 0.0144 | |
| KATZHCDA | 0.4929 | 0.0081 | 0.7041 | 0.0154 | |
| DWNN-RLS | 0.4919 | 0.0049 | 0.5870 | 0.0095 | |
| CD-LNLP | 0.4928 | 0.0066 | 0.6982 | 0.0130 | |
| KGANCDA | 0.4942 | 0.0151 | 0.8682 | 0.0267 | |
| Dataset2 | RWR | 0.4951 | 0.0066 | 0.8509 | 0.0127 |
| DMFCDA | 0.5040 | 0.0031 | 0.5953 | 0.0062 | |
| GCNCDA | 0.4944 | 0.0042 | 0.7125 | 0.0083 | |
| KATZHCDA | 0.4948 | 0.0060 | 0.7974 | 0.0117 | |
| DWNN-RLS | 0.4947 | 0.0053 | 0.7706 | 0.0103 | |
| CD-LNLP | 0.4949 | 0.0058 | 0.8062 | 0.0112 | |
| KGANCDA | 0.4953 | 0.0084 | 0.8867 | 0.0157 |
The effect of different components in KGANCDA
Ablation study
To validate the effectiveness of different modules (circRNA-disease knowledge graph and knowledge graph attention mechanism), we remove them in turn and analysis the effectiveness of them. We remove the knowledge graph and initialize embeddings randomly (named KGANCDA/−kg) and the attention mechanism (named KGANCDA/−att), respectively. The AUC and AUPR of different models are shown in Figures 12 and 13, respectively. We have following findings:
The performance of KGANCDA is superior to KGANCDA/−kg, which illustrates that knowledge graph could enrich information of embeddings and help to improve the accuracy of prediction.
KGANCDA outperforms than KGANCDA/−att, which demonstrates that distinguishing the importance of the information from different neighbors could help to improve the quality of embeddings.
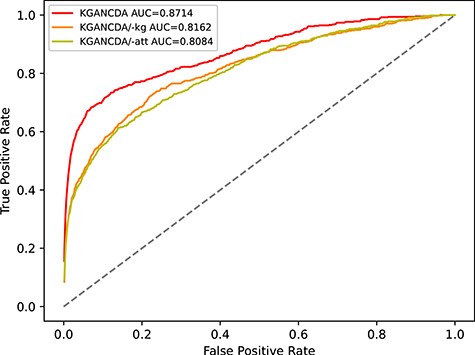
The performance comparison of KGANCDA, KGANCDA/−kg, KGANCDA/−att in term of AUC value based on 5-fold cross validation on dataset1.
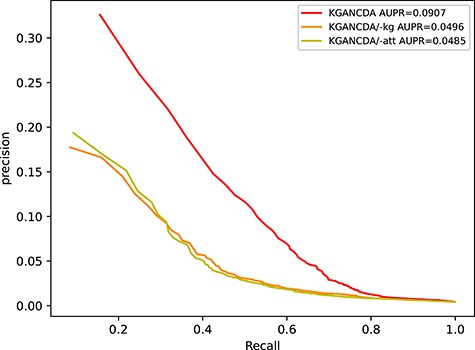
The performance comparison of KGANCDA, KGANCDA/−kg, KGANCDA/−att in term of AUPR value based on 5-fold cross validation on dataset1.
The effect of different knowledge graph (KG) embedding
KGANCDA/transR outperforms KGANCDA/transE and KGANCDA/transH. It demonstrates that embeddings generated by transR are better than other two models. This inspires us to explore more knowledge graph models that can extract high-quality embeddings from multisource associations in the future works.
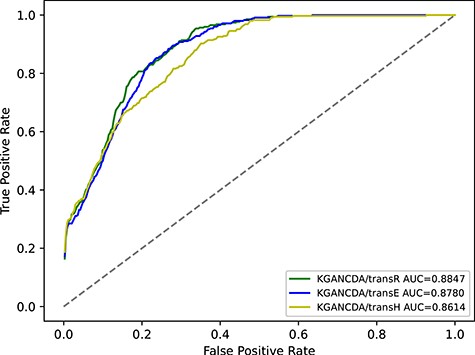
The performance comparison of KGANCDA/transE, KGANCDA/transH and KGANCDA/transR in term of AUC value on dataset2.
The effect of propagation layer and aggregation function
The effect of propagation layers
To evaluate the effectiveness of different propagation layers, we tested different layers of KGANCDA. The number of layers is in the range of 1 to 5. The models with different layers are named with corresponding numbers. For example, the KGANCDA with 1 propagation layer is named KGANCDA_1. The results are shown in Figure 15. We have the following observations:
With the increase of propagation layers, the performance is gradually improved. The AUC of KGANCDA_2 and KGANCDA_3 is significantly superior to KGANCDA_1. It demonstrates that the information from multi-order neighbors is captured by stacking multilayers of KGANCDA. It also illustrates that the embeddings containing high-order information could help to explore circRNA-disease associations. Specifically, as the example mentioned in Figure 4, the potential circRNA-disease associations could be retrieved based on multiple paths such as CircRNA-MiRNA-Disease or CircRNA-MiRNA-LncRNA-Disease rather than depending on traditional methods in Figure 3.
It can be found that the performance of KGANCDA_4 reaches the ceiling and the AUC value of KGANCDA_5 drops, which indicates that it is sufficient to consider 4-hop neighbors for each entity. For an entity, information from multiple layers may introduce noise into the embeddings.
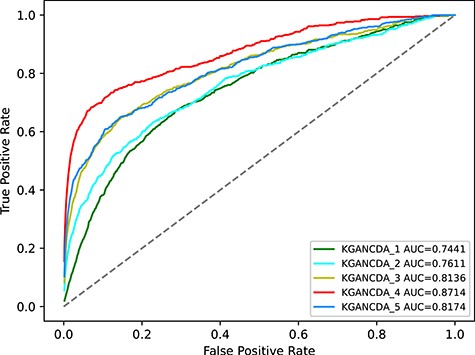
Average AUC value on different number of propagation layers in KGANCDA on dataset1.
The effect of aggregation functions
In here, we compare different aggregation functions (ADD aggregation function used in KGANCDA, Concatenation aggregation function). The model with concatenation functions is named KGANCDA_Concat. The result is shown in Figure 16. It can be found that the KGANCDA outperforms than the KGANCDA_Concat, which represents that the features are interacted fully in our methods. Therefore, it could conclude that the feature interaction is important in the information aggregation phase, which helps improve the performance of the method.
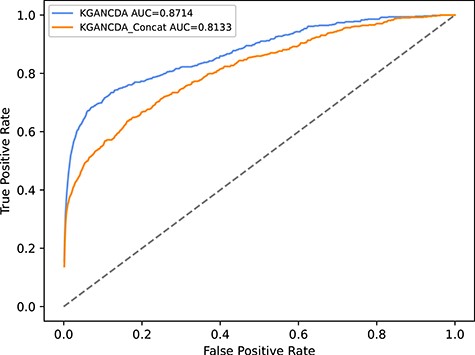
The performance of different combination functions of KGANCDA on dataset1.
Parameters setting
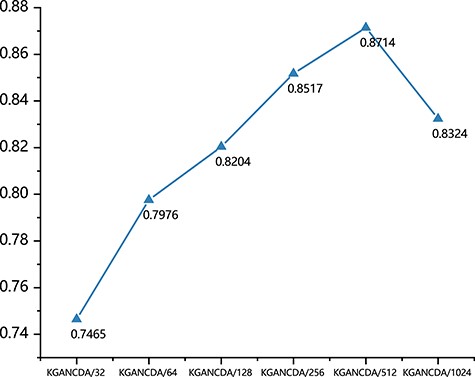
In KGANCDA, the Xavier initializer [45] is implemented to initialize all parameters and the parameters are optimized by Adam [46]. The training epochs are set as 150 and the batch size is fixed at 20. The learning rate is set to 0.0001. The |$\lambda$| is set as |${10}^{-5}$| and we use 0.1 dropout ratio following each layer in KGANCDA. Following the recommendation of Hu et al. [47], the dimensions of propagation layers are designed as a tower structure. As shown in Figure 17, the effect of different dimensions is compared and the structure with four layer (512–256–128-64) is selected in KGANCDA.
The effect of different dimensions of embeddings of KGANCDA on dataset1.
For MLP part, the four-layer structure (2944–736–184-1) is designed to obtain the affinity scores of each pair of circRNA-disease associations. The negative samples are randomly selected. To investigate the effect of the number of negative samples and training epochs, we change different ratio of negative samples and different epochs from 1:2 to 1:15 and from 20 to 150, respectively. After repeated experiments, it could be concluded that the performance is best if the ratio of negative samples is set as 1:4 and the epoch is set as 60.
Case study
To further verify the capability of KGANCDA to predict potential circRNA-disease associations, case study is implemented on colorectal cancer. Colorectal cancer is the second lethal cancer worldwide [48]. According to the static, it is the second most common cause of cancer death in United States [49]. Identifying circRNA related with colorectal cancer may help the diagnosis and treatment. Specifically, all known associations are trained in the proposed model. Then all unknown associations are predicted by the model. The top-15 predicted circRNAs of colorectal cancer are listed in Table 3.
The top 15 predicted results of colorectal cancer-related circRNAs based on KGANCDA on dataset1
| Rank | CircRNA | Evidence |
|---|---|---|
| 1 | circZFR | unknown |
| 2 | hsa_circ_0001649 | PMID:29421663 |
| 3 | hsa_circ_0009910 | unknown |
| 4 | circRBM23 | unknown |
| 5 | hsa_circ_0005273 | PMID:31973707 |
| 6 | hsa_circ_0080145 | unknown |
| 7 | circ-ANAPC7 | unknown |
| 8 | circ-ABCB10 | PMID:33902207 |
| 9 | hsa_circ_0000799 | unknown |
| 10 | circHIPK3 | PMID:29549306 |
| 11 | circMTO1 | PMID:30556859 |
| 12 | circCCDC66 | PMID:33125087 |
| 13 | cicRNA_100876 | PMID:33275225 |
| 14 | hsa_circRNA_103809 | PMID:30249393 |
| 15 | circAGFG1 | PMID:32681092 |
It can be found that 9 of 15 circRNAs (hsa_circ_0001649, hsa_circ_0005273, circ-ABCB10, circHIPK3, circMTO1, circCCDC66, circRNA_100876, has_circRNA_103809, circAGFG1) are confirmed by recent literature. The hsa_ circ_0001649 ranked at top 2 locates at chr6:146209155–14216113, which is related with gastric carcinoma growth [50] and stromal cell invasion in endometriosis [51]. It has been proved that the expression level in colorectal cancer is significantly lower than the normal tissues by using qRT-PCRs [52]. The hsa_circ_0005273 ranked at top 5 is located at chr8:141710989–141716304. Previous research has demonstrated that hsa_circ_0005273 is related with the proliferation and migration of bladder cancer [53]. Recent study has shown that hsa_circ_0005273 is positively associated with tumor growth and metastasis in colorectal cancer [54]. The circ-ABCB10 ranked at top 8 is located at chr1:2296659–229678118. It can upregulate the expression of miR-277 to inhibit the proliferation, migration, invasion and growth of subcutaneous xenografts and increase the radiosensitivity of SW480 cells [55]. It demonstrates that circHIPK3 located at chr11:33307958–33309057 can promote the growth and metastasis of colorectal cancer by sponging miR-7 [56]. In addition, circHIPK3 is demonstrated to be associated with many diseases, such as gliomas [57], bladder cancer [58], epithelial ovarian cancer [59]. The QRT-PCR shows that the expression of circMTO1 ranked at top 11 is significantly decreased in colorectal cancer tissues. It can promote colorectal cancer progression via activating Wnt/β-catenin signaling pathway [60]. In addition, circMTO1 is also related with bladder cancer [61]. The circCCDC66 ranked at top 12 locates at chr3:56626997–56628056, which has been proved that it can promote the development of colorectal cancer cells via regulation of miR-3140/autophagy [62]. The circRNA_100876 ranked at top 13 is located at chr11:71668272–71671937. It has been demonstrated that circRNA_100876 is abnormally overexpressed in colorectal cancer tissues and cell lines. The inhibition of circRNA_100876 can reduce the invasion ability of colorectal cancer cell [63]. It has been verified that hsa_circRNA_103809 ranked at top 14 can regulate the expression of miR-532-3p and FOXO4 by using qRT-PCR, western bolt and other experiments. The has_circRNA_103809 is significantly downregulated in colorectal cancer tissues [64]. The circAGFG1 ranked at top 15 has been found that it significantly suppresses cell proliferation, migration, invasion in colorectal cancer cell [65]. In addition, the circAGFG1 is found to be associated with triple-negative breast cancer in previous research [66]. Although other associations are not verified by the current study, it deserves biologists to further study by using experimental method.
Conclusion
More and more studies demonstrate that the circRNA is related with many diseases and can be regarded as the biomarkers of diagnosis and treatment of the disease. In recent years, many computational methods are proposed to predict circRNA-disease associations. However, many methods only depend on low-order interaction information, and the performance is limited due to the sparse interaction data. In this paper, we propose a new method, KGANCDA, to identify circRNA-disease associations based on knowledge graph attention network. Besides low-order neighbor information, KGANCDA can capture high-order neighbor information from multisource associations, which alleviates the limitation of data sparsity. In addition, a knowledge graph attention mechanism is used to improve the quality of the embeddings by distinguishing the importance of information from each entity’s neighbors. Finally, a multilayer perceptron is used to predict latent associations based on the embeddings of circRNA and disease. To verify the effectiveness of our model, we compare KGANCDA with six state-of-the-art methods (RWR, DMFCDA, GCNCDA, KATZHCDA, DWNN-RLS and CD-LNLP) based on 5-fold cross validation. In addition, the case study demonstrates that KGANCDA is an effective tool to predict circRNA-disease associations. The reasons of KGANCDA outperforms the other methods are concluded as following: (1) the miRNAs and lncRNAs in knowledge graph provide many high-order neighbor information to the embeddings of circRNAs and diseases, which help improve the performance of the model. (2) The knowledge graph attention network can improve the quality of the embeddings by aggregating neighbor information from multipath and distinguish the importance of them, which alleviate the problem of data sparsity.
In the future research, we will integrate more kinds of biological data and explore more methods that can extract high-quality embeddings of circRNA and disease [68–71].
It has been proved that circRNAs have close associations with many diseases. Therefore, predicting potential circRNA-disease associations contributes to diagnose and treatment of diseases.
We collect multiple association data (circRNA, disease, lncRNA and miRNA) from several public databases. Based on these association data, two knowledge graphs (cancer and non-cancer) are constructed. All data and code are released for further research.
We propose a new computational model (KGANCDA) based on knowledge graph attention network to predict CircRNA-Disease Associations. Besides low-order neighbor information, our method can capture high-order neighbor information from multisource neighbor information, which can alleviate the problem of data sparsity. To the best of our knowledge, this is the first work to apply knowledge graph attention network to predict circRNA-disease association.
The experimental results of benchmark datasets demonstrate that it outperforms than other state-of-the-art methods. Moreover, the case study shows that it is an effective tool for predicting potential circRNA-disease associations.
Funding
National Natural Science Foundation of China (grant nos 62072124, 61963004 and 61972185), the Natural Science Foundation of Guangxi (grant nos 2021GXNSFAA075041 and 2018GXNSFBA281193), the Science and Technology Base and Talent Special Project of Guangxi (grant no. AD20159044), the Shenzhen Science and Technology Program (grant no. KQTD20200820113106007), the Hunan Provincial Science and Technology Program (grant no. 2018WK4001).
Wei Lan received the PhD in computer science from Central South University, China, in 2016. Currently, he is a lecturer in School of Computer, Electronic and Information in the Guangxi University, Nanning, China. His current research interests include bioinformatics and machine learning.
Yi Dong received the BS degree in computer science from Hubei University of Technology, China, in 2019. He is currently an MSc student in computer science and technology, Guangxi University from 2019. His research interests include bioinformatics and deep learning.
Qingfeng Chen received the PhD degree in computer science from the University of Technology Sydney in 2004. He is currently a professor and the director of the bioinformatics team of the State Key Laboratory for Conservation and Utilization of Subtropical Agro-Bioresources at Guangxi University, China. His research interests include bioinformatics, data mining and artificial intelligence.
Ruiqing Zheng received the PhD in computer science from Central South University, China, in 2021. He is currently a lecturer at School of Computer Science and Engineering, Central South University, China. His current research areas are single data analysis and gene regulatory network construction.
Jin Liu received the PhD in computer science from Central South University, China, in 2017. He is currently an association professor at School of Computer Science and Engineering, Central South University, China. His current research interests include machine learning, medical image analysis, bioinformatics and related applications.
Yi Pan received his PhD degree in computer science from the University of Pittsburgh, USA, in 1991. He is the dean and a professor in the School of Computer Science and Control Engineering, Shenzhen Institute of Advanced Technology, Chinese Academy of Sciences, China. His current research interests include bioinformatics, big data, machine learning, cloud computing and wireless networks.
Yi-Ping Phoebe Chen received the PhD in computer science from the University of Queensland. She is a professor and chair of the Department of Computer Science and Computer Engineering at La Trobe University, Australia. Her research interests include bioinformatics, data mining and multimedia.
References
