


Abstract
Internal tandem duplication (ITD) of FMS-like tyrosine kinase 3 (FLT3-ITD) constitutes an independent indicator of poor prognosis in acute myeloid leukaemia (AML). AML with FLT3-ITD usually presents with poor treatment outcomes, high recurrence rate and short overall survival. Currently, polymerase chain reaction and capillary electrophoresis are widely adopted for the clinical detection of FLT3-ITD, whereas the length and mutation frequency of ITD are evaluated using fragment analysis. With the development of sequencing technology and the high incidence of FLT3-ITD mutations, a multitude of bioinformatics tools and pipelines have been developed to detect FLT3-ITD using next-generation sequencing data. However, systematic comparison and evaluation of the methods or software have not been performed. In this study, we provided a comprehensive review of the principles, functionality and limitations of the existing methods for detecting FLT3-ITD. We further compared the qualitative and quantitative detection capabilities of six representative tools using simulated and biological data. Our results will provide practical guidance for researchers and clinicians to select the appropriate FLT3-ITD detection tools and highlight the direction of future developments in this field. Availability: A Docker image with several programs pre-installed is available at https://github.com/niu-lab/docker-flt3-itd to facilitate the application of FLT3-ITD detection tools.
Introduction
Acute myeloid leukaemia (AML) is a type of malignant clonal haematological disease caused by pathological proliferation and differentiation of haematopoietic stem/progenitor cells (HSPCs) [1–3]. The annual incidence of AML is 3 to 4 per 100 000 individuals worldwide, accounting for 60–70% of adult acute leukaemia cases [4, 5]. Previous studies have shown that AML is often accompanied by multiple gene mutations, with FMS-like tyrosine kinase 3 (FLT3) constituting one of the significantly mutated genes [6–8].
FLT3, located on chromosome 13q12, encodes a member of the type III receptor tyrosine kinase family and is generally expressed in the HSPCs of bone marrow. FLT3 dimerizes and auto-phosphorylates upon binding of the FLT3 ligand, activating the intracellular tyrosine kinase domain and leading to the phosphorylation of downstream molecules, thereby mediating a series of intracellular signal transductions and promoting cell proliferation and differentiation [9, 10]. The internal tandem duplication (ITD) of FLT3 (FLT3-ITD), first reported by Nakao et al. [11] in 1996, mainly occurs in the juxtamembrane region of FLT3 and constitutes one of the most common mutations in patients with AML of all age groups, with an incidence of 20–30%. Notably, FLT3-ITD serves as a prognostic marker and therapeutic target in AML, as its presence is associated with high blood blast counts, normal karyotype, poor clinical prognosis, short overall survival and high recurrence rate [12–16].
FLT3-ITD occurs within exon14 and exon15 of FLT3, with the insertion position generally encompassing the Y591–Y597 region of exon14 [17]. The length of ITD is variable, ranging from 3 to >400 bp but always occurring in multiples of 3 bp [18]; additionally, each patient tends to harbour one to three ITD mutations [19]. It is well established that the mutational diversity of FLT3-ITD, such as mutation length, insertion site and mutant-to-wild-type allelic ratio, not only constitutes a prognostic indicator of AML but also an essential consideration for AML risk stratification and treatment options [20–25]. Previous studies indicated that the effect of mutation length on prognosis was still debatable: several studies concluded that the patients with longer ITDs have a worse outcome than those with shorter ITDs [26–28]; the research by Koszarska et al. [29] showed that a medium-sized length indicates a worse prognosis, whereas a recent study revealed that the size of the length is not significantly related to the prognosis of patients [30]. Therefore, the precise detection of length contributes to further ascertaining the prognostic significance of it. In addition, the recently revised European Leukemia Network guidelines for AML risk stratification have incorporated the allelic ratio (AR) of FLT3-ITD mutant alleles into prognostic stratification factors, classifying patients with AR values >0.5 and without NPM1 mutation into the high-risk group [31]. Thus, accurate detection of FLT3-ITD will be helpful in determining the prognosis of AML, guiding personalized clinical treatment, and providing new concepts for gene-targeted therapy of AML.
Traditionally, FLT3-ITD detection in clinical trials is performed via polymerase chain reaction (PCR) amplification based on cDNA [32]. The negative/positive status and the mutation length as reported through fragment analysis via capillary electrophoresis (CE) is regarded as the ‘gold standard’ in clinical practice and is widely used to measure the performance of detection tools on next-generation sequencing (NGS) data [33–35]. However, this method has several limitations: (i) the operation process may be easily contaminated, (ii) the insertion site and sequence information of ITD cannot be specified, (iii) overlapping of mutation peaks leads to inaccurate ascertainment of ITD number, and (iv) FLT3-ITD with low AR (<5.00%) are difficult to detect [22, 32, 36].
With the development of NGS technology, a number of bioinformatic tools and pipelines have been developed to detect FLT3-ITD using NGS data, which can effectively overcome the limitations of the traditional methods [37–42]. In the present review, we divided these tools into two types based on the detection strategy. In the alignment information-based strategy, the raw reads are first aligned to the human reference genome, and then discordant reads are extracted (such as via soft-clipping) to identify FLT3-ITD according to the characteristics of the tandem repeat. Software implementing this strategy includes (but are not limited to) Pindel [43], ITDseek [44], getITD [45], ScanITD [46] and FLT3_ITD_ext [47]. In comparison, the misaligned short reads are mainly assembled using particular algorithms, and then the assembled contigs are realigned to the human reference genome to precisely identify the sequence information containing FLT3-ITD in the assembly strategy. Software utilizing this strategy includes BreaKmer [48], ITDetector [49] and ITD assembler [50]. Additionally, Amplicon Indel Hunter (AIH) [51], a method for detecting large indels (>5 bp), can also be used to detect ITD mutations. However, in contrast to the above tools, AIH is independent of the human reference genome, rather directly detecting and annotating ITD by comparing the sequence information of paired reads in the FASTQ file. Furthermore, a small number of bioinformatics pipelines [52, 53] have also been reported to detect FLT3-ITD.
Overall, significant progress has been made in the related research of FLT3-ITD detection by adopting NGS data. However, to our knowledge no systematic comparison and evaluation among these methodologies have yet been reported. Thus, in the present study, we provided a comprehensive summary of the principles, functionality and limitations of the existing software for detecting FLT3-ITD. Furthermore, we evaluated the qualitative and quantitative analysis capabilities, redundancy rate and execution time of six representative tools using simulated and biological data (the workflow is shown in Figure 1). To maximize user convenience, we selected several detection tools with effective performance and built a Docker image which is publicly available at https://github.com/niu-lab/docker-flt3-itd. Through this review and evaluation, we aimed to provide guidance to clinicians and researchers regarding the selection of appropriate software and strategy for characterization. Additionally, we discussed the potential directions of development in this field of research.
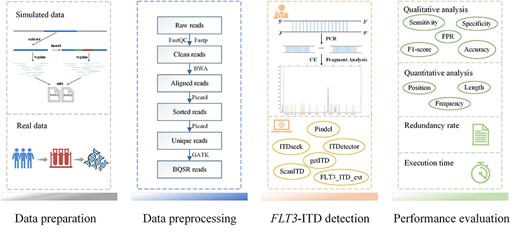
Overview of the experiments and evaluations. The data preparation phase included the generation of simulated data and DNA sequencing of real data. The data pre-processing phase involved the quality control of raw sequencing reads, mapping to the reference genome and mapping refinement. Then FLT3-ITD signals were detected using PCR followed by CE and computational methods. Finally, a comprehensive performance evaluation of FLT3-ITD detection tools based on the qualitative and quantitative detection capabilities, redundancy rate and execution time was conducted.
Materials and methods
Simulated data
A total of 500 FLT3-ITD-positive and 100 wild-type samples of paired-end sequencing data were simulated, referring to a previously published simulation method [49]. The insertion locations were randomly distributed in the region covering exon14 and exon15 of FLT3; mutation lengths were between 3 and 300 bp, in multiples of 3 bp; and allele frequencies were uniformly distributed between 5 and 55%. The specific simulation method was as follows.
(1) The sequence of 1000 bp covering FLT3 exon14 and exon15 (chr13: 28 607 501–28 608 500) was extracted from the human reference genome (hg19) as the wild-type sequence (FASTA format); the repeated sequence with specified ITD length was inserted into the wild-type sequence at random positions as the mutant sequence.
(2) The paired-end reads (100 bp) with 200× depth were generated from the prepared sequences in step (1), using wgsim (https://github.com/lh3/wgsim). The insert sizes were simulated using a normal distribution with a mean of 200 and a standard deviation of 20. All short reads were formatted in FASTQ format and assigned base quality values as ‘I’. FLT3-ITD-positive samples with different allele frequencies were generated by mixing wild-type and mutant reads in different proportions.
(3) The FASTQ files were mapped to the human reference genome (hg19) using BWA-MEM (version 0.7.17) [54] with the –M option. Then, the mapping reads were sorted using Picard (version 2.18.27, http://broadinstitute.github.io/picard/).
Biological data
To further evaluate the performance of different software in detecting FLT3-ITD, we also incorporated the data of 163 patients in the AML cohort from the First Hospital of Jilin University, each of whom provided written informed consent. The specific data preparation and processing procedures were as follows.
(1) DNA extraction: Genomic DNA was extracted from bone marrow using the Wizard Genomic DNA Purification kit (Promega, Madison, WI, USA) following the instructions of the manufacturer. The concentration of extracted DNA was assayed using a NanoDrop One spectrophotometer (Thermo Scientific, USA) and DNA samples were stored at −20°C.
(2) Sequencing: We sequenced the DNA of 163 patients with AML using a targeted gene panel based on hybrid capture (HC) sequencing technology to obtain 2×150 bp paired-end sequencing FASTQ files with an average depth of ~2000× (Supplementary Figure 1), as this technology has been shown to perform well in FLT3-ITD detection, being generally superior to other sequencing platforms [34, 55].
(3) Quality control and alignment: According to the NGS data processing strategy [56], FastQC (version 0.11.8) [57] and Fastp (version 0.19.7) [58] were applied for quality control and pre-processing, respectively. Clean reads obtained following quality control were then aligned to the human reference genome (hg19) using BWA-MEM with the -M option to obtain the BAM file; subsequently, the mapping reads were sorted, and PCR duplicates were removed using Picard. Finally, the base quality correction was performed to obtain BAM files that could be used for downstream analysis using the GATK4 (version 4.0.3.0, https://gatk.broadinstitute.org/hc/en-us).
PCR and CE to detect FLT3-ITD
PCR and CE were performed on all 163 AML samples; additionally, capillary data were evaluated using GeneMapper (version 5.0, Applied Biosystems, Foster City, CA, USA) to analyse the number, area and location of the peaks on the map. Previous studies have shown that the wild-type PCR product produces a peak at about 325 bp, whereas the position of the FLT3-ITD mutation peak is >325 bp owing to tandem repetition, with the difference in position reflecting the ITD length (including an average error of ±2 bp) [22]. Theoretically, the number of mutation peaks represents the number of ITD in each sample. However, overlapping of mutation peaks is apparent in the fragment analysis results when FLT3-ITDs with the same length occur at different positions in a sample, rendering it impossible to report the number of mutations accurately. In addition, the allele frequency was calculated by dividing the ITD peak area by the sum of the ITD and wild-type peak areas [32].
Methods and software for detecting FLT3-ITD
In the current study, we mainly investigated eight existing software platforms used to detect FLT3-ITD, and their detection principles, characteristics and applicable scenarios were summarized in Table 1. We divided these tools into two categories according to the detection principle: alignment information-based [43–47] and assembly strategy-based [48–50] methods. Notably, although the methods based on assembly strategy can compensate for the limitations inherent in relying entirely on the alignment information, the repetitive and heterozygous sequences in the genome substantially negatively impact assembly quality. Furthermore, according to the range of detection, the existing software can be divided into those only detecting ITD mutation [44–47, 49, 50] and those detecting all mutation types (such as insertions and deletions, and structural variants) [43, 48]. However, the latter requires manual screening of the results. The existing tools can also be divided into two cases according to the applicable scenarios: those for use with HC sequencing data only [48–50] and those for both HC and amplicon sequencing data [43–47]. We finally included six representative software programs: Pindel, ITDseek, ScanITD, getITD, ITDetector and FLT3_ITD_ext, in the comparative analysis because BreaKmer and ITD assembler failed to run in our computational environment and lacked necessary technological support from their developers. Besides, both ITDetector and getITD reported the mutations in the Tab-separated value (TSV) format, whereas the other tools provided the results in the standard variant call format (VCF), which is convenient for downstream bioinformatics analysis. The detection principles and limitations of the six software platforms were summarized as follows.
Summary of FLT3-ITD detection tools
| Tool | Version | Language | Depended-upon packages and libraries | Input format | Output format | Detection strategy1 | HC data2 | Amplicon data2 | Variant type | Year published | URL |
|---|---|---|---|---|---|---|---|---|---|---|---|
| Pindel | v0.2.5b8 | C++ | htslib | BAM | VCF | I | YES | YES | Indels3 and SVs3 | 2009 | https://github.com/genome/pindel |
| ITDetector | null4 | Perl | blat, bedtools, CAP3, fasta36, samtools | BAM | TSV | II | YES | NO | only ITDs | 2015 | https://github.com/ken0-1n/Genomon-ITDetector |
| BreaKmer | v0.0.4-beta | Python | blat, Cutadapt, Jellyfish | BAM | TXT | II | YES | NO | SVs | 2015 | https://github.com/ryanabo/BreaKmer |
| ITD Assembler | null | Haskell, Python, C | samtools, bamtools, blastn, bedtools, phrap, GHC platform | BAM | BED | II | YES | NO | only ITDs | 2015 | https://github.com/wudustan/ITD-Assembler |
| ITDseek | v1.2 | Perl | samtools | BAM | VCF | I | YES | YES | only ITDs | 2016 | https://github.com/tommyau/itdseek |
| getITD | v1.2.2 | Python | biopython, easygui | FASTQ | TSV | I | YES | YES | only ITDs | 2019 | https://github.com/tjblaette/getitd |
| ScanITD | null | Python | samtools, scikit-bio, pysam | BAM | VCF | I | YES | YES | only ITDs | 2020 | https://github.com/ylab-hi/ScanITD |
| FLT3_ITD_ext | null | Perl | samtools, bwa, fgbio, bbmap, sumaclust | BAM/FASTQ | VCF | I | YES | YES | only ITDs | 2020 | https://github.com/ht50/FLT3_ITD_ext |
1Two FLT3-ITD detection strategies include: strategy I ‘alignment information-based’ and strategy II ‘assembly-based’.
2The tool can detect FLT3-ITD using either hybridization capture (HC) or amplicon sequencing data.
3insertions and deletions (Indels); structural variants (SVs).
4GitHub does not include a version number.
Pindel
Pindel incorporates a typical method for detecting structural variations using a split-read strategy, which adopts a pattern growth algorithm to find the smallest and largest unique sub-strings that match the known sequence. Pindel first aligns all reads to the reference genome, then selects the paired-end reads with only one end successfully mapped and divides the unmapped end into two parts, continuing their alignment to the reference genome. Finally, it checks the realignment results of the two parts to identify the ITD. The two parts covering the ITD can be successfully aligned to the reference genome, with the alignment positions then connected end to end. Previous studies have shown that Pindel can identify the position and length of ITD with high accuracy; however, the detected mutation frequency is low [34, 37, 38, 40].
ITDseek
ITDseek specifically searches for all soft-clipping points in primary alignments and correlates them with the corresponding secondary alignments (marked as hard-clipping) to identify FLT3-ITD, as the reads containing ITD are marked for soft-clipping in the alignment result. Therefore, ITDseek strongly relies on the -M parameter of BWA-MEM to mark shorter split hits as secondary (Supplementary Table 1). Besides, ITDseek reports all insertions of FLT3 exon14 and exon15 in the result as ITDs. Notably, ITDseek was developed based on amplicon sequencing data. Although the author stated that it could be applied to HC sequencing data, to our knowledge no research or evaluation of this issue has yet been reported.
ScanITD
ScanITD detects FLT3-ITD following a similar principle as ITDseek but overcomes its noted deficiencies. An improvement incorporated in ScanITD is the string rotation method, which can distinguish insertions of novel sequences and duplications of the genome sequence. Conversely, the ITD callers, such as ITDseek, are unable to differentiate shorter insertions and tandem repeats. Moreover, ScanITD regards all chimeric reads containing ITD, and the split reads at the same position of the reference genome as mutation reads when calculating the allele frequency. Nevertheless, ScanITD cannot detect complex types of FLT3-ITD, such as duplications carrying short insertions and deletions.
getITD
getITD first selects high-quality sequencing reads aligning to the reference genome to identify insertions, then determines whether the insertions are ITDs and finally annotates insertions and ITDs. A set of high-confidence FLT3-ITD lists can be obtained by filtering out ITDs with variant allele frequencies <0.006% and <2 supported reads. However, getITD utilizes FASTQ files as input and cannot parse large files (such as the sequencing data used in the present study containing 193 genes). Thus, it becomes necessary to extract reads in a certain region from the FASTQ file manually. In addition, the upper limit of ITD length detected by getITD is affected by the length of the sequencing data.
ITDetector
ITDetector is a method for detecting FLT3-ITD adopting an assembly strategy. ITDetector collects soft-clipping sequences >20 bp in length and realigns them to the human reference genome to identify ITD breakpoint pairs (ITD-BPPs), whose corresponding soft-clipping sequences at the left and right breakpoints align to the position of the other breakpoints. Supported reads and their mate pairs for each ITD-BPP are assembled to generate a contig sequence. Finally, the contig sequences are checked to confirm whether they cover the corresponding ITD-BPPs. ITDetector effectively avoids the deviation caused by alignment errors; however, it cannot detect ITDs with more than two duplicates and is suitable for somatic ITD detection only.
FLT3_ITD_ext
Reads containing ITD result in local alignment and soft-clipping upon mapping to the reference genome. FLT3_ITD_ext extends these reads and adopts the central clustering-based greedy algorithm sumaclust for clustering, with each centroid sequence of the clusters being regarded as an FLT3-ITD. This method is unique in exon interval sensitivity, UMI handling, alignment-based annotation and platform-specific AR estimates, which can effectively solve the shortcomings of existing methods that underestimate mutation frequency. The limitation of FLT3_ITD_ext is its inability to identify large, purely non-templated insertions, such as dispersed duplications.
Experiments using six FLT3-ITD detection software platforms
We tested all six software platforms on an Ubuntu 16.04.4 LTS server with Linux 4.4.0-116-generic x86_64. ITDseek, ITDetector and FLT3_ITD_ext were run in the Perl environment; getITD and ScanITD, which are available as Python scripts, were executed via the terminal (command line) in Python version 3.8.1; and Pindel was compiled and run in the C++ environment. All software programs were run using the default parameter settings obtained from the respective instruction manuals. The thresholds of detecting insert length and allele frequency were fine-tuned according to the information of the simulated data. The execution time was recorded as the time taken to detect FLT3-ITD; the previous data processing and subsequent result filtering time were not included.
Performance evaluation of detection tools
In order to evaluate the performance of each software platform in detecting FLT3-ITD, the performance test and analysis of results were conducted on simulated and biological data. Comparative analysis of the software mainly involved four factors. (1) Qualitative analysis: comparison of the ability to distinguish FLT3-ITD-positive and -negative patients correctly; primary measurement indicators included sensitivity, specificity, false-positives, F1-score and accuracy. (2) Quantitative analysis: comparison of the accuracy of the ITD insertion position, length and mutation frequency reported in positive samples. The gold standard to measure the detection performance is the result of fragment analysis for real data and the pre-set ITD information for simulated data. The capacity of quantitative analysis mainly considers its linear correlation with the gold standard results, with the Pearson correlation coefficient and R2 being adopted for correlation analysis. (3) Redundancy rate: comparison of the redundancy rate of the results. (4) Execution time: comparison of the time required for FLT3-ITD detection by various software platforms under the same computing environment.
Results
PCR and CE fragment analysis
PCR and CE results showed that the 163 AML samples included 29 (17.79%) FLT3-ITD-positive and 134 (82.21%) negative cases. Fragment analysis of the 29 positive cases revealed that the insert length ranged from 6 to 165 bp, the allele frequency ranged from 4.45 to 69% and each sample contained one or two ITD mutations. The peak graph for fragment analysis using GeneMapper is shown in Supplementary Figure 2. In the present study, the expected peak value of the wild-type PCR product was 324 bp; a peak with a value greater than this was considered as an FLT3-ITD. Therefore, the mutation peak appeared on the right side of the wild-type fragment, with the number of right-hand peaks reflecting the number of FLT3-ITD in a sample.
Comparison of the six methods
We tested the six representative software platforms (Pindel, ITDseek, ScanITD, getITD, ITDetector and FLT3_ITD_ext) on simulated and real data to evaluate the performance of each package in detecting FLT3-ITD. As the format of the results and the description of the mutation differ for each platform, we wrote Python scripts to batch process the results for the purpose of extracting the sample name, ITD insertion position, sequence information, length and allele frequency to facilitate direct comparison.
Qualitative analysis
The key indicators used to measure qualitative analysis ability comprised sensitivity (recall rate), which refers to the proportion of positive samples that are detected among the samples judged to be FLT3-ITD-positive by the gold standard; specificity, which refers to the proportion of negative samples that are detected among the samples judged to be negative by the gold standard; precision, which refers to the proportion of the samples judged to be FLT3-ITD-positive by the gold standard among the detected positive samples; false-positive, which refers to the proportion of positive samples that are detected among the samples judged to be negative by the gold standard; and F1-score, defined as the harmonic average of precision and recall.
Pindel, ITDseek and FLT3_ITD_ext detected all 500 positive samples in the simulated data with a sensitivity of 100%, whereas ITDetector and ScanITD detected 86.8% (434) and 83% (415) of the 500 samples, respectively. However, getITD only detected 20.20% (101) (Figure 2), mainly resulted from its sensitivity limited by read length and region (chr13:28 608 023–28 608 352). The statistical results showed that performance of getITD was improved when the ITD length is less than 100 bp (Supplementary Table 2). According to the region, we further grouped the simulated samples and found that F1-score of getITD was improved from 0.336 to 0.782 (Supplementary Table 2). In addition, all software platforms showed a specificity of 100% and a false-positive rate of 0.00%. We considered that this phenomenon primarily resulted from the simulated data being generated under ideal conditions, such as high sequencing quality, single mutation type (ITD) and only one FLT3-ITD in each sample.
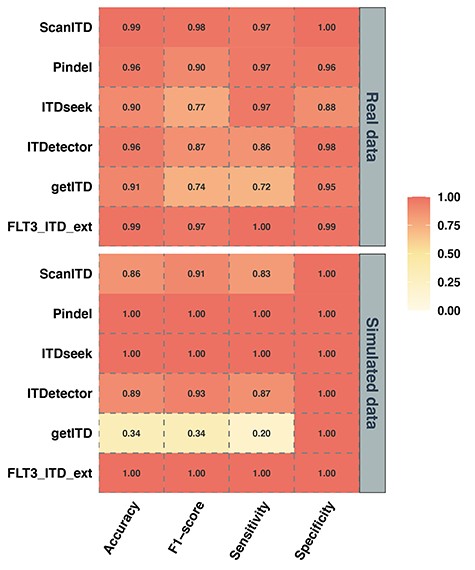
Heatmap of qualitative results of FLT3-ITD detection software on simulated and real data. The colour reflects the qualitative analysis capability of the six software platforms; darker colour indicates higher qualitative analysis capability.
Therefore, we further conducted testing using biological data from 163 AML cases (Figure 2). Pindel, ScanITD and FLT3_ITD_ext performed significantly better than the other three software programs, with high sensitivity and specificity, and low false-positive rates. FLT3_ITD_ext showed the highest sensitivity (100%) and detected all positive samples; ScanITD and Pindel showed comparable sensitivity (96.55%) although ScanITD exhibited the highest specificity (100%) and the lowest false-positive rate (0.00%). Comprehensively, considering the evaluation indicators, FLT3_ITD_ext and ScanITD performed better with regard to the qualitative analysis being able to distinguish between FLT3-ITD-positive and -negative patients more accurately.
Quantitative analysis
Quantitative analysis of FLT3-ITD refers to the accuracy of detecting ITD insertion position, length and allele frequency in positive samples, mainly considering the linear correlation with the gold standard results by using the Pearson correlation coefficient and R2 correlation analysis.
On the simulated dataset, the six software platforms accurately located the insertion position of FLT3-ITD, with the value of each evaluation index differing <0.10 (Table 2). Notably, getITD was not sensitive to FLT3-ITDs with length longer than read length (Supplementary Figure 3), whereas the other five software programs precisely detected the mutation length. However, the accuracy of the allele frequency detected by different software platforms markedly varied (except for ITDetector, which did not report allele frequency). The accuracy of allele frequency detected by ITDseek, ScanITD and getITD was low, with the Pearson correlation coefficient of the detection and fragment analysis results being <0.80 and the R2 value of the fitting curve <0.50, which does not indicate a strong correlation between these results (Figure 3). In contrast, the allele frequency reported by Pindel and FLT3_ITD_ext strongly correlated with that from fragment analysis. Further observation of the linear regression slope for the fitting curve showed that the four software programs Pindel, ITDseek, getITD and ScanITD underestimated the allele frequency of ITD, which was consistent with the conclusion from previous studies [21, 31]. FLT3_ITD_ext was the only platform that accurately identified the ITD allele frequency (linear regression slope = 0.98).
Quantitative analysis results of FLT3-ITD detection tools
| Tool data and evaluation indicator | Pindel | ITDseek | ScanITD | ITDetector | getITD | FLT3_ITD_ext | ||
|---|---|---|---|---|---|---|---|---|
| Simulated data | Position | Pearson correlation coefficient | 0.9871 | 0.9994 | 0.9999 | 1.0000 | 0.9545 | 0.9999 |
| Linear regression slope1 | 1.06 | 1.02 | 1.00 | 1.00 | 1.09 | 1.00 | ||
| R2 | 0.9745 | 0.9989 | 0.9998 | 1.0000 | 0.9111 | 0.9998 | ||
| Length | Pearson correlation coefficient | 0.9999 | 0.9998 | 1.0000 | 0.9999 | -0.3827 | 1.0000 | |
| Linear regression slope | 1.00 | 1.00 | 1.00 | 1.00 | -0.09 | 1.00 | ||
| R2 | 1.0000 | 0.9997 | 1.0000 | 0.9998 | 0.1465 | 1.0000 | ||
| Frequency | Linear regression slope | 0.53 | 0.21 | 0.39 | —— | 0.30 | 0.98 | |
| Real data | Length | Pearson correlation coefficient | 0.9999 | 0.8559 | 0.9999 | 0.9983 | 0.9967 | 0.9999 |
| Linear regression slope | 1.02 | 0.83 | 1.02 | 0.98 | 1.01 | 1.02 | ||
| R2 | 0.9998 | 0.7326 | 0.9998 | 0.9966 | 0.9935 | 0.9998 | ||
| Frequency | Linear regression slope | 0.70 | 0.57 | 0.44 | —— | 0.59 | 1.05 | |
1The regression slope of the fitting curve is used to evaluate the veracity of detecting FLT3-ITD.
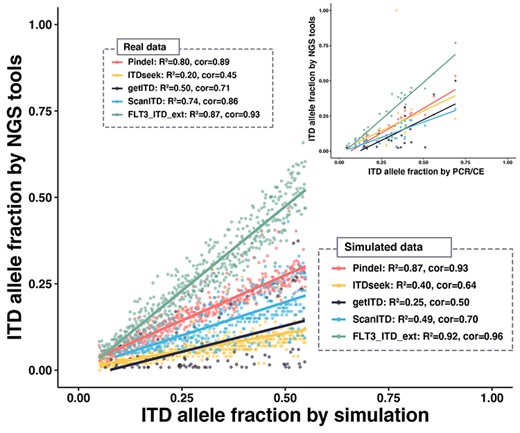
Quantitative analysis of the FLT3-ITD mutation allele fraction using simulated (bottom-left) and real data (top-right). The different colours represent five tools (ITDetector was excluded as it did not report the mutation allele fraction). Each dot represents a positive sample detected by the software. The solid line constitutes the linear regression curve of the FLT3-ITD allele fraction reported by the NGS tools and the gold standard. The list in the dashed box represents the R2 and Pearson correlation coefficient of each fitted curve.
We only compared the accuracy of FLT3-ITD length and allele frequency on the AML data because PCR and fragment analysis did not report the insertion position of ITD (Table 2 and Figure 3). The results suggested that except for ITDseek, the other five software platforms could also accurately detect insertion length. The allele frequency detected by Pindel and FLT3_ITD_ext exhibited a strong correlation with the fragment analysis compared with that of the other programs (Figure 3 and Supplementary Figure 4), which is consistent with the conclusions from the simulated data. Similarly, FLT3_ITD_ext effectively solved underestimating the allele frequency exhibited using most methods by adjusting its allele frequency through internal algorithms (linear regression slope = 1.05). In general, FLT3_ITD_ext accurately detected the insertion position, length and allele frequency of ITD on both simulated and real data.
Redundancy rate
We next assessed the six methods mainly focusing on the redundancy rate of the results. The proportion of extra information in the results was termed the redundancy rate in this study. The experiments showed that multiple mutation items were reported with continuous insertion positions for one FLT3-ITD (Figure 4). High redundancy in results is not conducive for obtaining precise ITD information and complicates subsequent filtering and post-processing. In addition, through comparative analysis, we also found that the method based on assembly strategy (ITDetector) exhibited a low redundancy rate. Furthermore, ScanITD and FLT3_ITD_ext significantly reduced the redundancy rate compared with other methods based on alignment information (Table 3).
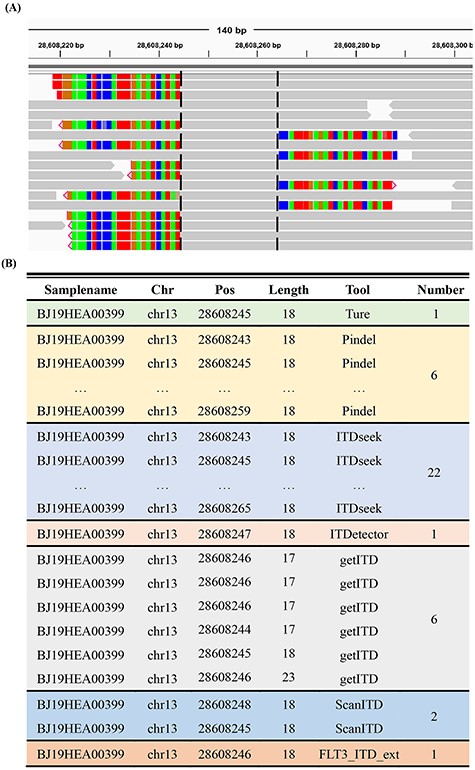
Example of redundant FLT3-ITD lists generated by the six software platforms. (A) Integrative Genomics Viewer screenshot of a positive sample (FLT3-ITD of 18 bp at chr13: 28 608 245–28 608 262). Reads covering ITD are marked as coloured soft-clipping. The black dotted line represents the left and right breakpoints formed by aligning these reads to the reference genome, and the sequences between the two breakpoints represent the repeated fragments. (B) FLT3-ITD lists detected by Pindel, ITDseek, ITDetector, getITD, ScanITD and FLT3_ITD_ext.
Redundancy rate and execution time of FLT3-ITD detection tools
| Evaluation tool indicator | Pindel | ITDseek | ScanITD | ITDetector | getITD | FLT3_ITD_ext | |
|---|---|---|---|---|---|---|---|
| Simulated data | Redundancy rate (%) | 7.75 | 47.92 | 11.32 | 1.14 | 76.99 | 0.00 |
| Execution time1 (s) | 10.62 | 0.09 | 2.42 | 301.78 | 21.72 | 1.65 | |
| Real data | Redundancy rate (%) | 60.76 | 53.47 | 20.51 | 27.03 | 71.79 | 18.42 |
| Execution time (s) | 17.65 | 0.81 | 336.74 | 10106.23 | 14.85 | 2.77 | |
1The execution time is the average time required to detect the FLT3-ITD for each sample.
Execution time
The execution time required for detecting FLT3-ITD varied among the six tools, primarily owing to the dependent software and detection principle. We evaluated the execution time of all software platforms by carrying out detection on identical datasets with the default parameter settings. Table 3 showed that ITDseek had the fastest performance on both simulated and real data, being able to analyse one AML sample in <1 s on average, followed by FLT3_ITD_ext (2.77 s), getITD (14.85 s), Pindel (17.65 s) and ScanITD (336.74 s). ITDetector was the slowest, requiring nearly 3 h to analyse one AML sample, which is inconvenient for practical application. Notably, getITD requires FASTQ files as input, cannot parse large files, and requires manual extraction of the region from the FASTQ files prior to implementation, which is time-consuming. However, these were not included in the execution time.
Discussion
Method summary and software comparison
In this study, we initially investigated eight software platforms to detect FLT3-ITD in AML and summarized the detection strategy, operating environment, applicable scenarios and other features. To further evaluate the detection performance, we compared and assessed the qualitative and quantitative analysis capabilities of six representative tools on simulated and biological data. Except for getITD, the other five software exhibited consistent detection capability on simulated and biological data. On the contrary, getITD performed significantly better on biological data, mainly resulted from its sensitivity limited by read length and region. In addition, most tested programs underestimated the frequency of mutations relative to fragment analysis except for FLT3_ITD_ext.
Furthermore, we also compared the redundancy rate and execution time of these tools. The experiments showed that the redundancy rate of results on biological data was generally higher compared with simulated data, mainly because other mutation types in samples and sequence features nearby the insertion position of FLT3_ITD may also potentially affect detection. In addition, the results also revealed that the execution time of ITDetector was significantly longer than other tools. The reason behind this observation was that ITDetector relied on the CAP3 Sequence Assembly Program and did not provide a parameter to set the region for detecting ITD. Overall, our study indicated that FLT3_ITD_ext accurately identified and quantified FLT3-ITD-positive samples considering all evaluation indicators and obtained allele frequencies nearly equal to the results of fragment analysis, which is sufficient to satisfy present clinical research requirements.
Limitations of this study
Although we comprehensively compared the performance of existing software to detect FLT3-ITD in this review, some limitations were noted. Firstly, we simulated the data used herein under ideal conditions, with each sample only containing a single ITD mutation. However, the sequencing errors, contamination and complex mutations in NGS data may affect the detection performance, resulting in higher sensitivity and specificity of detection using simulated rather than biological data. In addition, we tested only HC sequencing data; thus, amplicon sequencing data should also be included to realize the analysis of software performance across sequencing platforms. Finally, several tools were not included in our study, as they did not provide open-source programs and had execution errors.
Limitations of existing software and directions of future developments
The FLT3-ITD detection software based on NGS has made significant advances. However, several problems remain to be solved. We found that most software platforms relied on third-party programs that needed to be manually installed. However, the installation process was relatively complex, rendering the process potentially difficult for researchers lacking sufficient background knowledge in computers. The selection of quality control and sequence alignment tools during data pre-processing is also crucial for the detection software, most of which only accept BAM files as input and lack detailed instructions. Moreover, none of the existing software platforms can detect large, purely non-template insertions, such as duplications carrying indels, and dispersed duplications. Although no large non-template insertions have been reported in FLT3, this aspect should be further investigated. Finally, detection of FLT3-ITD in the reference genome repeat regions remains a significant problem, which not only leads to incomplete alignment information but also affects the assembly quality, resulting in reduced detection performance.
Therefore, future research should focus on integrating the advantages of existing software, automating the installation and improving the detection of FLT3-ITD with atypical structures. A bioinformatics pipeline affording platform specificity, high operational efficiency and high portability should be developed that accepts FASTQ files as input and tests on a larger sample set to provide enhanced practical guidance for the clinical stratification and prognostic treatment of patients with AML.
We compiled a comprehensive summary of the principles, functionality and limitations of the software used for detecting FLT3-ITD.
We compared the detection performance of six representative tools using simulated and biological data. We found that FLT3_ITD_ext outperformed the other tools with regard to qualitative and quantitative analysis, redundancy rate and execution time.
A Docker image (https://github.com/niu-lab/docker-flt3-itd) has been made available to facilitate identifying and quantifying FLT3-ITDs.
Funding
This work is supported by the Strategic Priority Research Program of the Chinese Academy of Sciences [grant number XDB38040100]; the National Natural Science Foundation of China [grant number 31771466]; the Cancer Genome Atlas of China (CGAC) project (YCZYPT [2018]06) from the National Human Genetic Resources Sharing Service Platform (2005DKA21300).
Conflict of interest
The authors declare that no conflict of interests exist.
Danyang Yuan is a master student at the Computer Network Information Center, Chinese Academy of Sciences. She is mainly engaged in leukaemia-related bioinformatics and cancer genomics research. Her affiliation is with Computer Network Information Center, Chinese Academy of Sciences, University of the Chinese Academy of Sciences, Beijing 100190, China.
Xiaoyu He is a Ph.D. candidate at the Computer Network Information Center, Chinese Academy of Sciences. She is mainly engaged in research related to the cancer genome and construction of the Chinese Cancer Genome Database. Her affiliation is with Computer Network Information Center, Chinese Academy of Sciences, University of the Chinese Academy of Sciences, Beijing 100190, China.
Xinyin Han is a Ph.D. candidate at the Computer Network Information Center, Chinese Academy of Sciences. He is mainly engaged in cancer genomics research focusing on the precise detection of tumour immunotherapy biomarkers. His affiliation is with Computer Network Information Center, Chinese Academy of Sciences, University of the Chinese Academy of Sciences, Beijing 100190, China.
Chunyan Yang is the Vice Director of the Laboratory of ChosenMed Technology (Beijing) Co., Ltd. She is mainly engaged in research regarding solid tumours and haematologic malignancy using multiple approaches, including next-generation sequencing. Her affiliation is with ChosenMed Technology (Beijing) Co., Ltd., Beijing 100176, China.
Fei Liu is the bioinformatics analysis engineer of ChosenMed Technology (Beijing) Co., Ltd. She is mainly engaged in the collection of biological information and analysis of genomic and cancer data or other biological information. Her affiliation is with ChosenMed Technology (Beijing) Co., Ltd., Beijing 100176, China.
Shuying Zhang is currently a master student at the Computer Network Information Center, Chinese Academy of Sciences. Her research mainly focuses on the cancer genome and bioinformatics. Her affiliation is with Computer Network Information Center, Chinese Academy of Sciences, University of the Chinese Academy of Sciences, Beijing 100190, China.
Haijing Luan is a master student at the Computer Network Information Center, Chinese Academy of Sciences. She is mainly engaged in researching cancers of unknown primary sites (CUP) based on deep learning. Her affiliation is with Computer Network Information Center, Chinese Academy of Sciences, University of the Chinese Academy of Sciences, Beijing 100190, China.
Ruilin Li is a Ph.D. candidate at the Computer Network Information Center, Chinese Academy of Sciences. Her research interests include high-performance computing and bioinformatics. Her affiliation is with Computer Network Information Center, Chinese Academy of Sciences, Beijing 100190, China.
Jiayin He received her master's degree in Statistics from George Washington University. She is currently researching at the Computer Network Information Center, Chinese Academy of Sciences. Her research interests include biostatistics and computational statistics. Her affiliation is with Computer Network Information Center, Chinese Academy of Sciences, Beijing 100190, China.
Xiaohong Duan is the Director of the Laboratory of ChosenMed Technology (Beijing) Co., Ltd. She is mainly engaged in the research of solid tumours and haematologic malignancies using multiple approaches, including next-generation sequencing. Her affiliation is with ChosenMed Technology (Beijing) Co., Ltd., Beijing 100176, China.
Dongliang Wang earned his Ph.D. at Harbin Medical University. He is now the Chief Medical Officer of ChosenMed Technology (Beijing). His research mainly focuses on the mining and verification of molecular markers for tumour therapy. His affiliation is with ChosenMed Technology (Beijing) Co., Ltd., Beijing 100176, China.
Qiming Zhou is the CTO of ChosenMed Technology (Beijing) Co., Ltd. He is mainly engaged in the development of new molecular diagnostics technologies in genetic testing. His affiliation is with ChosenMed Technology (Beijing) Co., Ltd., Beijing 100176, China.
Sujun Gao is the chief physician at the Department of Haematology, The First Hospital of Jilin University. Her research mainly focuses on the experimental and clinical research of malignant haematological disorders and haematopoietic stem cell transplantation. Her affiliation is with Department of Haematology, The First Hospital of Jilin University, Changchun 130021, China.
Beifang Niu is a research professor at the Computer Network Information Center, Chinese Academy of Sciences. His research interests include cancer genomics, metagenomics, and the development of computational tools for working with data from next-generation sequencing technologies. His affiliation is with Computer Network Information Center, Chinese Academy of Sciences, University of the Chinese Academy of Sciences, Beijing 100190, China, ChosenMed Technology (Beijing) Co., Ltd., Beijing 100176, China.
References
Author notes
Danyang Yuan and Xiaoyu He contributed equally to this work.
