


Abstract
Cell clustering is one of the most important and commonly performed tasks in single-cell RNA sequencing (scRNA-seq) data analysis. An important step in cell clustering is to select a subset of genes (referred to as ‘features’), whose expression patterns will then be used for downstream clustering. A good set of features should include the ones that distinguish different cell types, and the quality of such set could have a significant impact on the clustering accuracy. All existing scRNA-seq clustering tools include a feature selection step relying on some simple unsupervised feature selection methods, mostly based on the statistical moments of gene-wise expression distributions. In this work, we carefully evaluate the impact of feature selection on cell clustering accuracy. In addition, we develop a feature selection algorithm named FEAture SelecTion (FEAST), which provides more representative features. We apply the method on 12 public scRNA-seq datasets and demonstrate that using features selected by FEAST with existing clustering tools significantly improve the clustering accuracy.
Introduction
Single-cell RNA sequencing (scRNA-seq) technologies have revolutionized biological research [1–3]. Unlike the traditional bulk RNA sequencing (RNA-seq) that measures the average expression of the large number of cells, scRNA-seq profiles the transcriptome of individual cells, which provides data with higher resolution for better understanding the transcriptomic regulation and variation at the cellular level. It has been successfully applied to study many complex biology systems such as the immune system [4], cerebral cortices [5] and tumor progressions [6]. In addition to the traditional expression analysis in bulk RNA-seq, scRNA-seq provides information to answer many new biological questions, such as discovering novel and rare cell types [7] and constructing pseudotime cell trajectories [8].
The scRNA-seq experiments usually generate expression profiles for large number of cells. For example, the 10× genomics sequencer can profile thousands to millions of cells at a relatively low cost. One of the most important goals for scRNA-seq data analysis is cell clustering, which is to partition cells into multiple groups via unsupervised clustering algorithms. Cell clustering provides important information for the cell composition and cell type specific transcriptome in complex tissues. It lays the foundation for downstream analyses such as differential expression, pseudotime construction and new/rare cell type discovery. There are many methods and tools developed for unsupervised cell clustering [9–11], and they have been comprehensively reviewed and compared [12–14]. These methods usually start with a matrix of gene expression and output the grouping of cells. Many algorithmic factors can affect the performances of the cell clustering methods, including data preprocessing [15], normalization [16, 17], feature selection, dimension reduction [18], cell-to-cell similarity calculation, etc. Among them, feature selection is an important step which could have significant impact on the overall performance of cell clustering.
Although feature selection is implemented in most scRNA-seq clustering tools, it is not clear how different selection procedures will impact the results. Despite some efforts that have been made to systematically compare and evaluate methods for data normalization [19, 20], dimension reduction [21] and cell similarity metrics [22] in scRNA-seq, there is no study specifically focused on the impact of feature selections. In this work, we comprehensively evaluate and compare the impact of feature selection on cell clustering in scRNA-seq. To the best of our knowledge, this is the first work to systematically evaluate and compare the impact of feature selection approaches on cell clustering accuracy. In addition, we also develop an algorithm, named FEAST (FEAture SelecTion), which selects representative genes for scRNA-seq cell clustering. We compare FEAST with the feature selection approaches implemented in existing clustering tools through extensive benchmark tests. We demonstrate that FEAST can select more representative features than other approaches. Moreover, we demonstrate that using features selected FEAST with existing clustering tools can significantly improve the clustering accuracy.
Feature selection in scRNA-seq cell clustering
The scRNA-seq experiment produces expression levels for the whole transcriptome. A majority of the genes are not differentially expressed among different cell types; thus, they contain no information for cell clustering. The feature selection step selects a subset of genes best representing the structures of the dataset in a lower-dimensional space, which enhances the signal to noise ratios and subsequently improves the cell clustering results. Since the cell grouping is unknown before clustering, the feature selection has to be done in an unsupervised fashion. Simple metrics based on quantities related to the statistical moments of the gene expressions are often used in most methods. We conduct a comprehensive review on the feature selection algorithms in existing cell clustering methods, summarized In Table 1. To be specific, both Seurat [10] and PanoView [23] first groups genes into 20 bins according to the mean expressions, and then selects the most variable genes, termed as highly variable genes (HVGs), within each bin. SC3 [9] filters out ubiquitous and rarely expressed genes to retain informative genes based on mean expression levels and dropout rates. Monocle [24] selects genes based on minimum mean expression and variance. SCANPY [25] identifies a set of HVGs by using normalized dispersions in the preprocess across different batches. scVI [26] selects top-ranked gene by variance. TSCAN [11] finds featured genes by considering both dropout rates and coefficient of variation (CV). SAIC [27] first filters out low-expressed genes and selects genes deviated from the fitted loess regression between CV and mean. SCENT [28] retrieves a set of most variable genes by singular value decomposition (SVD). SOUP [29] obtains the most informative genes from two approaches: sparse principal component analysis (SPCA) [30] algorithm and Gini index, which is also adopted in DESCNED [31]. FiRE [32] first filters out genes with low expression levels and high dropout, and then selects the top 1000 genes with the largest normalized dispersions. SINCERA [33] also first removes genes with low expression and high dropout, and then defines a cell specificity index based on the scaled expression to further filter out uninformative genes. RaceID3 [34] finds the featured genes exceeding the estimated variability from the fitted second-order polynomial functioning on the mean.
Feature selection methods implemented in different scRNA-seq clustering algorithms
| scRNA-seq clustering method | Reference | Quantities used for feature selection |
|---|---|---|
| Seurat | [10] | |$\mu$| and |$\phi$| |
| PanoView | [23] | |$\mu$| and |$\phi$| (similar to Seurat) |
| SC3 | [9] | |$\mu$| and |$\delta$| |
| Monocle | [24] | |$\mu$| and |${\sigma}^2$| |
| SCANPY | [25] | |$\phi$| |
| scVI | [26] | |${\sigma}^2$| |
| TSCAN | [11] | |$\delta$| and |$CV$| |
| SAIC | [27] | loess regression between |$\mu$| and |$CV$| |
| SCENT | [28] | |$SVD$| |
| SOUP | [29] | Gini index and |$SPCA$| |
| FiRE | [32] | |$\mu, \delta$|and |$\phi$| |
| SINCERA | [33] | |$\mu$|, |$\delta$| and cell specificity index |
| RaceID3 | [34] | Second-order polynomial between |${\sigma}^2$| and |$\mu$| |
Mean is denoted as |$\mu .$| Variance is denoted as |${\sigma}^2.$| Dispersion is denoted as |$\phi .$| Coefficient of variation is denoted as |$\mathrm{CV}.$| Dropout rate is denoted as |$\delta .$| SPCA means the sparse PCA algorithm. SVD means the singular value decomposition.
In addition to these moment-based approaches, there are other relatively more complicated methods for feature selection in high dimensional data. For example, Laplacian Scores [37] evaluate the feature importance by constructing a local weighted graph. Moreover, some unsupervised approaches can be modified as the supervised approaches assuming the cell grouping is known. For instance, both Fisher Scores [38] and F-test statistics assess the efficiency of discrimination based on the fractions of between-group variance and within-group variance. If initial cell partitions are predetermined, one can use statistical test based approaches such as Fisher Scores and F-statistics to select the significant features. When preparing the manuscript, we found a method named FEATS [35] that just came out recently. FEATS uses F statistics to rank the features and optimizes a feature set by using silhouette coefficient [36] based on the initial hierarchical clustering outcomes.
Feature evaluation in scRNA-seq cell clustering
How to evaluate the quality of the feature set is another important problem. A straightforward assessment is the clustering accuracy if the reference labels (true classes for cells) are available. There are several metrics for clustering accuracy: adjust Rand index (ARI) [39], normalized mutual information (NMI) [41], Jaccard similarity index [42], Fowlkes–Mallows index [40], normalized information distance [43] and purity [44]. Without reference labels, it is more difficult to validate the quality of the selected features in an unsupervised manner. In this case, one can resort to a ‘pseudo-supervised’ way, that is, to look at the ‘separation’ of the clusters from the result based on selected features. The separation can be defined based on the average distance among the cluster centroids, or the mean squared distances between individual cells and the cluster centroids, or the combination of them. A set of features is deemed better if it leads to clusters with larger between-group and smaller within-group distances.
Result
We comprehensively evaluate several existing scRNA-seq clustering methods in a number of datasets (Supplementary Table S1) and find that feature selection has a significant impact on the cell clustering results. To better assist the existing scRNA-seq clustering algorithm, we develop the FEAST framework (https://github.com/suke18/FEAST) that produces a representative feature set to improve the clustering accuracy. To provide a quick summary, FEAST first performs a consensus clustering to get initial cell clusters. Features are then ranked and selected based on the initial clusters. Optimal number of features is determined by the fitness of the clustering results from different numbers of top features. The output of FEAST is a list of features that can be fed into the existing cluster methods. We systematically compare features selected by FEAST with other unsupervised feature selection methods implemented in existing cell clustering tools. We demonstrate that the FEAST can identify more representative features and significantly improve the clustering accuracy.
Overview of FEAST
FEAST is a tool solely designed for scRNA-seq feature selection and works with any existing cell clustering method. Users can use FEAST to replace the feature selection step provided in existing cell clustering methods and obtain improved results. The FEAST workflow includes three major steps, as illustrated in Figure 1. First, it implements a computationally efficient algorithm to obtain a consensus cell clustering (Figure 1A). This unique consensus clustering step allows the detection of the most confident cell clusters, which improves the feature selection in the next step. Second, based on the consensus clusters, it calculates the significance for each feature via F-test and ranks the features according to the F-statistics (Figure 1B). Third, it finds an optimal feature set through a feature evaluation algorithm (Figure 1C). We provide a detailed description for each step in the Method section.
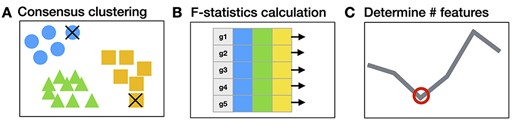
The overall FEAST workflow. FEAST includes three major steps: (A) it performs consensus clustering to find clusters with high confidence, the cell that is less correlated with the clusters are filtered out as indicated by the ‘|$\times$|.’ (B) It calculates the feature significance based the initial clusters. (C) It determines the optimal size of the feature set through a validation process.
Datasets
We collect 12 public scRNA-seq datasets (Supplementary Table S1) for evaluating the impact of feature selection on clustering and benchmarking the performance of FEAST. These datasets are obtained from different sources, including https://hemberg-lab.github.io/scRNA.seq.datasets, https://portal.brain-map.org/atlases-and-data/rnaseq and Gene Expression Omnibus from the National Center for Biotechnology Information (NCBI-GEO) [45]. It is noted that the cell type information for these collected datasets is either obtained by experimental validation such as fluorescence-activated cell sorting or annotated by well-known cell-type-specific marker genes. All datasets include the raw count gene expression matrix as well as the cell type labels, which enable the evaluation and comparison of methods.
Consensus clustering improves the signal
As discussed before, feature selection in existing methods are mostly based on the first and second moments of the gene-wise expression distribution. We found that this procedure can select wrong features, for example, a gene with high marginal variance can be caused by the large within cell-type variation. We design an algorithm to convert the unsupervised feature selection problem into a supervised fashion. To be specific, we first cluster the cells to generate initial clusters and then detect features based on these initial clusters. The initial clustering from this approach plays an important role. A biased cluster will obviously lead to poorly selected features. FEAST implements a consensus clustering procedure (details in the Method section) to find clusters with high confidence, and then computes the feature significance based on the cells in the consensus clusters. Here, we show that this consensus clustering step can improve the signals.
Figure 2 shows the distribution of the statistical significance of all genes when comparing their expression across clusters. As a comparison, we benchmark the results from using K-means to determine initial clusters. Results from two embryo development datasets Yan (Figure 2A) and Deng (Figure 2B) are shown. To be specific, we apply both K-means and consensus clustering on each dataset to obtain the clustering. Then for each gene, we perform F-test to compare the expression levels cross clusters. These figures show that the P-values from the consensus clustering in FEAST are more significant than those from K-means, that is, there are more genes with P-values closer to 0. Additionally, we investigate the distributions of F-statistics (Supplementary Figure S1) from these two approaches and obtain a similar finding that the consensus clustering can improve the separation signal by showing higher F-statistics values than K-means. These results demonstrate that the consensus clustering procedure provides ‘tighter’ clusters and more distinctive features (ones that show greater difference among clusters).
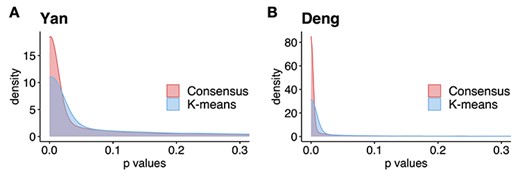
Consensus clustering improves the separation signals. Results are shown for two embryonic development datasets: Yan (A) and Deng (B). We use consensus clustering from FEAST and K-means to determine initial clusters. Then, we calculate the feature significance by F-test. The results demonstrate that the P-values from the consensus clustering are more significant.
FEAST selects features better than other unsupervised approaches
After obtaining the initial cell labels from consensus clustering, FEAST selects the top features based on F-test statistics. We systematically compare the top-|$m$| features generated by FEAST with the other three feature selection procedures implemented in SAIC, SC3 and Seurat. Specifically, for SAIC, we select the genes that are most deviated from the fitted loess regression between CV and mean. For SC3, we filter out the rarely and ubiquitously expressed genes and select the top genes based on expression levels. For Seurat, we adopt the FindVariableFeature function inside the Seurat R package to select the top genes. We purposely fix the number of top features for each approach and evaluate the feature quality via cell clustering. Specifically, we select top-|$m$| |$(m=500,1000\kern0.5em \mathrm{and}\ 2000)$| and perform the clustering by SC3 on a series of test datasets (Supplementary Table S1). It is noted that SC3 allows users to specify the input number of clusters. For the evaluation and comparison, we assume that the number of the true cell types is known. We use the ARI value as a metric to compare the cell clustering results with features selected from different methods.
These comparison results are summarized in Figure 3, where each panel represents a test dataset, and each group of bars corresponds to the ARI values from using a certain number of the top |$(m=500,1000\kern0.5em \mathrm{and}\ 2000)$| features. The results show that the FEAST has the best performance compared with other feature selection methods. Out of the 12 datasets, FEAST shows the highest ARI values in 11 of them. The performance gain can be substantial, for example, in Goolam, Treutlein and LGd data. Even in the Nestorowa data where FEAST result is not the best, its performance is comparable with other methods. The features selected by Seurat show the second-best performance overall. It also shows that genes selected by SAIC could lead to poor ARI values such as in Close, Treutlein and Zheng datasets. Additionally, we also compare FEAST to the feature selection approaches implemented in raceID3, scVI and SOUP. It is demonstrated that features selected by FEAST lead to better cell clustering results compared to the features selected by the other approaches (Supplementary Figure S2).

The comparison of the feature selection methods. We benchmark FEAST with other three unsupervised feature selection procedures implemented in SAIC, Seurat and SC3. In each test dataset, we select the top 500, 1000 and 2000 features from each criterion followed by SC3 clustering. FEAST outperforms the other methods in almost all the scenarios by showing the highest ARI values in 11 out of 12 datasets.
We further inspect the features selected by other unsupervised approaches including kurtosis and CV, and find that the top selected genes show extremely high expression in only a few cells while remaining the same (usually 0) in the rest of the cells (Supplementary Figure S3). These are the ones with highly skewed expression distribution, and clearly not good features for clustering. These bar plots in Figure 3 also indicate that including more features does not necessarily lead to a better clustering performance; for example, the performances decrease from m = 1000 to m = 2000 in Goolam, and Romanov datasets. Overall, these results show that FEAST can select better features than the other approaches with respect to cell clustering accuracy.
FEAST optimize the feature set through validation
Above we show that FEAST outperforms other methods in top-m features. In addition, to provide a better ranking for the genes, a good feature selection method also needs to determine an optimal number of genes to be included in the final feature set. For the second part, FEAST implements a validation process to determine the number of features. Details of the method are provided in the Method section. Briefly, FEAST selects a series of top-m (m = 20, 50, 100, 200, 500, 1000, 2000, 5000 and all genes) features based on consensus clustering and then conducts clustering using the different number of features. Then, FEAST assesses the goodness of fit of the clustering results and determines the optimized number of features.
We benchmark the method on two datasets, the Zheng dataset which contains eight well-annotated PBMC types, and Deng dataset which includes six adult liver cell types. In Figure 4A and C, each curve represents a metric for evaluating the clustering results from SC3 under the different number of top features. The conclusions from these metrics overall agree with each other. For example, in the Zheng data, with the increasing number of input features (m = 50–1000), the clustering accuracy also increases. Specifically, the ARI increases from 0.33 to 0.74 and the NMI increases from 0.48 to 0.80. However, after reaching the peak at m = 2000 (ARI = 0.75 and NMI = 0.81, respectively), the accuracy curve plateaus until using 5000 features, and becomes lower is using all genes. This indicates that including more features will not necessarily improve the clustering accuracy.
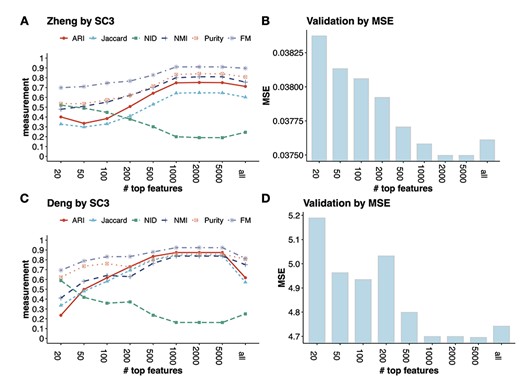
The validation process used in FEAST to determine the optimal number of features. In both Zheng and Deng datasets, FEAST selects the top-m (m = 20, 50, 100, 200, 500, 1000, 2000, 5000 and all genes) features, and performs cell clustering by SC3. For different m, (A) and (C) show the clustering accuracy measurements, (B) and (D) show the MSE which represents the goodness of fit of the clustering results. We find that the lowest MSE results (B and C) agree with the best clustering accuracy (A and C).
For many datasets where the true cell labels are unavailable, we adopt a criterion based on the mean squared errors (MSE) of clustering (details in Method section) to assess overall clustering fitness and select the optimal number of features. Figure 4B and D shows the MSE values from the clusters based on different numbers of top features. We find that the MSE reaches the lowest level at |$m=2000$| for the Zheng data, which matches the best clustering accuracy result in Figure 4A. In the Deng data, we find the lowest MSE result is concordant with the best clustering accuracy at |$m=1000$|. These results show that the MSE criteria works well in selecting the optimal number of features.
Additionally, we also perform the above analyses using TSCAN as the clustering method (Supplementary Figure S4). We obtain similar findings that the optimized feature set in general matches with the validation procedure by MSE. It is noted that we utilize TSCAN or SC3 for clustering, which allows to specify the number of clusters (|$k$|). The user can also adopt their favorite scRNA-seq algorithm on the selected feature sets but need to keep the same |$k$| for fair comparison and evaluation.
FEAST improves the clustering accuracy
We systematically evaluate the performance of FEAST on 12 publicly available scRNA-seq datasets (Supplementary Table S1). These datasets cover a wide range of sample sizes (from tens to thousands of cells), as well as from different sequencing technologies such as smart-seq2 [46], 10x Genomics, and inDrop [47]. In each dataset, we utilize FEAST to select features, which are obtained through the MSE validation process of using the top-m (m = 500, 1000, 2000) features. Then, we feed the optimal feature set into SC3 for cell clustering. We compare these results to the default setting in SC3, which selects features based on mean expression and dropout rates. The clustering ARI values from default SC3 and SC3 with FEAST features are summarized in Figure 5. For all datasets, features selected by FEAST results in better clustering ARI. In all 12 datasets, the ARI is increased by 0.19 on average, indicating a significant improvement. In some datasets, the ARI values increase dramatically with specified FEAST features. For example, in Goolam dataset, the ARI values increase from 0.65 to 0.93. Similar improvements are also observed in Treutlein, LGd, and Deng datasets (Supplementary Table S2). To demonstrate the broad applicability of FEAST, we perform the same analyses using three other clustering methods: TSCAN, SHARP [48], and SIMLR [49]. We observe significant improvements in clustering accuracy in all methods. The results are summarized in Supplementary Figures S5–S7.
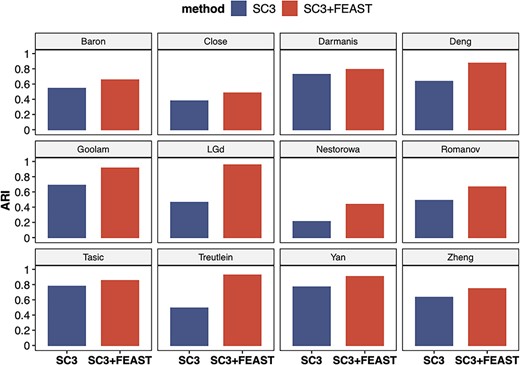
FEAST improves the clustering accuracy with existing method. The figures show ARI values for 12 public datasets. For each dataset, we compare the results from SC3 and SC3 with FEAST selected features. For all datasets, we observe significant improvement in ARI using SC3 with FEAST features.
Note that all the above tests are well-controlled: the only difference between the blue and red bars is the feature selection procedure. Even though these clustering tools implement different methods and perform differently at different datasets, we show that using features selected by FEAST can instantly improve the clustering accuracy. Taken together, we show the superior performance and broad applicability of FEAST, regardless of the clustering method, experimental protocol (full-length or 3′ end sequencing) and size of the dataset.
Test FEAST on larger datasets
Furthermore, we test the performance of FEAST on relatively larger datasets. The purpose is to evaluate the computational scalability and the robustness of the algorithm when there are more cells and cell types. We analyzed three public datasets (Supplementary Table S3), which contains ~28 k cells and ~28 cell types on average. For these tests, we use SHARP as the clustering method since it’s specifically designed for large datasets. Again, we observe significantly improved ARI values using the features selected by FEAST (Figure 6). These results suggest that FEAST is robust and efficient, and work well for large datasets.
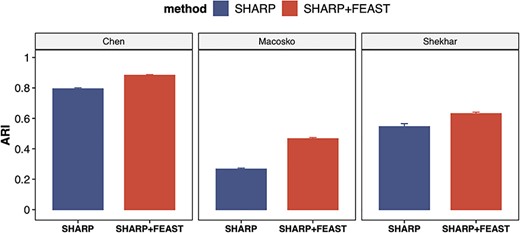
FEAST improves the clustering accuracy on larger datasets. We investigate three datasets with ~28 k cells and ~28 cell types on average. For each dataset, we compare the results from SHARP and SHARP with FEAST selected features. For all datasets, we observe significant improvement in ARI.
FEAST is implemented as an open-source R package and freely available at https://github.com/suke18/FEAST. As a feature selection tool, it can serve as a plug-in for established scRNA-seq clustering methods. FEAST offers excellent computational performance. We profile the computational performance of FEAST for a wide range of sample sizes (100–50 000 cells). Results are shown in Supplementary Figure S8. It is important to note that the computational burden does increase exponentially with the increasing number of cells, due to the first step of consensus clustering in the algorithm. However, with efficient implementation, FEAST still provides excellent computational performance and will handle a majority of the tasks. For example, the feature selection step takes less than 1 min for 10 000 cells and takes less than 4 min for 50 000 cells. The validation process requires running clustering for the different number of top features; thus, its performance depends on the clustering method itself.
Method
Preprocess and normalization
We preprocess the raw gene expression data as the following. First, genes with all zero read counts and low expression rates (|$\delta$|) are filtered out. The default threshold for |$\delta$| equals to 2 divided by the total number of cells. It is common to observe some genes are only expressed in very few (one or two) cells in 10× and inDrop data, which are not informative for cell clustering. We do not remove the ubiquitously expressed genes and use a relatively conservative threshold for |$\delta$| because we intend to keep more features for further selection. Next, we normalize the count matrix by cell-specific size factors, which are calculated based on the sequencing depths, and take a |$\log 2$| transformation on the normalized counts.
The consensus clustering
With the preprocessed gene expression matrix (|$Y$|) of |$G$| genes and |$N$| cells, FEAST utilizes the cluster-based similarity partitioning algorithm (CSPA) [41] to create a consensus matrix. Specifically, FEAST first performs principle component analysis (PCA) to obtain a sequence of principal components (PCs). For each of the top-|$i$| (|$i=2,3,\dots$|) PCs, FEAST fits a Gaussian Mixture Model (GMM) to cluster the cells into |$k$| groups. Each clustering result is represented by a binary |$N\times N$| matrix, where the corresponding cell unit is 1 if two cells belong to the same cluster, and 0 otherwise. By default, FEAST examines till top 10 PCs because we purposely cover a relatively large number of PCs to account for variabilities from different directions in the covariance matrix. Next, FEAST construct a consensus matrix by averaging all the similarity matrices. The final clustering labels are obtained by fitting another round of GMM on the consensus matrix. Only cells with posterior probability of belonging to a cluster greater than 0.95 are kept in the final clusters.
The consensus clustering is similar to the procedure implemented in SC3. It only retains cells that are tightly clustered together and exclude the ones whose cluster membership cannot be determined with high confidence. As shown in the Result section (Figure 2), this step enhances the signal in the data, which subsequently helps to identify features.
Select and rank the features
Here, |$d{f}_1$| and |$d{f}_2$| are degrees of freedoms calculated as |$K-1$| and |${N}^{\prime }-K$|, respectively, where |${N}^{\prime }$| is the total number of cells in the consensus clusters (|${N}^{\prime}\le N$|). FEAST uses the difference between total variance (|$\mathit{\operatorname{var}}{t}_g$|) and between-group variance to represent within-group variance, where |$\mathit{\operatorname{var}}{b}_g$| is calculated as |${\sum}_{i=1}^K{n}_i\times{\Big({\overline{Y}}_g-{\overline{Y}}_{gi}\Big)}^2$| and |$\mathit{\operatorname{var}}{t}_g$|is calculated as |${\sum}_{j=1}^{N^{\prime }}{\Big({\overline{Y}}_g-{Y}_{gj}\Big)}^2$|. |${\overline{Y}}_g$|is the average expression for gth gene, and |${Y}_{gi}$| is the expression value for the gth gene and ith cell. |${\overline{Y}}_{gi}$|and |${n}_i$| denote the mean and sample size for the ith cluster, respectively.
Determine the optimal number of features
Unsupervised feature set validation is challenging without a properly predefined optimization criterion. FEAST uses the MSE to evaluate the clustering results. The MSE represents the average distances between cells and the cluster centroids, which is a good representation of the goodness of fit. To be specific, with the obtained clustering labels, FEAST fits simple linear regression between the normalized gene expression and the clustering outcomes. Then, FEAST computes the MSE from the regression residuals, which represents the mean squared distance of each data point to its assigned cluster center. For each clustering outcome with a different feature set, FEAST calculates an MSE. The feature set associated with the smallest MSE is recommended as the optimal feature set.
The feature selection in clustering is similar to the variable selection problem, i.e., one tries to identify a subset of variables to best predict the classification outcomes. Since the clustering is unsupervised, it is difficult to evaluate which set of variables is the best without knowing the outcome. In this case, MSE, which represents the model fitting, is a reasonable choice for evaluating the variable selection result. It is worth noting that the MSE is calculated from all genes and all cells, even though the features are selected based on a subset of cells and the predicted cluster is based on a subset of genes (the selected features). This ensures fair comparisons for different clustering outcomes and avoids over-fitting of the data. Our real data analyses demonstrate that this approach can select an optimal set of features, i.e., the feature set with the smallest MSE usually corresponds to the best clustering results.
Discussion
In scRNA-seq clustering, selecting a desirable feature set before performing clustering is very important because the features will have a significant impact on the clustering outcomes. Particularly, a feature set including excessive non-informative genes or lacking marker genes will result in poor clustering accuracy. Even though numerous clustering algorithms tailored for scRNA-seq have been developed and widely used in the community, the importance of the feature selection step has not been thoroughly investigated. Currently, almost all clustering methods include a feature selection step, mostly based on thresholding some simple statistics, for example, to use the top 2000 HVGs, or to choose genes with low dropout rate and high average expression. It is unclear how much the feature selection will impact the cell clustering accuracy, and whether better-selected features can improve the cell clustering result.
The major contribution of this work is 2-fold. First, we carefully evaluate and compare the impacts of feature selection on cell clustering by comprehensive data analysis. Secondly, we design a new algorithm named FEAST for selecting an optimal set of features. FEAST can work as a plug-in tool for existing clustering methods. We systematically compare FEAST with other common feature selection methods and demonstrate that FEAST outperforms other methods in selecting more representative features, which subsequently improves clustering accuracy. We show that the improvement brought by the FEAST features is not limited to the clustering method, i.e., we observe significant improvements using a number of existing cell clustering tools including SC3, TSCAN, SHARP and SIMLR. These results show that researchers can first run FEAST to obtain a set of features then feed them to established scRNA-seq clustering algorithms, which will likely improve the clustering accuracy. Moreover, based on our experiences, selecting top 1000 or 2000 features from FEAST usually give satisfactory results. So, if computational time is a concern, we recommend users take top 1000 features as the final feature set.
Determining the number of clusters (K) is an important step in cell clustering. Some clustering software tools such as SC3, TSCAN and CIDR provide the function for estimating K, but the clustering functions in these tools require users to specify a fixed K. FEAST does not provide the function for estimating K. It works merely as a feature selection tool for cell clustering, and the users need to provide K. On the other hand, users can use methods implemented in current software tools or prior knowledge to estimate K.
The current FEAST frame, similar to most other clustering methods, selects features based on the given dataset. It is possible to incorporate existing biological knowledge on marker genes into the feature selection algorithm. For example, we can impose a prior on the features and formula the problem in a Bayesian framework. In addition, even though the clustering put cells into several distinct, exchangeable groups, the cell types form a hierarchical tree in reality. With the consideration of such hierarchical structure, it might be better to use a different set of features at each branching point and perform clustering in a top-down, step-wise manner. Furthermore, a new paradigm of cell type identification has recently gained much attention [50, 51]. Those methods do not cluster the cells. Instead, they assign each cell to a particular cell type, based on a reference panel. We believe feature selection will also play an important role for those methods, and FEAST can potentially be used to improve those methods. These interesting questions are all on our future research plan.
Author Contributions
This project was conceived by H.W. K.S. implemented and improved the method, and ran all the benchmark analyses. All authors discussed the results and commented on the manuscript.
In scRNA-seq clustering, feature selection is an important step that can have significant impact on the clustering accuracy. All state-of-art scRNA-seq clustering tools have a step for identifying featured genes.
We comprehensively review and evaluate the feature selection methods implemented in existing clustering tools.
We develop a feature selection method FEAST. Users can first apply FEAST to obtain a list of feature genes, and then use them as input for exiting scRNA-seq clustering tools.
We show through extensive tests that using FEAST features with exiting clustering tools significantly improves the clustering accuracy.
Funding
This work has been supported by R01GM122083, R01GM124061 and P50AG025688 to H.W., and the startup grant from Shenzhen Research Institute of Big Data (SRIBD) to T.Y.
Kenong Su is a PhD candidate in the Department of Computer Science, Emory University.
Tianwei Yu is a Professor in the School of Data Science, The Chinese University of Hong Kong, Shenzhen.
Hao Wu is an Associate Professor in the Department of Biostatistics and Bioinformatics, Emory University.
References
Wan S, Kim J, Won KJ. SHARP: hyper-fast and accurate processing of single-cell RNA-seq data via ensemble random projection.
