


Abstract
Contigs assembled from the third-generation sequencing long reads are usually more complete than the second-generation short reads. However, the current algorithms still have difficulty in assembling the long reads into the ideal complete and accurate genome, or the theoretical best result [1]. To improve the long read contigs and with more and more fully sequenced genomes available, it could still be possible to use the similar genome-assisted reassembly method [2], which was initially proposed for the short reads making use of a closely related genome (similar genome) to the sequencing genome (target genome). The method aligns the contigs and reads to the similar genome, and then extends and refines the aligned contigs with the aligned reads. Here, we introduce AlignGraph2, a similar genome-assisted reassembly pipeline for the PacBio long reads. The AlignGraph2 pipeline is the second version of AlignGraph algorithm proposed by us but completely redesigned, can be inputted with either error-prone or HiFi long reads, and contains four novel algorithms: similarity-aware alignment algorithm and alignment filtration algorithm for alignment of the long reads and preassembled contigs to the similar genome, and reassembly algorithm and weight-adjusted consensus algorithm for extension and refinement of the preassembled contigs. In our performance tests on both error-prone and HiFi long reads, AlignGraph2 can align 5.7–27.2% more long reads and 7.3–56.0% more bases than some current alignment algorithm and is more efficient or comparable to the others. For contigs assembled with various de novo algorithms and aligned to similar genomes (aligned contigs), AlignGraph2 can extend 8.7–94.7% of them (extendable contigs), and obtain contigs of 7.0–249.6% larger N50 value and 5.2–87.7% smaller number of indels per 100 kbp (extended contigs). With genomes of decreased similarities, AlignGraph2 also has relatively stable performance. The AlignGraph2 software can be downloaded for free from this site: https://github.com/huangs001/AlignGraph2.
1 Introduction
The next-generation sequencing technologies can produce reads of a genome with very small cost and very short time. The second-generation sequencing technologies such as the Illumina HiSeq/MiSeq can produce short reads of several hundred bases long and about 99% accuracy, while the third-generation sequencing technology such as the PacBio Single Molecule Real-Time (SMRT) and Oxford Nanopore (ONT) can produce long reads of 5–15K bases long and about 87% accuracy [3, 4]. Recently, the PacBio Circular Consensus Sequencing technology (CCS) can produce much accurate High Fidelity (HiFi) long reads of the same lengths but about 99% accuracy [5]. These advances provide great opportunities to produce reads of various species, assemble the reads, and obtain the whole genome sequences, which are widely used in biomedical research, drug discovery and clinical medicine [6–9]. Currently, more and more whole genome sequencing projects choose to use the long reads alone, because the long reads’ much larger lengths and improved accuracy can result in more complete and accurate assemblies than the short reads [10–13].
To assemble the long reads into contigs, several assembly algorithms are available and can be divided into two categories.
Overlap-Layout-Consensus based algorithms. HGAP [14] is among the first assembly algorithms in this category. It uses the BLASR alignment algorithm [15] to align the long reads with each other, and then constructs an overlap graph from the alignments and traverses the graph for the contigs. PBcR [16], Canu [10] and MECAT [11] also construct an overlap graph, but PBcR and Canu use the MHAP alignment algorithm [17], and MECAT has its own alignment algorithm mecat2pw. MHAP builds a sketch of |$k$|-mers in each long read, and then aligns the long reads by calculating the sketches’ Jaccard similarity values. Different from PBcR, Canu makes TF-IDF statistics for the |$k$|-mers for more accurate sketches. Mecat2pw counts number of |$k$|-mer pairs appearing in two long reads with similar distances as an indicator of their alignment possibility. FALCON [13], HINGE [18] and Miniasm [19] align the long reads with the Daligner [20] or minimap2 [21] alignment algorithm and construct an overlap graph, but they have different characteristics in generating the contigs. FALCON generates contigs with haplotype information in the first pass, and then generates haplotype-separated contigs. HINGE marks repeats in the long reads, and then resolves the repeats in generating contigs. Miniasm uses Racon in downstream to correct errors in contigs. Specifically designed for HiFi long reads, Hifiasm [22] aligns the long reads with the bit-vector algorithm [23], and can also generate haplotype-separated contigs.
De Bruijn graph based algorithms. A-Bruijn [24] constructs an A-Bruijn graph, a variant of the conventional de Bruijn graph [25], and traverses the graph for the contigs. Different from the de Bruijn graph, the A-Bruijn graph only uses solid |$k$|-mers in the long reads as the vertices. Flye [26], as a wrapper of A-Bruijn, uses A-Bruijn’s contigs to construct a second assembly graph, simplifies the graph, and generates more complete contigs. Wtdbg2 [12] constructs a fuzzy-Bruijn graph, a variant of the de Bruijn graph, and traverses the graph for the contigs. Different from the de Bruijn graph, the fuzzy-Bruijn graph has a vertex for each |$k$|-bin constructed in this way: every 256 bases in long reads are merged into a bin and four such bins form a |$k$|-bin.
Nevertheless, the current algorithms still have difficulty in assembling the long reads into the complete and accurate genome, or the theoretical best result [1]. Specifically, the algorithms may fail in distinguishing some genome repeats approaching the long read lengths, so could only obtain several hundreds or thousands incomplete contigs. For example, as listed in [13], for A. thaliana long reads, the current algorithms could assemble them into 120–219 contigs, that is, 24–44 contigs per chromosome; for V. vinifera long reads, the current algorithms could assemble them into 591–1066 contigs, that is, 148–267 contigs per chromosome. In addition, the algorithms may introduce the long reads’ sequencing errors into the assembled contigs. For example, as listed in [11, 12], for A. thaliana long reads, the assembled contigs contain 305.5 mismatches and 100.1 indels per 100 kbp; for D. melanogaster long reads, the assembled contigs contain 84.8 mismatches and 742.4 indels per 100 kbp. These problems become more severe when the long reads have relatively low sequencing depth, or the genome is repeat rich.
To solve these problems, it could still be possible to use the similar genome-assisted reassembly method, which was proposed initially for the short reads [2, 27]. This method aligns the reads and preassembled contigs of the sequencing genome (target genome) to a published closely related genome (similar genome), and then extends and refines the aligned contigs with the aligned reads. The similar genome provides a lot of approximate information for the target genome’s assembly, so could improve quality of the assembled contigs to a large extent. Along with development of the sequencing technologies, more and more species are fully sequenced, so the similar genome could usually be obtained easily from a public database. Based on the similar genome-assisted reassembly method, AlignGraph [2] and ReMILO [28] proposed by ourselves reassemble the aligned short reads to obtain more complete and accurate contigs. In addition, misFinder [29] analyzes patterns of the aligned contigs and short reads to detect misassemblies. The similar genome-assisted method is similar but not identical to the synteny-based scaffolding method, which builds scaffolds for preassembled contigs with a single or multiple similar genomes. Some representative algorithms of the latter include OSLay [30], RACA [31], Ragout [32] and Ragout2 [33].
In this paper, based on the similar genome-assisted method, we propose AlignGraph2, an algorithmic pipeline to extend and refine the long read contigs with a similar genome. With support of the similar genome, the long reads from different repeat regions could be distinguished for more complete contigs, and those from lowly sequenced regions could be more sufficiently aligned with each other for more accurate contigs. The AlignGraph2 algorithm is the second version of AlignGraph algorithm proposed by us but completely redesigned, can be inputted with either error-prone or HiFi long reads, and has the following innovations.
For the alignments of long reads and contigs to the similar genome, it aligns the long reads and contigs taking into consideration various similarities in different regions of the similar genome to the target genome to improve alignment sensitivity and accuracy. For a similar genome region of relatively low similarity to the target genome, it adaptively uses a relatively low alignment identity requirement; for a genome region of relatively high similarity, it uses a relatively high alignment identity requirement. In addition, after the initial alignments, AlignGraph2 filters false alignments by analyzing alignment distances of different alignments to the similar genome to further improve alignment accuracy. For two long read or contig regions’ alignments, it compares their distance to the corresponding regions’ distance as a measure of their accuracy.
For the contig extension and refinement, it reassembles the aligned long reads by constructing a novel data structure called multipositional A-Bruijn graph and traversing it. This graph is a variation of the A-Bruijn graph, and contains alignment positions obtained in the long read and contig alignments. In addition, after the reassembled contigs are obtained, AlignGraph2 fills in gaps of the reassembled contigs by aligning the long reads to the contigs and making consensus taking into consideration various alignment identities in different contig regions. For a long read region of relatively low alignment identity, it adaptively assigns a relatively low weight for the consensus; for a long read region of relatively high alignment identity, it assigns a relatively high weight.
2 MATERIALS AND METHODS
2.1 Overview
The AlignGraph2 pipeline contains a modified mecat2ref alignment algorithm [11] for read alignment and is based on the A-Bruijn graph method [24] for contig reassembly, so as to process error-prone long reads and can also process the HiFi ones. It consists of the following four novel algorithms.
Similarity-aware alignment algorithm aligns the long reads and contigs to the similar genome. It is a modified version of the mecat2ref alignment algorithm and takes into consideration various similarities in different regions of the similar genome to the target genome.
Alignment filtration algorithm filters alignments for each long read or contig region of multiple alignments. It finds the alignment by comparing every two alignments’ distance to the corresponding regions’ distance.
Reassembly algorithm reassembles the aligned long reads to generate more complete contigs than the original ones. It constructs a multipositional A-Bruijn graph from the aligned high-confidence |$k$|-mers and traverses the graph.
Weight-adjusted consensus algorithm fills in gaps of the reassembled contigs. It aligns the long reads to the reassembled contigs and makes consensus taking into consideration various alignment identities in different regions.
In steps 1 and 2, we make quality alignments between the long reads, contigs and similar genome with a similarity-aware alignment algorithm and an alignment filtration algorithm. As a modified version of the mecat2ref alignment algorithm, the former makes alignments by taking into consideration various similarities in different regions of the similar genome to the target genome, and the latter filters false alignments by analyzing distances between them. In steps 3 and 4, based on the alignments from steps 1 and 2, we reassemble the aligned long reads with a reassembly algorithm and a weight-adjusted consensus algorithm. The former reassembles the aligned long reads by constructing a novel data structure called multipositional A-Bruijn graph, and the latter fills in gaps of the reassembled contigs by aligning the long reads and making consensus taking into consideration various alignment identities in different regions. Overview of the AlignGraph2 pipeline is given in Figure 1, and illustrations of the four algorithms are also given in Figure 2 with (A)–(D), respectively.
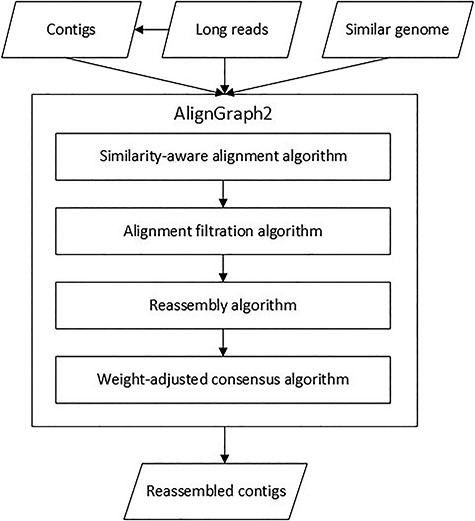
Overview of the AlignGraph2 pipeline. AlignGraph2 is inputted with the initial long reads, assembled contigs from the long reads, and a genome similar to the target genome. AlignGraph2 processes the inputs with four algorithms: similar-aware long read alignment algorithm, alignment filtration algorithm, reassembly algorithm and weight-adjusted consensus algorithm. Finally, AlignGraph2 outputs the reassembled contigs.
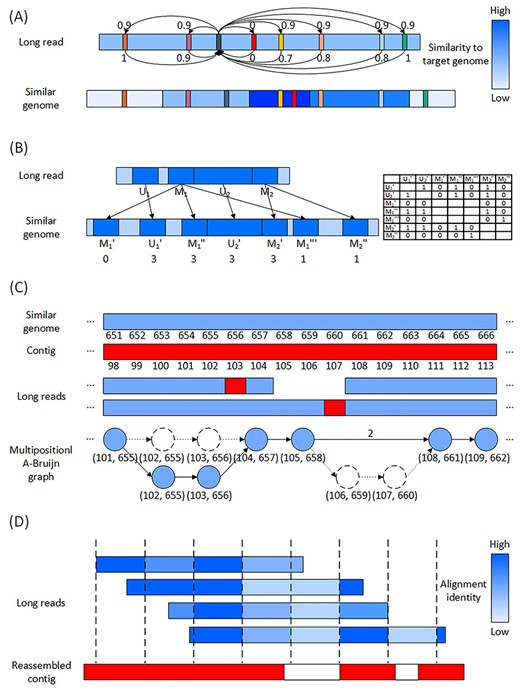
Illustration of the four algorithms in AlignGraph2. (A) Similarity-aware alignment algorithm. The read has a candidate alignment to the similar genome, and different regions of the similar genome have different similarities to the target genome. As shown in the color bar on the right, each similar genome region’s darkness indicates its similarity to the target genome. Different aligned |$k$|-mer are marked in different colors, and the black |$k$|-mer is in a relatively low similarity region, so it adds 0.9 to the other aligned |$k$|-mers, while the other |$k$|-mers add various values to the black |$k$|-mer depending on similarities of their genome regions. The black and red |$k$|-mers do not add any value to each other, because their distances in the long read and similar genome are not close. |$K$|-mer of the highest score is used to represent quality of this candidate alignment. (B) Alignment filtration algorithm. The read has regions |$M_1$|, |$M_2$|, |$U_1$| and |$U_2$| aligned to the similar genome, and region |$M_1$| has three alignments |$M_1^{\prime}$|, |$M_1^{\prime\prime}$| and |$M_1^{\prime\prime\prime}$| in the similar genome, region |$M_2$| has two alignments |$M_2^{\prime}$| and |$M_2^{\prime\prime}$|, and each of regions |$U_1$| and |$U_2$| has one alignment |$U_1^{\prime}$| and |$U_2^{\prime}$|, respectively. The regions and alignments are indicated in dark blue. As shown in the table on the right, the alignments |$M_1^{\prime}$|, |$M_1^{\prime\prime}$|, |$M_1^{\prime\prime\prime}$|, |$M_2^{\prime}$|, |$M_2^{\prime\prime}$| as well as |$U_1^{\prime}$| and |$U_2^{\prime}$| add 1 or 0 to each other, depending on their distances and the corresponding regions’ distances. |$M_1^{\prime\prime}$| and |$M_2^{\prime}$| have the highest scores, so the other alignments |$M_1^{\prime}$|, |$M_1^{\prime\prime\prime}$| and |$M_2^{\prime\prime}$| are filtered as false ones. (C) Reassembly algorithm. The long reads and contig are aligned to the similar genome, and a multipositional A-Bruijn graph is constructed from the aligned long reads. In each vertex of the graph, only the alignment positions are listed for simplicity. The long reads contains sequencing errors indicated in red, and result in missing |$k$|-mers or vertices in the multipositional A-Bruijn graph. The missing vertices (106, 659) and (107, 660) in the lower read are complemented by an edge marked with number of the missing vertices. The missing vertices (102, 655) and (103, 656) in the upper read are complemented in the lower read and thus present in the graph. The graph is traversed to generate the reassembled contigs. (D) Weight-adjusted consensus algorithm. The long reads are aligned to the reassembled contig with gaps in white. The long reads are split into blocks, so that the different regions have different alignment identities, and as shown in the color bar on the right, each long read region’ darkness indicates its alignment identity. The alignment identities are taken into consideration to calculate the consensus, and then to fill in the contig gaps.
2.2 Similarity-aware alignment algorithm
First, we calculate similarities of the similar genome regions to the target genome in various regions with a fast similarity calculation method. Though the target genome is unknown, the long reads contain information of the target genome. |$K$|-mers of the long reads are scanned in a single pass and is recorded in a list. Then the similar genome is split into blocks of the same size |$b$|, and in each block, number of |$k$|-mers appearing in the recorded list is counted (|$b$| is an integer with default value 200). Hence, similarity of a block to the target genome can be calculated by comparing the number of |$k$|-mers in the block appearing in the recorded list and the average number of |$k$|-mers in all blocks. The similarity value is usually about 1 and cannot be too large, because the number of |$k$|-mers in a block appearing in the recorded list is mostly about the average number of |$k$|-mers in all blocks. Formally, let the genome size be |$g$|, and number of |$k$|-mers in the |$i$|th block appearing in the recorded list be |$n_i$|, then the block’s similarity to the target genome |$s_i$| can be calculated as |$\frac{n_i}{\sum _{j=1}^{\lceil g/b \rceil } n_j/{\lceil g/b \rceil }}$|.
Second, we use a modified mecat2ref alignment algorithm to align the long reads or contigs considering the calculated similarity values. Conventionally, the mecat2ref algorithm uses a fast |$k$|-mer scoring method to find high-quality alignments from several candidates. For each alignment candidate, it scores each |$k$|-mer with the other |$k$|-mers in the same long read, and the |$k$|-mer of highest score represents the alignment quality. Specifically, a |$k$|-mer is scored in this way: if the |$k$|-mer and another |$k$|-mer have an alignment distance similar to their distance in the long read, then the |$k$|-mer’s score is added by 1. In our case, to align the long reads or contigs to similar genome, the added score 1 for a |$k$|-mer should be adjusted considering similarity of its block. If the |$k$|-mer’s block has relatively low similarity, its added score should be slightly large for fair comparison to the |$k$|-mers in relatively high similarity blocks; if the |$k$|-mer’s block has relatively high similarity, its added score should be slightly small. Formally, the added score for |$k$|-mers in the |$i$|th block of similarity |$s_i$| is adjusted as |$\frac{1}{s_i}$| if |$\alpha \le s_i \le \beta $|, |$\frac{1}{\alpha }$| if |$s_i < \alpha $|, and |$\frac{1}{\beta }$| if |$s_i> \beta $| (|$\alpha $| and |$\beta $| are real numbers with default values 0.5 and 2.0, respectively). Note that we also use the contig-guided read alignment technique which first aligns the long reads to the contigs by the original mecat2ref, so that more long reads can be aligned to the similar genome along with the contigs’ alignment. This technique was proposed with the initial AlignGraph algorithm, and details are provided in Supplementary materials.
2.3 Alignment filtration algorithm
Though mecat2ref finds high-quality alignments from several candidates, each long read or contig region could still have multiple alignments of similar |$k$|-mer scores, so we further filter false alignments for each long read or contig region with multiple alignments. For each long read, all its regions’ alignments are scored, and each region’s alignment of the highest score is chosen, while the others are filtered as false ones. An alignment is scored in this way: if the alignment and another one have a distance similar to their corresponding regions’ distance, then the alignment’s score is added by 1. Rationale of the scoring method is, if two alignments have a distance similar to their corresponding regions’ distance, they support each other to be quality alignments, and a region’s alignment of the highest support from the other regions alignments should be chosen, while the others should be filtered as false ones. Formally, let two alignments’ distance be |$d$| and the corresponding regions’ distance be |$e$|, then they can add 1 to each other if this equation fulfills |$\left | 1-\frac{d}{e} \right | \leq \delta $| (|$\delta $| is a real number between 0 and 1 with default value 0.9). Note that we also filter long read alignments to a similar genome region of coverage |$\leq v$| (|$v$| is an integer with default value 2).
2.4 Reassembly algorithm
First, we construct a multipositional A-Bruijn graph from the aligned long reads to the similar genome. Conventionally, long read assemblies rely on assembly graphs and two important ones are overlap graph and A-Bruijn graph. The former has a vertex for each long read, and an edge for two aligned long reads. The latter has a vertex for each |$k$|-mer appearing relatively frequently in the long reads, an edge for two such consecutive |$k$|-mers in the same read, and the vertices of same |$k$|-mer are joined. In our case, the reassembled long reads are aligned to the similar genome, and their alignments with each other are not available, so it is difficult to build an overlap graph efficiently. More importantly, some long read regions may not be aligned and some |$k$|-mers are resulted from sequencing errors, so it is accurate to build an A-Bruijn graph with only the aligned high-confidence |$k$|-mers. Therefore, the A-Bruijn graph is chosen as the assembly graph. A limitation of the A-Bruijn graph is, it may contain many branched paths, because its |$k$|-mers from different genome positions could be the same and thus be joined. To address this issue, we apply the idea of multipositional de Bruijn graph [2] to A-Bruijn graph and propose multipositional A-Bruijn graph. The multipostional A-Bruijn graph includes the |$k$|-mers’ alignment positions to the contigs and genome, so can distinguish them to reduce branched paths. The inclusion of |$k$|-mers’ alignment positions in vertices is based on the positional information based branch removal technique. This technique was proposed with the initial AlignGraph algorithm, and details are provided in Supplementary materials. Formally, a vertex of the multipositional A-Bruijn graph is |$(K, p_c, p_g)$|, where |$K$| is the corresponding |$k$|-mer appearing more frequently than |$f\%$| of all |$k$|-mers, |$p_c$| is the |$k$|-mer’s alignment position to the contigs and |$p_g$| is the |$k$|-mer’s alignment position to the similar genome, and two vertices |$(K, p_c, p_g)$| and |$(K^{\prime}, p_c^{\prime}, p_g^{\prime})$| can be joined if they fulfill these constrains |$K$| = |$K^{\prime}$|, |$\left | p_c-p_c^{\prime} \right | < \epsilon $| and |$\left |p_g-p_g^{\prime} \right | < \epsilon $| (|$k$| is an integer with default value 14, |$\epsilon $| is a real number with default value 10 and |$f$| is an integer with default value 80).
Second, we simplify and traverse the multipositional A-Bruijn graph to generate extended and refined contigs [25]. Though many branched paths are removed because of the positional information, there are still branches, so the traversal checks each vertex with several successors, and preferentially chooses the successor of the closest contig and genome positions. If there are several successors of the same contig and genome positions, the traversal chooses the one constructed from the largest number of long reads. After a successor is chosen, the traversal tentatively goes forward, and may switch to another successor if it has difficulty in going through more than |$l$| vertices (|$l$| is an integer with default value 50).
2.5 Weight-adjusted consensus algorithm
We align the long reads to the reassembled contigs by the original mecat2ref, and make consensus for the long reads considering the alignment identities. Conventionally, the long reads aligned to the same contig are aligned with each other, and with the DAGCon (Directed Acyclic Graph Consensus) algorithm, a consensus graph is constructed having a vertex for each aligned long read base, and an edge for two adjacently aligned bases. In the consensus graph, each edge is weighted with number of long reads containing the adjacently aligned bases, and the path of maximum total weight is the consensus. In our case, alignment identity of a long read region indicates quality of the region, and should be taken into consideration for the consensus. Hence, the aligned long reads are split into blocks of the same size |$a$|, and for each long read region, the alignment identity is recorded (|$a$| is an integer with default value 10 000). Then in the consensus graph, each edge is weighted with sum of alignment identities of the long reads forming it, rather than the number of long reads. Formally, let the number of long reads forming an edge be |$m$|, and the |$i$|th long read’s alignment identity be |$d_i$| in a block, then the edge weight can be calculated as |$\sum _{i=1}^{m}d_i$|.
2.6 Software implementation
The AlignGraph2 pipeline was implemented in C/C++ with a Python wrapper. Inputs of AlignGraph2 include long reads, contigs generated from the long reads and a genome similar to the target genome, and output is reassembled contigs. Its parameters are as discussed above and can be customized by users. AlignGraph2’s default number of threads is 16, and the running time and memory usage are 0.1–122.3 h and 16.2–139.2 GB, respectively, in our tests.
3 Evaluation
3.1 Experimental design
Test of long read alignment. To evaluate AlignGraph2’s performance in aligning long reads to similar genomes, we downloaded long reads and target genomes of three species from public databases: S. cerevisiae W303 (12 Mbp), A. thaliana Ler-0 (125 Mbp) and H. sapiens HG002 (3 Gbp). The first two sets of long reads are error-prone and the last set is HiFi. Coverages of the long reads are 117x, 144x and 28x, respectively. For each species, we downloaded three similar genomes (with decreased similarities from the first to the third): S. jurei, S. arboriola and S. eubayanus for S. cerevisiae W303; A. lyrata, A. halleri (scaffolds) and Capsella rubella for A. thaliana Ler-0; P. paniscus, Pongo and Gorilla for H. sapiens HG002. For each similar genome, we aligned the long reads to it with AlignGraph2 and the original mecat2ref algorithm, as well as another two long read alignment algorithms BLASR and minimap2. In addition, in order to make evaluation with known read positions in the target genomes, for each species, we also generated simulated error-prone long reads for S. cerevisiae W303 and A. thaliana Ler-0 and the HiFi ones for H. sapiens HG002 with a long read simulator PBSIM [34]. For each similar genome, we aligned the simulated long reads to it with AlignGraph2 and mecat2ref. To decide true alignment positions for the simulated long reads, we also aligned the target and similar genomes together. All of the compared algorithms were with default parameter settings and 16 threads here, as well as in the following two tests.
Test of contig reassemblies with various de novo assembly algorithms. To evaluate AlignGraph2’s performance in improving preassembled contigs with various assembly algorithms, we used the downloaded long reads and target genomes from the species S. cerevisiae W303, A. thaliana Ler-0 and H. sapiens HG002 as discussed above, and also downloaded long reads and target genome from species D. melanogaster ISO1 (130 Mbp). The long reads are error-prone with coverage 121x. We used similar genomes S. cerevisiae S288C, A. thaliana Col-0, D. melanogaster sitter (fors) and P. troglodytes, respectively. For S. cerevisiae W303, A. thaliana Ler-0 and D. melanogaster ISO1, we assembled the long reads into contigs with several current long read assembly algorithms Canu, MECAT and wtdbg2, and for H. sapiens HG002, we assembled the long reads with Canu, wtdbg2, FALCON and Hifiasm. With each similar genome, we extended and refined the contigs with AlignGraph2. In addition, in order to see AlignGraph2’s performance in ideal situation, we also tested it with the corresponding target genomes of S. cerevisiae W303, A. thaliana Ler-0 and D. melanogaster ISO1 datasets. Finally, we aligned the contigs to the corresponding target genomes to make comparison.
Test of contig reassemblies with various similar genomes. To evaluate AlignGraph2’s performance in improving preassembled contigs with various similar genomes, we used the downloaded long reads and target genomes from the species S. cerevisiae W303, A. thaliana Ler-0, D. melanogaster ISO1 and H. sapiens HG002 as discussed above. For each species, we used four similar genomes (with decreased similarities rom the first to the fourth): S. cerevisiae S288C, S. jurei, S. arboricola and S. cerevisiae YJM1463 for S. cerevisiae W303; A. thaliana Col-0, A. thaliana, A. lyrata and Capsella rubella for A. thaliana Ler-0; D. melanogaster A3, D. melanogaster sitter (fors), D. simulans and D. sechellia for D. melanogaster ISO1; H. sapiens CMT-001, P. troglodytes, P. paniscus and Gorilla for H. sapiens HG002. With each similar genome from S. cerevisiae W303, A. thaliana Ler-0 and D. melanogaster ISO1, we extended and refined the Canu assembled contigs with AlignGraph2, while for H. sapiens HG002, we extended and refined the wtdbg2 assembled contigs. Finally, we aligned the contigs to the corresponding target genomes to make comparison.
3.2 Datasets and performance measurements
The long reads, target genomes and similar genomes used in the tests are listed in Supplementary Table S1. To evaluate AlignGraph2’s performance in alignment, we have the following measurements for the long reads: (1) number of reads; (2) number of aligned reads; (3) number of aligned bases, the number of long read bases from the beginning of alignment to the end; (4) number of matched bases, the number of exactly matched long read bases in the aligned bases; (5) genome coverage, the percentage of genome bases covered by the aligned bases; (6) alignment time, time of alignment with 16 threads; (7) number of true positive alignment bases (TP), the number of aligned bases to a correct position in the similar genome; (8) number of false positive alignment bases (FP), the number of aligned bases to an incorrect position in the similar genome; (9) number of true negative alignment bases (TN), the number of unaligned bases which do not have an alignment position in the similar genome; (10) number of false negative alignment bases (FN), the number of unaligned bases which have an alignment position in the similar genome; (11) sensitivity, |$\frac{TP}{TP+FN}$|; (12) precision, |$\frac{TP}{TP+FP}$|.
To evaluate AlignGraph2’s performance in assembly, we have the following measurements for the contigs: aligned to similar genomes (aligned contigs), contigs which can be extended from the aligned ones (extendable contigs) and contigs obtained from the extendable ones (extended contigs): (13) number of contigs; (14) N50 value, the shortest contig length at 50% of the total contig length; (15) average length; (16) L50 value, number of contigs of lengths equal or longer than N50 value; (17) genome fraction, percentage of aligned bases to target genome; (18) number of mismatches per 100 kbp; (19) number of indels per 100 kbp; (20) number of misassemblies per mbp.
3.3 RESULTS
Results of long read alignment. For the S. cerevisiae W303 long reads, the number of aligned reads, number of aligned bases, number of matches bases and genome coverage are 110 276–164 313, 467 340 298–797 994 549 bp, 355 886 904–629 959 855 bp and 92.8–96.0%, respectively, by mecat2ref, and 120 630–169 509, 661 193 680–943 253 318 bp, 592 608 291–848 700 145 bp and 97.4–99.7%, respectively, by AlignGraph2. Therefore, AlignGraph2 can result in 9.4–13.3%, 18.2–41.5%, 34.7–66.5% and 3.1–5.0% larger numbers of aligned reads, aligned bases, matched bases and genome coverage, respectively, than mecat2ref. Compared to BLASR and minimap2, AlignGraph2 can also result in 44.7–155.7%, 53.8–423.0%, 50.5–495.4% and 6.7–23.8% larger numbers of aligned reads, aligned bases, matched bases and genome coverage, respectively, and is 5–8x faster than BLASR. For the A. thaliana Ler-0 long reads, AlignGraph2 can result in 5.7–31.2%, 5.7–56.1%, 10.9–73.1% and 19.7–36.6% larger numbers of aligned reads, aligned bases, matched bases and genome coverage, respectively, than mecat2ref, BLASR and minimap2, and is 7–10x faster than BLASR. For the H. sapiens HG002 HiFi long reads, similarly, AlignGraph2 can result in 14.5–27.2%, 7.3–19.8%, 11.5–14.7% and 1.5–6.0% larger numbers of aligned reads, aligned bases, matched bases and genome coverage, respectively, than mecat2ref. Compared to BLASR and minimap2, AlignGraph2 has comparable numbers of aligned reads, aligned bases, matched bases and genome coverage, but is 4–8x faster than BLASR. The results of long read alignment are listed in Supplementary Table S2.
In addition, for the simulated S. cerevisiae W303 long reads, the alignment sensitivity and precision are 61.6–74.6% and 91.5–96.1%, respectively, by mecat2ref, and 73.2–80.8% and 90.7–93.2%, respectively, by AlignGraph2. AlignGraph2 is 6.2–11.6% more sensitive than mecat2ref with comparable precision. For the simulated A. thaliana Ler-0 long reads, AlignGraph2 is 9.9–11.8% more sensitive than mecat2ref with comparable precision. For the simulated H. sapiens HG002 HiFi long reads, similarly, AlignGraph2 is 3.6–6.3% more sensitive than mecat2ref with comparable precision. The results of simulated long read alignment are listed in Supplementary Table S3.
Results of contig reassemblies with various de novo assembly algorithms. For the S. cerevisiae W303 contigs, 7–19 are aligned to the similar genome, and 6–10 of them can be extended to 3–5 contigs. The N50, average length, numbers of mismatches per 100 kbp, indels per 100 kbp and misassemblies per mbp of the extendable contigs are 445 553–553 954, 316 855–386 856, 43.1–55.8, 73.5–290.7 and 5.2–17.7, respectively, while those of the extended contigs are 579 898–1047 763, 630 810–777 132, 29.8–48.7, 65.4–82.9 and 5.7–16.5, respectively. Therefore, AlignGraph2 can obtain extended contigs of 26.0–89.1% and 98.2–100.9% larger N50 value and average length, respectively, and of 12.8–31.0% and 5.2–71.5% smaller numbers of mismatches per 100 kbp and indels per 100 kbp, respectively, than the extendable contigs. The extended contigs has comparable numbers of misassemblies per mbp to the extendable contigs. For the A. thaliana Ler-0 and D. melanogaster ISO1 contigs, AlignGraph2 can obtain extended contigs of 7.0–249.6% and 99.7–168.0% larger N50 value and average length, respectively, and of 11.7–72.3% and 22.0–75.4% smaller numbers of mismatches per 100 kbp and indels per 100 kbp, respectively, than the extendable contigs. The extended contigs have comparable numbers of misassemblies per mbp to the extendable contigs. For the H. sapiens HG002 contigs assembled from the HiFi long reads, similarly, AlignGraph2 can obtain extended contigs of 31.9–155.7% and 112.1–134.2% larger N50 value and average length, respectively, than the extendable contigs. The extended contigs have comparable numbers of mismatches per 100 kbp, indels per 100 kbp and misassemblies per mbp to the extendable contigs. For all the contig sets, genome fractions of extendable and extended contigs are quite similar ranging from 15.4% to 88.6%, because the preassembled contigs from long reads usually contain all target genome bases, and AlignGraph2’s extension process do not include many additional bases. The results of contig reassemblies with various de novo assembly algorithms are listed in Table 1. The running time and memory usage in this test are listed in Table S-5.
Results of contig reassemblies with various de novo assembly algorithms
| Assembly method | Contig set | N contigs | N50 | Average length | L50 | N mismatches per 100 kbp | N indels per 100 kbp | N misassemblies per mbp | |
|---|---|---|---|---|---|---|---|---|---|
| (a) Contigs of S. cerevisiae W303 | |||||||||
| Canu | Aligned | 7 | 457 588 | 328 315 | 3 | 55.8 | 78.4 | 18.7 | |
| Extendable | 6 | 457 588 | 376 417 | 3 | 55.8 | 73.5 | 17.7 | ||
| Extended | 3 | 576 696 | 745 986 | 2 | 48.7 | 69.7 | 16.5 | ||
| MECAT | Aligned | 8 | 445 553 | 291 756 | 2 | 55.4 | 280.2 | 11.1 | |
| Extendable | 6 | 445 553 | 316 855 | 2 | 52.7 | 290.7 | 11.6 | ||
| Extended | 3 | 579 898 | 630 810 | 2 | 36.3 | 82.9 | 10.6 | ||
| wtdbg2 | Aligned | 19 | 553 954 | 424 293 | 6 | 44.7 | 124.5 | 6.2 | |
| Extendable | 10 | 553 954 | 386 856 | 3 | 43.1 | 130.6 | 5.2 | ||
| Extended | 5 | 1047 763 | 777 132 | 2 | 29.8 | 65.4 | 5.7 | ||
| (b) Contigs of A. thaliana Ler-0 | |||||||||
| Canu | Aligned | 38 | 11 164 124 | 3170 699 | 5 | 323.5 | 38.8 | 6.7 | |
| Extendable | 18 | 11 164 124 | 6295 311 | 5 | 290.0 | 37.4 | 6.2 | ||
| Extended | 7 | 22 010 905 | 15 898 017 | 3 | 256.0 | 29.1 | 6.3 | ||
| MECAT | Aligned | 53 | 11 152 352 | 2237 314 | 5 | 937.3 | 157.7 | 6.7 | |
| Extendable | 16 | 549 714 | 325 228 | 1 | 2027.6 | 272.3 | 27.4 | ||
| Extended | 6 | 588 000 | 871 541 | 1 | 1398.1 | 89.0 | 24.7 | ||
| wtdbg2 | Aligned | 69 | 6693 746 | 1705 279 | 6 | 460.4 | 62.4 | 5.7 | |
| Extendable | 18 | 3501 951 | 1101 327 | 3 | 588.1 | 63.8 | 9.4 | ||
| Extended | 8 | 12 241 575 | 2461 217 | 2 | 334.3 | 30.5 | 9.3 | ||
| (c) Contigs of D. melanogaster ISO1 | |||||||||
| Canu | Aligned | 52 | 13 627 260 | 1830 831 | 3 | 23.9 | 119.8 | 0.3 | |
| Extendable | 23 | 13 627 260 | 2230 926 | 2 | 18.6 | 89.7 | 0.3 | ||
| Extended | 11 | 21 445 319 | 4681 384 | 2 | 15.4 | 52.0 | 0.3 | ||
| MECAT | Aligned | 38 | 8333 886 | 3185 015 | 4 | 84.4 | 212.3 | 0.2 | |
| Extendable | 10 | 15 931 084 | 7991 736 | 3 | 34.3 | 208.7 | 0.1 | ||
| Extended | 5 | 22 837 126 | 15 955 717 | 2 | 16.7 | 51.3 | 0.2 | ||
| wtdbg2 | Aligned | 38 | 16 699 794 | 3168 544 | 3 | 27.1 | 91.9 | 0.3 | |
| Extendable | 15 | 13 210 545 | 3973 433 | 2 | 21.6 | 98.8 | 0.1 | ||
| Extended | 7 | 16 224 610 | 8489 209 | 2 | 6.0 | 61.5 | 0.1 | ||
| (d) HiFi contigs of H. sapiens HG002 | |||||||||
| Canu | Aligned | 7823 | 27 228 263 | 383 930 | 32 | 132.0 | 99.3 | 0.9 | |
| Extendable | 324 | 5384 744 | 149 495 | 3 | 210.8 | 40.0 | 4.1 | ||
| Extended | 153 | 13 771 028 | 323 127 | 2 | 202.7 | 47.0 | 4.3 | ||
| wtdbg2 | Aligned | 763 | 16 389 496 | 3568 627 | 44 | 102.8 | 29.6 | 0.1 | |
| Extendable | 66 | 19 543 112 | 2914 891 | 4 | 96.2 | 28.9 | 0.1 | ||
| Extended | 31 | 33 979 403 | 6181 610 | 3 | 100.5 | 27.9 | 0.2 | ||
| FALCON | Aligned | 419 | 30 566 990 | 6604 696 | 25 | 142.3 | 258.7 | 0.2 | |
| Extendable | 20 | 10 220 726 | 841 890 | 1 | 169.2 | 256.9 | 2.6 | ||
| Extended | 9 | 13 485 583 | 1862 005 | 1 | 145.7 | 31.6 | 1.7 | ||
| Hiiasm | Aligned | 339 | 98 165 977 | 8900 780 | 12 | 159.9 | 26.6 | 3.8 | |
| Extendable | 43 | 33 233 224 | 11 291 120 | 5 | 199.8 | 26.6 | 6.1 | ||
| Extended | 18 | 77 844 542 | 26 438 918 | 3 | 196.2 | 35.1 | 5.5 | ||
The contigs in tests (a)–(d) are from S. cerevisiae W303, A. thaliana Ler-0, D. melanogaster ISO1 and H. sapiens HG002, respectively, and assembled with various de novo assembly algorithms Canu, MECAT and wtdbg2 in tests (a)–(c) while with Canu, wtdbg2, FALCON and Hifiasm in test (d). In each test, AlignGraph2’s extendable contigs are a subset of aligned ones, and the extendable and extended contigs are compared. The aligned contigs cannot be directly compared to the extended contigs, so the corresponding rows are indicated in gray.
With the corresponding target genomes, AlignGraph can obtain extended contigs of 15.3–261.8% and 109.1–232.1% larger N50 value and average length, respectively, than the extendable contigs. The improvement of N50 value is not as much as the average length, because long extendable contigs approaching full chromosome lengths may not be extended much but the short ones could be extended to a large extent. The extended contigs have 15.3–70.9%, 12.4–83.5% and 7.7–33.3% smaller numbers of mismatches per 100 kbp, indels per 100 kbp and misassemblies per mbp, respectively. The results of contig reassemblies with target genomes are listed in Table S-4.
Results of contig reassemblies with various similar genomes. For the S. cerevisiae W303 contigs, with decreased similarity from S. cerevisiae S288C to S. cerevisiae YJM1463, the number of extendable contigs decreases stably from 6 to 2 and the number of extended contigs from 3 to 1, while the N50 value and average length of extended contigs are still 23.3–61.2% and 96.4–98.2% larger. For accuracy, the numbers of mismatches per 100 kbp and indels per 100 kbp of extended contigs are 12.8–32.4% and 2.1–5.2% fewer, respectively, and the numbers of misassemblies per mbp are also 6.7–39.1% fewer. For the A. thaliana Ler-0 and D. melanogaster ISO1 contigs, with decreased similarity from A. thaliana Col-0 to Capsella rubella and from D. melanogaster A3 to D. sechelia, the number of extendable contigs decreases stably from 18–27 to 2–8 and the number of extended contigs from 7–13 to 1–4, while the N50 value and average length of extended contigs are still 49.2–184.4% and 95.3–152.5% larger. For accuracy, the numbers of mismatches per 100 kbp and indels per 100 kbp of extended contigs are 5.2–37.0% and 8.4–42.1% fewer, respectively, while the numbers of misassemblies per mbp are comparable to the extendable contigs. For the H. sapiens HG002 contigs assembled from the HiFi long reads, with decreased similarity from H. sapients CMT-001 to Gorilla, similarly, the number of extendable contigs decreases stably from 174 to 15 and the number of extended contigs from 68 to 7, while the N50 value and average length of extended contigs are still 5.7–73.9% and 100.4–156.0% larger. For accuracy, the numbers of mismatches per 100 kbp, indels per 100 kbp and misassemblies per mbp of extended contigs are comparable to the extendable contigs. For all the contig sets, genome fractions of extendable and extended contigs are quite similar ranging from 14.4 to 88.6%. The results of contig reassemblies with various similar genomes are listed in Table 2. The running time and memory usage in this test are listed in Table S-6.
Results of contig reassemblies with various similar genomes
| Similar genome | Contig set | N contigs | N50 | Average length | L50 | N mismatches per 100 kbp | N indels per 100 kbp | N misassemblies per mbp | |
|---|---|---|---|---|---|---|---|---|---|
| (a) Contigs of S. cerevisiae W303 | |||||||||
| S. cerevisiae | Aligned | 7 | 457 588 | 328 315 | 3 | 55.8 | 78.4 | 18.7 | |
| K-12 | Extendable | 6 | 457 588 | 376 417 | 3 | 55.8 | 73.5 | 17.7 | |
| Extended | 3 | 576 696 | 745 986 | 2 | 48.7 | 69.7 | 16.5 | ||
| S. jurei | Aligned | 8 | 457 588 | 358 326 | 3 | 71.8 | 77.9 | 14.0 | |
| Extendable | 6 | 457 588 | 281 462 | 2 | 62.1 | 86.5 | 17.8 | ||
| Extended | 3 | 564 253 | 554 452 | 2 | 63.3 | 84.7 | 13.2 | ||
| S. arboricola | Aligned | 8 | 932 379 | 592 383 | 2 | 56.3 | 65.4 | 14.6 | |
| Extendable | 4 | 358 208 | 290 137 | 4 | 40.8 | 79.6 | 12.1 | ||
| Extended | 2 | 577 495 | 570 949 | 2 | 42.2 | 81.0 | 7.9 | ||
| S. cerevisiae | Aligned | 6 | 457 588 | 376 417 | 3 | 55.8 | 73.5 | 17.7 | |
| YJM1463 | Extendable | 2 | 358 208 | 287 791 | 1 | 60.8 | 105.0 | 17.4 | |
| Extended | 1 | 565 182 | 565 182 | 1 | 41.1 | 101.1 | 10.6 | ||
| (b) Contigs of A. thaliana Ler-0 | |||||||||
| A. thaliana | Aligned | 38 | 11 164 124 | 3170 699 | 5 | 323.5 | 38.8 | 6.7 | |
| Col-0 | Extendable | 18 | 11 164 124 | 6295 311 | 5 | 290.0 | 37.4 | 6.2 | |
| Extended | 7 | 22 010 905 | 15 898 017 | 3 | 256.0 | 29.1 | 6.3 | ||
| A. thaliana | Aligned | 19 | 11 164 124 | 5155 357 | 4 | 290.8 | 35.4 | 6.6 | |
| Col-O | Extendable | 8 | 9624 789 | 8358 227 | 3 | 273.7 | 32.1 | 6.8 | |
| Extended | 4 | 15 239 450 | 16 321 374 | 2 | 238.7 | 29.4 | 5.7 | ||
| A. lyrata | Aligned | 3 | 8571 950 | 7678 082 | 2 | 271.6 | 27.4 | 8.1 | |
| Extendable | 2 | 9624 789 | 7231 148 | 1 | 191.8 | 25.3 | 5.7 | ||
| Extended | 1 | 14 362 174 | 14 362 174 | 1 | 261.9 | 36.1 | 5.2 | ||
| Capsella rubella | Aligned | 3 | 8571 950 | 7678 082 | 2 | 271.6 | 27.4 | 8.1 | |
| Extendable | 2 | 9624 789 | 7231 148 | 1 | 191.8 | 25.3 | 5.7 | ||
| Extended | 1 | 14 362 134 | 14 322 893 | 1 | 206.0 | 27.5 | 5.2 | ||
| (c) Contigs of D. melanogaster ISO1 | |||||||||
| D. melanogaster | Aligned | 89 | 20 985 587 | 1497 447 | 3 | 42.1 | 127.6 | 4.0 | |
| A3 | Extendable | 27 | 7828 983 | 1164 232 | 2 | 46.8 | 69.2 | 3.3 | |
| Extended | 13 | 22 270 719 | 2412 289 | 1 | 44.3 | 56.7 | 3.3 | ||
| D. melanogaster | Aligned | 52 | 13 627 260 | 1830 831 | 3 | 23.9 | 119.8 | 0.3 | |
| sister (fors) | Extendable | 23 | 13 627 260 | 2230 926 | 2 | 18.6 | 89.7 | 0.3 | |
| Extended | 11 | 21 445 319 | 4681 384 | 2 | 15.4 | 52.0 | 0.3 | ||
| D. simulans | Aligned | 47 | 13 627 260 | 1543 036 | 2 | 18.1 | 122.2 | 0.2 | |
| Extendable | 8 | 13 627 260 | 3125 893 | 1 | 11.1 | 65.7 | 0.2 | ||
| Extended | 4 | 21 395 575 | 6236 416 | 1 | 7.0 | 49.4 | 0.2 | ||
| D. sechellia | Aligned | 48 | 13 627 260 | 1507 609 | 2 | 18.0 | 122.3 | 0.1 | |
| Extendable | 8 | 13 627 260 | 3125 893 | 1 | 11.1 | 65.7 | 0.2 | ||
| Extended | 4 | 21 406 895 | 6239 169 | 1 | 7.2 | 49.5 | 0.2 | ||
| (d) HiFi contigs of H. sapiens HG002 | |||||||||
| H. sapiens | Aligned | 836 | 16 389 496 | 3244 071 | 44 | 103.1 | 29.5 | 0.2 | |
| CMT-001 | Extendable | 174 | 14 743 856 | 1444 972 | 6 | 122.2 | 33.0 | 0.3 | |
| Extended | 68 | 25 473 177 | 3699 534 | 4 | 129.2 | 32.4 | 0.4 | ||
| P. troglodytes | Aligned | 763 | 16 389 496 | 3568 627 | 44 | 102.8 | 29.6 | 0.1 | |
| Extendable | 66 | 19 543 112 | 2914 891 | 4 | 96.2 | 28.9 | 0.1 | ||
| Extended | 31 | 33 979 403 | 6181 610 | 3 | 100.5 | 27.9 | 0.2 | ||
| P. paniscus | Aligned | 710 | 16 389 496 | 3835 094 | 311 | 102.5 | 29.5 | 0.1 | |
| Extendable | 48 | 19 543 112 | 1871 493 | 2 | 112.6 | 32.0 | 0.2 | ||
| Extended | 24 | 20 651 917 | 3750 382 | 2 | 126.5 | 30.1 | 0.3 | ||
| Gorilla | Aligned | 771 | 16 389 496 | 3519 349 | 44 | 102.5 | 29.6 | 0.1 | |
| Extendable | 15 | 32 566 459 | 2674 438 | 1 | 100.8 | 28.5 | 0.3 | ||
| Extended | 7 | 36 038 322 | 5731 809 | 1 | 98.5 | 27.8 | 0.4 | ||
The contigs in tests (a)–(d) are from S. cerevisiae W303, A. thaliana Ler-0, D. melanogaster ISO1 and H. sapiens HG002, respectively. In each test, similarities of the similar genomes to the target genome decreases from the first to the last, AlignGraph2’s extendable contigs are a subset of aligned ones, and the extendable and extended contigs are compared. The aligned contigs cannot be directly compared to the extended contigs, so the corresponding rows are indicated in gray.
4 DISCUSSION AND CONCLUSIONS
AlignGraph2 is inputted with both preassembled contigs and a similar genome, and it aligns them with each other, so a common concern is how AlignGraph2 processes misassemblies in the preassembled contigs and structural variations (SVs) in the similar genome. In other words, if a preassembled contig is aligned to the similar genome with relatively large gaps, does AlignGraph2 consider them as misassemblies in the contig or SVs between the similar and target genomes? Generally, though AlignGraph2 refines preassembled contigs by removing indels, it is conservative and does not attempt to correct misassemblies. That is, AlignGraph2 considers the large gaps as SVs between the similar and target genomes, and reassembles the whole contig end-to-end. This is achieved with the contig-guided read alignment technique discussed above: the corresponding long reads are first aligned to the contig and then to the similar genome, so all the vertices here in the constructed multipositional A-Bruijn graph have both alignment positions to the contig and genome, and two vertices with the same alignment position to the contig also have the same position to the genome. As a result, AlignGraph2 constructs a single path here and does not break in the traversal. It is similar to the initial AlignGraph algorithm, and we designed ReMILO to correct misassemblies in preassembled short read contigs [28]. In addition, it is worthwhile to note that though AlignGraph2 extends preassembled contigs cautiously, it is not avoidable to introduce additional misassemblies. Fortunately, considering the increased contig lengths and accuracy per 100 kbp in our tests, the additional misassemblies should be acceptable. Actually, as shown in Table 1 and Table 2, the numbers of misassemblies per mbp usually drops for the extended contigs compared to the extendable ones, meaning AlignGraph2 introduces fewer misassemblies compared to the de novo assembly algorithms.
In summary, this paper introduces AlignGraph2, a similar genome-assisted reassembly pipleline for the PacBio long reads. AlignGraph2 can be inputted with either error-prone or HiFi long reads, and contains four novel algorithms: similarity-aware alignment algorithm and alignment filtration algorithm for alignment of long reads and preassembled contigs to a similar genome, and reassembly algorithm and weight-adjusted consensus algorithm for extension and refinement of the preassembled contigs. AlignGraph2 was tested on both error-prone and HiFi long reads: in the test of long read alignment, AlignGraph2 can align more long reads and bases than some current algorithm and is more efficient or comparable to the others; in the test of contig reassemblies with various de novo assembly algorithms, AlignGraph2 can extend many of the contigs and obtain extended contigs of larger N50 value and smaller number of indels per 100 kbp than the extendable; in the test of contig reassemblies with various similar genomes, AlignGraph2 has relatively stable performance. Overall, AlignGraph2 is efficient in aligning the long reads and extending and refining the preassembled contigs. The current AlignGraph2 can only support the PacBio SMRT long reads, and in the future, we will expand it for the ONT long reads.
AlignGraph2 is a similar genome-assisted reassembly pipeline to extend and refine preassembled contigs from PacBio long reads. It is the second version of AlignGraph algorithm proposed by us but completely redesigned [2], can be inputted with either error-prone or HiFi long reads, and contains four novel algorithms.
In our performance tests on both error-prone and HiFi long reads, AlignGraph2 can align 5.7–27.2% more long reads and 7.3–56.0% more bases than some current alignment algorithm and is more efficient or comparable to the others.
For the aligned contigs assembled with various de novo algorithms, AlignGraph2 can extend 8.7–94.7% of the aligned contigs, and obtain extended contigs of 7.0–249.6% larger N50 value and 5.2–87.7% smaller number of indels per 100 kbp. With genomes of decreased similarities, AlignGraph2 also has relatively stable performance.
Code availability
The AlignGraph2 software can be downloaded for free from this site: https://github.com/huangs001/AlignGraph2.
Funding
This work has been supported by grants from the Beijing Natural Science Foundation [4192044 to E.B.], and the Fundamental Research Funds for the Central Universities [2019JBM073 to E.B.].
Shien Huang is a PhD student in the Group of Interdisciplinary Information Sciences, School of Software Engineering, Beijing Jiaotong University. His research interest is application of algorithms and artificial intelligence in various areas, such as biology and transportation.
Xinyu He is a graduate student in the Group of Interdisciplinary Information Sciences, School of Software Engineering, Beijing Jiaotong University. Her research interest is bioinformatics.
Guohua Wang is a professor and dean of the College of Information and Computer Engineering, Northeast Forestry University. His research interests include bioinformatics, machine learning and artificial intelligence, and has published about 100 journal papers.
Ergude Bao is an associate professor and director of the Group of Interdisciplinary Information Sciences, School of Software Engineering, Beijing Jiaotong University. His research interest is application of algorithms and artificial intelligence in various areas, such as biology, Chinese medicine, transportation and thermal physics, and has published about 10 papers in leading bioinformatics journals.
References
