


Abstract
The multi-omics molecular characterization of cancer opened a new horizon for our understanding of cancer biology and therapeutic strategies. However, a tumor biopsy comprises diverse types of cells limited not only to cancerous cells but also to tumor microenvironmental cells and adjacent normal cells. This heterogeneity is a major confounding factor that hampers a robust and reproducible bioinformatic analysis for biomarker identification using multi-omics profiles. Besides, the heterogeneity itself has been recognized over the years for its significant prognostic values in some cancer types, thus offering another promising avenue for therapeutic intervention. A number of computational approaches to unravel such heterogeneity from high-throughput molecular profiles of a tumor sample have been proposed, but most of them rely on the data from an individual omics layer. Since the heterogeneity of cells is widely distributed across multi-omics layers, methods based on an individual layer can only partially characterize the heterogeneous admixture of cells. To help facilitate further development of the methodologies that synchronously account for several multi-omics profiles, we wrote a comprehensive review of diverse approaches to characterize tumor heterogeneity based on three different omics layers: genome, epigenome and transcriptome. As a result, this review can be useful for the analysis of multi-omics profiles produced by many large-scale consortia. Contact:[email protected]
Introduction
A tumor sample is not a homogeneous mass of malignant cells but a heterogeneous cellular ecosystem comprising populations of diverse cell types, including cancer cells, stromal cells or immune cells. Over the decades, such intrinsic heterogeneity of a tumor sample, called tumor heterogeneity (TH), has been acknowledged for its implication in every step of cancer progression from initiation to metastasis and relapse [1–3]. TH resides even within a cancer cell population, and it is specifically referred to as intratumor heterogeneity (ITH). ITH accompanies several distinct populations of identical cancer cells called subclones. According to the clonal theory of cancer evolution, ITH arises from the Darwinian serial evolution of cancer cells [4, 5]. TH and ITH are major obstacles for cancer therapeutics, but at the same time harbor a potential for a novel therapeutic strategy manipulating TH and ITH themselves [6].
Accordingly, a number of recent translational researches have been focusing on the predictive power of TH for predicting various clinical outcomes, including patient survival, therapeutic response and metastatic potential of a tumor. In such studies, mutant-allele tumor heterogeneity (MATH) is one of the most widely used measures of genomic TH [7]. Given a distribution of variant allele frequencies (VAFs), a MATH score is defined as the ratio of the median absolute deviation to the median of the distribution. Interestingly, MATH scores have been shown to harbor significant translational implications, highlighting the vast utility of TH in the clinics. For example, the higher MATH scores (i.e. more extensive genomic TH) were shown to be associated with poor clinical outcomes in head and neck squamous cell carcinoma [7] and uterine corpus endometrial carcinoma [8], as well as increased metastatic potential in colorectal cancer [2, 9]. Besides, the increased heterogeneity of subclonal tumor neoantigens arising from ITH was suggested to be associated with the poor response to immune checkpoint blockade therapies [10], which emphasizes that TH should be taken into consideration when designing novel therapeutic strategies.
To investigate the clinical potential of TH, it is crucial to resolve the extent of TH from the molecular data generated from a tumor specimen. The main goals of such studies are to characterize (1) the proportion of cancerous cells in the sample, or tumor purity; (2) the composition and evolutionary history of cancer subclones; and (3) the proportion of each noncancerous cell type comprising the tumor microenvironment. A number of relevant approaches to tackle such goals have been developed so far, but still, most of them rely on individual omics. Since TH is disseminated across different omics layers exemplified by genome, epigenome and transcriptome, we cannot fully characterize TH from the data capturing only an individual omics layer. Thus, a systematic multi-omics TH characterization is crucial for another therapeutic breakthrough in cancer clinics. Nevertheless, a thorough understanding of the individual characteristics of each omics data is necessary for the integrative analysis throughout different omics layers; also, sufficient discussions about the computational approaches to model the data and to infer hidden biological states of a tumor are needed. Therefore, in this article, we present a structured summary of the biological and statistical properties of cancer multi-omics data and comprehensive reviews of existing bioinformatic approaches in terms of how they exploit such data to reveal the extent of TH in the sample. We also introduce recent pioneering approaches for the joint analyses of multiple omics data, which can inspire the further development of algorithms based on multiple omics data. Finally, regarding the recent technological advances and the massive amount of relevant data, we provide some insights on the feasibility of machine learning (ML)-based approaches.
Genome-based tumor heterogeneity
Underlying biological features
Single-nucleotide variation
The conventional theory of tumor evolution defines a subclone as a group of cells with identical genetic aberrations. In this point of view, a subclone arises after a cell acquires a driver mutation that confers significant selective growth advantage, even if dozens of other passenger mutations have already been accumulated in the cell [11, 12]. Therefore, the general assumption behind the genome-based approaches is that cells constituting a subclone have the same assortment of genetic aberrations, including single-nucleotide variation (SNV), and thus such aberrations have similar frequencies. The advent of next-generation sequencing technologies enabled high-throughput quantification of DNA bases, which are the atomic units of genetic information. Accordingly, a plethora of statistical approaches have been developed in the past decade, driven by the massive SNV allelic count data.
Somatic copy number alteration
Somatic copy number alteration (SCNA) is another genomic feature that leaves a large trace of TH. In early studies of SCNAs, the primary sources of data were array-based technologies such as comparative genomic hybridization [13, 14] and SNP arrays [15, 16]. While both methods produce segmental copy numbers on a relative basis, the main difference is that only SNP arrays allow the analysis of allele-specific SCNAs [17] and therefore can be used for studies of loss of heterozygosity (LOH), or even copy number-neutral LOH. Due to its affordability, SNP array is still a reasonable ancillary method for validation of next-generation sequencing (NGS)-based methods, although NGS-based approaches tend to yield a finer resolution of SCNA detection.
Given relative quantities of copy numbers, it is not trivial to infer how many absolute integer copies of genomic segments are present per cell, due to the genomic instability, the impurity of tumor samples and the existence of tumor subclones with different SCNA profiles [18]. For instance, whole-genome duplication events often occur in cancer, but virtually they cannot be detected with relative copy numbers alone [19]. SCNAs also complicate SNV-driven approaches since the VAFs within copy number-altered regions will deviate from the representative VAFs of the subclone, which are derived from copy number-neutral regions. Therefore, in general, the major goal of SCNA-driven approaches is to estimate tumor purity and absolute copy numbers of genomic regions accurately, which in turn assist several other TH characterization methods.
Tumor phylogenies
Incorporating phylogenetic relationships among subclones into the model may provide enhanced plausibility and explainability of the inferred evolutionary history of a tumor. To date, four different models for tumor evolution have been proposed [20]: (1) linear, (2) branching, (3) neutral and (4) punctuated evolution. Although various mathematical models for each of the models were developed, the vast majority of subclonal inference algorithms do not directly employ those models due to their complexity. Instead, the models are built on some basic premises such as perfect phylogeny of tumor evolution in which convergent evolution never occurs and infinite site assumption, which assumes that there are no shared genomic aberrations between any two subclones in distinct lineage and no reverse mutations.
Tumor purity
Due to the inevitable inclusion of adjacent noncancerous cells during surgical resection and the nature of tumor microenvironment involving the infiltration of lymphocytes, practically, we cannot obtain a pure tumor sample. Thus, we define tumor purity, or cellularity, as a proportion of truly cancerous cells in a biopsy and introduce it as an essential parameter in the model that governs the accurate and nonambiguous estimation of subclonal prevalences, as illustrated below. Assume we observe a cluster of heterozygous VAFs averaged at 0.1, by which we can infer the existence of a subclone occupying 20% of tumor cells in case of 100% tumor purity. However, in reality, a sample is not perfectly pure, so that we have numerous equivalent solutions, e.g. 25% subclone with 80% tumor purity, or alternatively 40% subclone with 50% tumor purity. Accordingly, inferring tumor purity is one of the crucial challenges in TH characterization.
Computational problem formulation
SNV-driven approaches for subclonal inference
SNV-driven tools for subclonal inference
| Name | Year | Feature|$^{\ast }$| | Model|$^{\dagger }$| | Evolutionary constraint | Multi-sample analysis|$^{\ddagger }$| | Description§ | Implementation | Ref |
|---|---|---|---|---|---|---|---|---|
| PurBayes | 2013 | AC | Bin | N | N | Bayesian finite mixture model evaluated with penalized expected deviance | R | [21] |
| TrAp | 2013 | CVAF | N/A | Y | Y | Enumerates possible tree structures by iteratively merging first-generation trees | Java | [22] |
| PyClone | 2014 | AC | Bin, BeBin | N | Y | Bayesian nonparametric clustering using Dirichlet process | Python | [23] |
| SciClone | 2014 | AC, VAF | Beta, Gaussian, Bin | N | Y | Variational Bayesian mixture model that prunes marginal clusters to obtain optimal number of clusters | R | [24] |
| PhyloSub | 2014 | AC | Bin | Y | Y | Bayesian nonparametric model using tree-structured stick-breaking process | C++, Python | [25] |
| EXPANDS | 2014 | VAF | N/A | N | N | Heuristic clustering of variants based on KL-divergence. | R | [26] |
| TITAN | 2014 | AC | Bin | N | N | Factorial HMM with joint emission model for allele counts and RDs | R | [27] |
| Clomial | 2014 | AC | Bin | N | Y | Constrained matrix factorization using multi-region sequencing data | R | [28] |
| Rec-BTP | 2014 | CVAF | N/A | Y | N | Recursive approximation algorithm for binary tree partition | MATLAB, Python | [29] |
| PhyloWGS | 2015 | AC | Bin | Y | Y | Extends PhyloSub by incorporating SCNA information from WGS | C++, Python | [30] |
| AncesTree | 2015 | AC | Bin | Y | Y | Solves VAF factorization problem with ILP | C++ | [31] |
| LICHeE | 2015 | VAF | Gaussian | Y | Y | Multi-sample tumor phylogeny reconstruction by solving a set cover problem | Java | [32] |
| Bayclone | 2015 | AC | Bin | N | Y | Bayesian nonparametric clustering using categorial Indian buffet process | R | [33] |
| Cloe | 2016 | AC | BeBin | Y | Y | Phylogenetic latent feature model that reflects hierarchical relationship between subclonal features | R | [34] |
| Canopy | 2016 | AC | Bin | Y | Y | Multi-sample tumor phylogeny reconstruction by joint modeling of SNV and SCNA | R | [35] |
| ddClone | 2017 | AC | Bin, BeBin | N | N | Bayesian nonparametric clustering using distance-dependent Chinese restaurant process | R | [36] |
| ClonEvol | 2017 | CVAF | N/A | Y | Y | Uses bootstrapping to get CIs of subclonal prevalences generated from other methods, then enumerates and evaluates possible subclonal orderings | R | [37] |
|$^{\ddagger }$|Denotes whether the tool is able to conduct joint analysis of several spatially or longitudinally distinct samples collected from a single tumor. Abbreviations: |$^{*}$|AC, allele count; VAF, variant allele frequency; CVAF, clustered variant allele frequency; |$^{\dagger }$|Bin, binomial; BeBin, beta-binomial; §ILP, integer linear programming; CI, confidence interval.
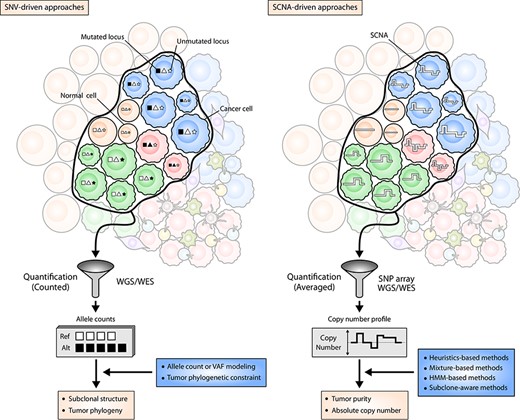
Genome-based approaches for TH characterization. The left panel illustrates the viewpoint of SNV-driven subclonal inference algorithms. Different cancer subclones (denoted by the blue, red and green population of cells) harbor different sets of SNVs at their genomic loci (illustrated as squares, triangles and stars). The variant alleles at these genomic loci are identified and quantified by NGS, and their counts or VAFs are statistically modeled to obtain an optimal estimation of subclonal structure or evolutionary history of subclones. The right panel illustrates the viewpoint of SCNA-driven tumor purity and absolute copy number estimation approaches. Thick white lines inside the cells symbolize the copy numbers of genomic segments. While being quantified by SNP array or NGS platforms, the copy number values are averaged, and therefore resulting copy numbers are not necessarily integers. With the average copy number profiles, SCNA-driven methods infer tumor purity and absolute copy numbers of cancer cells. Note that the extent of contaminating normal cells (smooth circles) are taken into account by both of the approaches.
Deciding the optimal number of inferred subclones (|$K^{*}$|) is another critical issue. The advantage of imposing nonparametric priors such as Dirichlet process [23, 41, 42] or categorical Indian buffet process [33] for subclonal structures is that |$K^{*}$| is inferred in an adaptive and data-driven manner, which does not require predefined |$K$| given to the model a priori. On the other hand, parametric priors, including Dirichlet distribution [34], are still a reasonable option. The model parameters should be repeatedly inferred for varying predefined |$K$|s. Thus, the lightweight inference algorithms such as expectation-maximization (EM) [27, 28, 38] or variational EM [24] are often preferred. Subsequently, the best |$K$| is selected by appropriate evaluation metric such as log likelihood [38], penalized expected deviance [21] and |$S\_Dbw$| [27].
The most realistic prior for the subclonal structures is the distribution over the topologies of phylogenetic trees, as it is likely to produce biologically reasonable phylogenies. PhyloSub [25] is one of the first methods to incorporate phylogenetic priors for subclonal inference, which uses a tree-structured stick-breaking process. Since then, many relevant approaches have been developed, and their common rationale is to integrate various phylogenetic constraints into their inference framework, such as sum and crossing rule [25], ancestry condition [31, 32] or children-sum-to-parents condition [22].
SCNA-driven approaches for tumor purity and absolute copy numbers
SCNA-driven tools for tumor purity and absolute copy number estimation
| Name | Year | Data | Feature|$^{*}$| | Type|$^{\dagger }$| | Description | Implementation | Ref |
|---|---|---|---|---|---|---|---|
| ASCAT | 2010 | SNP array | LRR, BAF | E | Grid searches through |$\omega $| and |$\pi $|. Copy number estimates are evaluated by squared differences to nearest integers. | R | [17] |
| OncoSNP | 2010 | SNP array | RD, BAF | M | Student t-mixture solved by EM | MATLAB | [43] |
| ABSOLUTE | 2012 | SNP array | LRR, VAF | M | Gaussian mixture using grid search through |$\omega $| and |$\pi $|. Solutions are evaluated by SCNA-fit likelihoods. | R | [18] |
| APOLLOH | 2012 | NGS | RD, BAF | H | HMM with 18 genotype states and binomial emission. Parameters are estimated by EM. | MATLAB | [44] |
| CNAnorm | 2012 | NGS | RDR | M | Gaussian mixture fitted by EM. Number of components are chosen using AIC. | R | [45] |
| CLImAT | 2014 | NGS | RD, AC | H | HMM with binomial and negative binomial emission model for ACs and RDs, respectively | MATLAB | [46] |
| THetA2 | 2014 | NGS | RD, BAF | M | Solves maximum likelihood mixture decomposition problem by efficient enumeration of interval count matrix denoting copy numbers | Java, MATLAB, Python | [40] |
| TITAN | 2014 | NGS | RDR, AC | H | Subclone-aware factorial HMM with joint emission model for ACs and RDs | R | [27] |
| PyLOH | 2014 | NGS | RD, AC | M | Joint modeling of RD and B-allele count with Poisson and binomial distribution, respectively. Parameters are estimated by EM. | Python | [47] |
| AbsCN-seq | 2014 | NGS | RD, VAF | E | Grid searches through |$\omega $| and |$\pi $|. Finds optimal solution that minimizes least squares objective. | R | [48] |
| Mixclone | 2015 | NGS | RD, BAF | M | Unified probabilistic framework using Poisson mixture for RD and binomial for BAF. Parameters are estimated by EM. | Python | [38] |
| Sequenza | 2015 | NGS | RDR, BAF | E | Grid searches through |$\omega $| and |$\pi $|. Finds optimal solution that maximizes log-posterior probability. | Python, R | [49] |
| FACETS | 2017 | NGS | RD, BAF | M | Employs Gaussian noncentral |$\chi ^2$| model to call absolute copy numbers | R | [50] |
| CLImAT-HET | 2017 | NGS | RD, AC | H | Subclone-aware factorial HMM which extends CLImAT | MATLAB | [51] |
| ichorCNA | 2017 | NGS | RDR | H | HMM using Student t-mixture as an emission model for RDRs. Parameters are estimated by EM. | R | [52] |
| Sclust | 2018 | NGS | RD, RDR, BAF, VAF | O | |$\omega $| and |$\pi $| are estimated through iterative conditional optimization. Allows estimation of segment-wise subclonal copy numbers. Subclonal prevalences are also inferred by mutational clustering based on smoothing splines. | C++ | [53] |
| ACE | 2019 | NGS | RD | E | Grid searches through |$\omega $| and |$\pi $|. Solutions are evaluated by the discrepancy between observed and expected RDRs. | R | [54] |
Abbreviations:|$^{*}$|LRR, log R ratio; RD, read depth; RDR, read depth ratio; BAF, B-allele frequency; AC, allele count; VAF, variant allele frequency; |$^{\dagger }$|E, heuristics-based method; M, mixture-based method; H, HMM-based method; O, Other.
Heuristics-based methods Absolute copy numbers should be nonnegative integers. Therefore, a simple assessment is possible for a candidate solution by evaluating how much the solution is close to nonnegative integers. Since a simple analytic solution (|$\widehat{\omega ^{A}_l}$|, |$\widehat{\omega ^{B}_l}$|) for any fixed (|$\omega $|, |$\pi $|) can be derived by Equations (6) and (7), and biologically plausible range of (|$\omega $|, |$\pi $|) can be specified, we can easily think of grid-searching through the space of (|$\omega $|, |$\pi $|) to find optimal solution. ASCAT [17] evaluates each grid-search solution by summing the squared difference between inferred copy numbers (|$\widehat{\omega ^{A}_l}$|, |$\widehat{\omega ^{B}_l}$|) and the corresponding nearest nonnegative integers. ACE [54] first computes expected RDR signal for all plausible integer copy numbers by Equation (6) and evaluates each solution using the difference between the true RDR signal and nearest expected RDR signal. Similarly, Sequenza [49] finds the optimal (|$\omega $|, |$\pi $|) that maximizes the log-posterior probability of the fit by grid-search.
Mixture-based methods LRR, RD or RDR values of genomic segments with the same copy state would be clustered together, which led to mixture-based methods. Solving the mixture model gives a set of putative copy states, and the states are further annotated by absolute copy numbers. For example, ABSOLUTE [18] is a prominent Gaussian mixture-based approach applied for pan-cancer absolute copy number analysis. Since expected LRR value can be parameterized by (|$\omega $|, |$\pi $|) (Equation (6)), we have a different mixture model for each configuration of (|$\omega $|, |$\pi $|). Through grid-search, ABSOLUTE obtains the optimal (|$\omega $|, |$\pi $|) that shows the best SCNA-fit log-likelihood scores.
BAF values can also be incorporated in the mixture model since SNP loci sharing the same genotype will produce similar BAF values. PyLOH [47] jointly models RD and BAF values with Poisson and binomial mixture models, respectively.
HMM-based methods Since an SCNA event usually spans a large genomic stretch spanning multiple SNPs, those SNPs will share the same genotypes. This spatial correlation can be exploited to get more precise signals of allelic frequencies. While simple aggregation of read counts along the segment [55] was shown to be effective, more elegant approaches using hidden Markov model (HMM) have been developed.
In general, such HMM models regard the empirically plausible set of genotypes as a set of hidden states. For example, APOLLOH [44], CLIMAT [46] and TITAN [27] propose an 18-, 20- and 21-state model, respectively. Given a genotype as a hidden state, emission probabilities are defined with probability distributions. For example, RDs and log copy ratios are often modeled with Poisson and Gaussian distribution, respectively, and B-allelic read counts are modeled with a binomial distribution. The transition matrix can be inferred from the data [46], or a fixed matrix is used where the transition probabilities are defined to exponentially decay as distance increases [27, 44].
Perspectives
The strength of SNV-driven approaches is that subclone-wise functional analyses can be readily conducted since an SNV can usually be translated into a functional alteration of a specific gene. However, the high variance of allele frequencies, due to insufficient sequencing depth or experimental bias, is one of the major hurdles. Moreover, discrepancies of SNVs captured from various callers also undermine the robustness of SNV-driven approaches [56]. On the contrary, SCNA-driven approaches can work well with shallow sequencing depth because an SCNA usually spans a large genomic interval rather than a point, resulting in much more reads supporting each event. They still have shortcomings in terms of analytic resolution, as most of their application is restricted to analyzing tumor purity or absolute copy number while not accounting for tumor subclones.
Since most cells of an individual share almost identical genomic blueprints, one of the fundamental limitations of genome-based approaches is that we cannot distinguish distinct cell types using genomic features. Therefore, for a full characterization of TH including microenvironment surrounding a tumor, epigenomic and transcriptomic features are necessary since they are known to show cell-type specificity.
Transcriptome-based tumor heterogeneity
A growing body of evidence suggests that epigenetic aberrations are nearly ubiquitous in a wide variety of cancer types [57]. Subjects of the epigenetic alterations commonly include DNA methylation, histone modification and, more broadly, chromatin state. Among them, aberrant DNA methylation exemplified by focal hypermethylation [58–62] and widespread hypomethylation [63–65] have been the most comprehensively characterized, yet not fully understood, phenomenon in cancer. Although histone modifications and chromatin states also have been of great interest in early studies, the extent of their heterogeneity across tumor cells largely remains to be explored. Thus, in this section, we mainly discuss how the heterogeneity of DNA methylation can be exploited to uncover the heterogeneity of tumor samples.
Underlying biological features
Investigating the ITH of DNA methylation
The earliest report of ITH of DNA methylation (mITH) was by Feinberg and Vogelstein [63], along with an insightful conjecture that mITH arises from a certain portion of cancer cells having defects in methylation maintenance. In the past decades, this hypothesis has gradually been consolidated in diverse types of cancers [66, 67]. The active introduction of the bisulfite sequencing techniques allowed the methylation state of individual CpGs to be analyzed in an unprecedented resolution and coverage. Most importantly, analyzing a single sequencing read harboring multiple CpGs enabled haplotype-like analysis of DNA methylation, and the phased pattern of DNA methylation is called `epiallele'. The techniques other than sequencing-based methods exploited by the early DNA methylation studies could only inform average methylation levels for each CpG, limiting the discussion of mITH at bulk-cell level. On the contrary, since each sequencing read is originated from a single cell, we can consider an epiallele as a surrogate of each cell. Therefore, analyzing methylation patterns of sequencing reads is conceptually equivalent to analyzing the local epigenomic state of a collection of single cells.
Dual perspectives on epigenetic heterogeneity in cancer
The two apparently contradictive hallmarks of epigenomic modification—their stable inheritance and dynamic regulation—make it one of the most intriguing clues for TH.
Somatic heritability The first aspect relies on the somatic heritability of epigenomic modifications, which is most analogous to the view of genomic TH because it mainly focuses on subclonal alterations of epigenomic marks, which corresponds to subclonal SNVs or SCNAs. In this viewpoint, a subclonal epigenomic mark can be either of passenger or driver of tumor progression as its genomic counterpart. The selective growth advantage given by `driver' epigenomic marks leads to a more aggressive proliferation, which finally results in an epigenetic subclone that possesses identical (or nearly identical) epigenetic alterations. The experimental evidence for epigenetic subclones was reported in diffuse large B-cell lymphomas by showing that the diversity of methylation patterns were greatly reduced (i.e. patterns ‘converged’) in relapsed samples after chemotherapy [68].
Stochasticity Even under appropriate regulation, the average DNA methylation level of a bulk sample at a specific CpG site seems to show slight fluctuations over time. It can be compared with a ball traveling back and forth at the bottom of the valley [69]. Often, the machinery is perturbed in a transformed or precancerous cell, giving flatter regulatory potential landscape that imposes only a weak restoring force on the methylation level. Thus, the methylation level becomes more unstable and follows a trajectory rather resembling a random-walk trajectory.
Tumor purity, infiltrating immune cells and microenvironment
Epigenomic features have far more advantages than genomic features for the computational microdissection of noncancerous cells in a sample. Since the cells of an individual contain almost identical genomic blueprints, genomic regions showing distinctive differences between tumoral and non-tumoral cells are restricted to particular regions with somatic alterations.
Although numerous successful methodologies based on such scarce genomic features have been developed, it can be complemented with epigenome-based algorithms exploiting the widespread difference of epigenomic marks between tumoral and non-tumoral cells, especially when compared with that of genomic features. Furthermore, it is known that the epigenomes of different cell types, such as immune cells at different hematopoietic lineage, are strikingly different. We hereafter broadly refer to the estimation of the composition of cell types comprising tumor microenvironment as `cell-type deconvolution'. In the following subsection, we discuss computational tumor purity estimation and cell-type deconvolution algorithms utilizing epigenomic features, mainly DNA methylation.
Computational problem formulation
Characterization of epigenetic subclones
There are a handful of tools that utilize somatic heritability of epialleles to seek the evidence of tumor subclones (Figure 2, left panel). The underlying assumption of these tools is that a subclone harbors (nearly) identical epialleles so that we can infer epigenetic subclonal structures based on them.
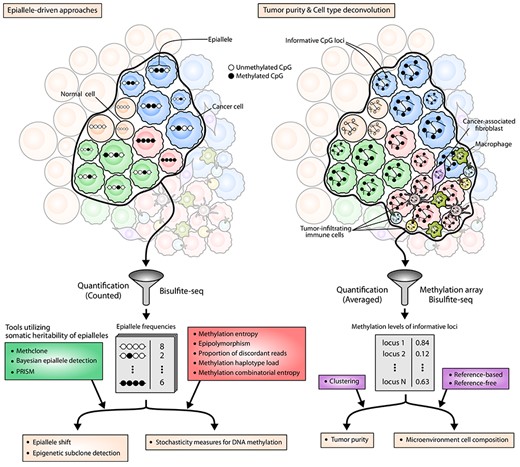
Epigenome-based approaches for TH characterization. Black and white circles denote methylated and unmethylated CpGs, respectively. The left panel illustrates the viewpoint of epiallele-driven approaches. An epiallele is defined as a set of consecutive binary methylation states that spans a short genomic stretch, which usually corresponds to a methylation pattern appearing in a single sequencing read. In this point of view, epialleles show dual characteristics at the same time: somatic heritability and stochasticity. Note that epialleles in subclonal cells are similar enough but not always identical. These patterns of methylation states can be obtained by various sequencing methods, and the frequencies of each pattern are used to analyze epigenetic subclones or measure the extent of epigenomic stochasticity in the tumor biopsy. The right panel depicts the viewpoint of epigenome-based approaches for tumor purity estimation and cell-type deconvolution. The basis of these approaches is the selection of informative CpG loci whose methylation level distinguishes particular cell types from the others. Using the methylation levels of informative CpG loci, the purity of the sample can be inferred by clustering-based approaches, and the composition of constituent cell types can be inferred by reference-based or reference-free methods.
Methclone [70] detects the compositional change of epialleles (epiallele shift) between two related samples (e.g. primary and recurrent tumor samples), in order to identify epigenomic subclonal evolution. Bayesian epiallele detection (BED) [71] is the first model to tolerate the mild stochasticity of epialleles by Bayesian inference. Given a locus, BED treats a true epiallele as a latent variable and assumes that an observed set of epialleles was generated from it according to a stochastic process involving the erroneous inheritance of methylation states. PRISM [72] is a more direct approach to deal with epigenetic subclones by applying the idea of SNV-based subclonal inference methods for epialleles. To simplify the approach, it only makes use of fully unmethylated and fully methylated epialleles as a `fingerprint' epialleles that distinctly mark a subclone, then the proportions of the fingerprints are clustered as in SNV-based methods.
Stochasticity measures for DNA methylation
DNA methylation-based tumor purity estimation
The main idea of DNA methylation-based tumor purity estimation is to determine `informative' CpG loci that distinguish cancer cells from adjacent normal cells (Figure 2, right panel). The simplest measure is called leukocyte unmethylation for purity (LUMP), which is computed using the average methylation level of predefined 44 CpG sites that are known a priori to be consistently unmethylated in leukocytes [76]. Other ways to select informative CpG sites is to carry out statistical decision on each CpG locus to check if cancer and normal samples have a significant and stable difference of DNA methylation in that locus, based on Wilcoxon rank-sum test [77], AUC [78] or Z-score [79]. Once informative CpG loci are chosen, downstream purity estimation is rather straightforward since the methylation levels of each informative locus directly indicate the mixing proportion of cancer and normal cells. A point estimate of tumor purity can be derived by simple averaging of mixing proportions [78], or by clustering them with Gaussian kernel density estimation [77] or beta mixture model [79].
Since the majority of the methods only focus on pointwise average methylation levels, the development of NGS-based methods that fully utilize the phasing information of DNA methylation on a single sequencing read should be encouraged. MethylPurify [80] is an excellent pioneering example that selects informative genomic bins based on the EM-based splitting of bisulfite sequencing reads.
DNA methylation-based cell-type deconvolution
Cell-type deconvolution algorithms account for the detailed composition of constituent normal cell types, such as diverse types of immune cells and cancer-associated fibroblasts (Figure 2, right panel). The algorithms can be divided into two groups: (1) reference-based methods utilizing a catalog of reference methylomes from sorted cells and (2) reference-free methods that decompose observed methylation profiles into a linear combination of putative reference methylation profiles in an unsupervised manner. One of the first reference-based methods was proposed by Houseman et al. [81], which involves a constrained projection of observed methylation profiles onto reference profiles to obtain the estimates of cell-type proportions. Another popular approach is called MethylCIBERSORT [82]. It selects informative CpG sites that distinguish cell types (as in tumor purity estimation) and feeds their methylation levels into CIBERSORT [83]. Reference-free methods widely adopt matrix factorization techniques, by which the methylation levels are decomposed into latent reference methylation profiles and corresponding cell type proportions with some constraints. For example, RefFreeCellMix [84] uses a simple form of constraint which enforces methylation levels to lie between 0 and 1, and the sum of cell-type proportions to be less than 1. On the other hand, MeDeCom [85] adds a constraint that makes methylation levels close to 0 and 1.
Perspectives
Although the duality of epigenomic marks offers the most compelling possibilities for TH characterization, we still lack a clear conceptual background. It remains to be tested whether epigenetic subclones harboring somatically heritable epigenomic marks are prevalent throughout various cancer types. Meanwhile, investigating the stochasticity of epigenomic marks is not straightforward due to its probabilistic nature, which hinders the experimental reproducibility at the cellular level. Moreover, its quantification needs careful consideration since the variability vanishes and thus cannot be captured with simple `averaging-out' measures such as DNA methylation level. Nevertheless, cancer epigenomics is a vibrant field of research, and we are gradually being equipped with experimental and analytic methodologies, which will give us a clearer view of epigenetic TH in the near future.
Epigenomic features other than DNA methylation, such as histone modification, chromatin structure or even histone protein itself, may also constitute orthogonal layers of epigenomic TH. Notably, heterogeneous levels of the linker histone H1.0 were reported in several cancer types, where its deprivation was associated with increased self-renewal of tumorigenic cells [86].
Characterizing epigenomic TH is crucial as it serves as a glue that connects genomic TH and transcriptomic TH. We may discover hints of the mechanistic link between genomic and epigenomic TH by investigating the association of mutated epigenetic regulators and aberrant epigenomic marks. Similarly, the relationship between transcriptomic and epigenomic TH may be revealed by investigating the heterogeneity of the epigenomic landscape of regulatory regions.
Transcriptome-based tumor heterogeneity
Underlying biological features
Tumor heterogeneity, transcriptome and marker genes
Since the gene expression profile (GEP) of a tumor can be readily characterized by well-established platforms such as microarray and RNA-seq, it has been extensively studied for its potential as a biomarker for diseases. One successful application of transcriptomic biomarker is PAM50 signatures [87], a breast cancer subtype classification system based on the expression levels of 50 genes. Interestingly, the subtypes solely based on those genes are associated with prognosis, making it possible to design therapeutic regimens. However, selecting an optimal set of genes is not always straightforward.
What we observe from bulk cell sequencing is a crude admixture of reads from heterogeneous cell population [88], thereby it can be viewed as a blind source separation problem to seek for the independent effect of constituent cell types [89–91]. Depending on experimental design and sample quality, these compound signals may ruin the hypothesis testing or obscure possible novel findings. Unlike genomic and epigenomic features, transcriptomic features are basically continuous and it complicates the signal deconvolution using bulk transcriptome data. Nevertheless, utilizing marker genes would be an intuitive approach for the estimation of the composition of the non-tumoral part of a tumor biopsy [92].
In early studies, traditional markers for immunohistochemistry or reverse transcriptase-polymerase chain reaction were widely used. Recently, GEPs of purified cells are rapidly accumulating in public databases, which accelerate the discovery of marker genes and the development of algorithms utilizing them by various statistical approaches [93–95]. Although marker gene-based cell-type deconvolution methods can be easily applied with simple statistical approaches, their limitations are clear; the performance of such algorithm is limited by our prior knowledge.
Protein–protein interaction networks and pathways
Well-coordinated interactions between proteins are required to maintain normal cellular function. Efforts in identifying interaction partners of proteins in a high-throughput manner [96, 97] led to the compilation of valuable databases of protein–protein interaction networks [98, 99]. In bioinformatic analyses, these template networks are often used to define functional modules, which represent sets of proteins interacting together [100, 101]. Similarly, biological pathways denote the cellular mechanisms to convey the intra/extracellular information through the interactions of proteins to elicit an appropriate response of a cell upon various stimuli. To obtain a more direct functional portrait of a cell, several methods are proposed to infer the activity of biological pathways by aggregating individual gene expression values [102]. One advantage of handling biological pathways or modules is that their measured activity is relatively robust compared to the individual expression levels of its components. In terms of TH, we can also conceive the heterogeneity at levels of biological modules or pathways, which can be measured by information-theoretic approaches discussed in the next section.
Computational problem formulation
Purity estimation and cell-type deconvolution
Transcriptome-based purity estimation and computational cell-type deconvolution are advanced fields of TH studies (Figure 3, left panel; Table 3). Accordingly, there have been lots of methodological reviews and cross-comparison benchmark studies [116–120], including recent evaluation with single cell-based simulation [121]. In this section, we provide a brief overview of relevant computational methods.
Transcriptome-based tools for tumor purity estimation and microenvironmental cell-type deconvolution
| Name | Year | Application|$^{*}$| | Type|$^{\dagger }$| | Description|$^{\ddagger }$| | Implementation | Ref |
|---|---|---|---|---|---|---|
| PERT | 2012 | CTD | P | Nonnegative maximum likelihood estimation based on latent dirichlet allocation framework. Introduces multiplicative perturbation vectors to model the perturbation of reference GEPs | Octave | [103] |
| ISOpure | 2013 | TPE | P | Models normal GEP as linear combination of known profiles of normal tissue sample. Enforces GEP of cancer cells to be similar to each other. | MATLAB, R | [104, 105] |
| DeMix | 2013 | TPE | P | Log-normal mixture model for tumor purity estimation using array-based expression data | C, R | [106] |
| ESTIMATE | 2013 | TPE | S | Computes stromal score, immune score and purity by ssGSEA using stromal/immune gene set with 141 genes | R | [107] |
| UNDO | 2015 | TPE | O | Linear latent variable model to estimate tumor-stroma proportions | R | [108] |
| CIBERSORT | 2015 | CTD | R | |$\nu $|-support vector regression using LM22 leukocyte gene signature matrix, which contains 547 genes that distinguish 22 human hematopoietic cell phenotypes | Java, R, Web | [83, 109] |
| contamDE | 2016 | TPE | P | Employs negative binomial model for RNA-seq read counts. Iteratively updates tumor cell proportions and differentially expressed gene sets. | R | [110] |
| TIMER | 2016 | CTD | R | Constrained least squares regression to infer the abundance of six immune cell types | R, Web | [111] |
| MCP-counter | 2016 | CTD | S | Log2 geometric mean of marker gene expression values for 10 distinct microenvironmental cell populations | R | [112] |
| EPIC | 2017 | CTD | R | Constrained least squares regression that gives more weight to marker genes having lower variance. Expressions are normalized by total mRNA content. | R | [113] |
| xCell | 2017 | CTD | S | Average of transformed ssGSEA scores for cell-type specific gene sets from CCLE. Adopts spillover compensation to remove unwanted correlation between cell type scores | R | [114] |
| quanTIseq | 2019 | CTD | R | Constrained least squares regression with nonnegative and less-than-one constraints for cell type proportion | R | [115] |
| CIBERSORTx | 2019 | CTD | R | Extends CIBERSORT to utilize GEPs from diverse sources and platforms, including single-cell RNA-seq data | Java, R, Web | [109] |
Abbreviations.|$^{*}$|CTD, cell-type deconvolution; TPE, tumor purity estimation. |$^{\dagger }$|P, probabilistic approach; R, regression-based approach; S, signature score-based approach; O, other. |$^{\ddagger }$|GEP, gene expression profile; CCLE, Cancer Cell Line Encyclopedia.
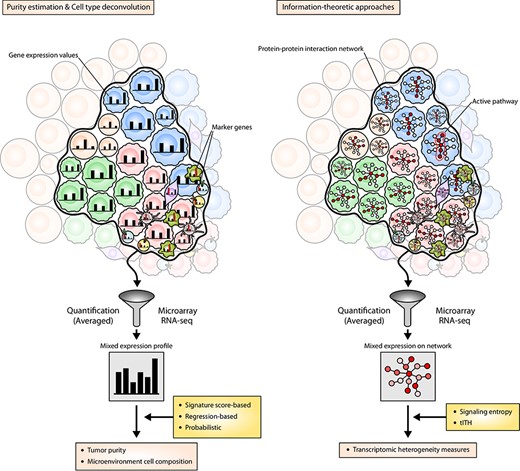
Transcriptome-based approaches for tumor heterogeneity characterization. The left panel illustrates the viewpoint of transcriptome-based computational deconvolution algorithms. The transcriptome data we observe is a mixture of the individual GEP of cells. Note that the expression levels of cell-type marker genes are represented by red bars in tumor microenvironmental cells. One approach to estimate the abundance of a particular cell type is to compute a signature score based on the marker genes exclusively expressed in such cells. Regression-based methods exploit reference GEPs to estimate the weight of linear combination across different cell types. Probabilistic approaches assume the expression levels are probabilistically distributed around reference GEPs and infer reference profiles and cell type abundances. The right panel illustrates the viewpoint of information-theoretic approaches. Each node of the network inside the cells denote each gene, and the redder circle represent the higher expression of the gene. These approaches measure the diversity of active signaling paths (paths with red circles) throughout the population of cells based on the protein–protein interaction network.
Signature score-based approaches To get a signature score for a cell type, these approaches aggregate the expression levels of corresponding marker genes. MCP-counter [112] simply uses geometric mean of marker gene expressions as the signature score for each cell type, while ESTIMATE [107] and xCell [114] utilize ssGSEA [122] scores to measure the collective enrichment of marker genes.
Probabilistic approaches Unlike regression-based approaches, these approaches explicitly deal with the likelihood of the probabilistic models for observed expression values or read counts and let the inference framework jointly infer the expression profiles and cell-type proportions. For example, DeMix and DeMixT formulate the observed array-based expression as a linear combination of log-normal random variables and conducts iterative optimization [106, 123]. Moreover, there have been methods that account for the perturbation of reference expression profiles arising from various microenvironmental factors. ISOpure posits an expression profile of normal cells as a linear combination of reference expression profiles of normal cells [104]. On the other hand, PERT introduces a perturbation vector, and it is multiplied to the reference profile [103].
Information-theoretic approaches
Apart from the expression levels of genes, their alternative splicing patterns are also heterogeneous across cells [128]. In this regard, the concept of spliceome ITH (sITH) was proposed recently [129]. In brief, sITH captures the difference of uncertainties in splice junction usage with JSD, and the pan-cancer analysis revealed that increased sITH was shown to be associated with cancer progression and unfavorable outcomes.
Perspectives
Since the transcriptome serves as the most immediate and comprehensive surrogate of the functionality of a cell, characterizing transcriptomic TH is crucial to draw clear functional consequences of TH. However, the fundamental limitation of transcriptomic data is that gene expression levels are not discrete by nature, unlike genomic or epigenomic features. To separate the observed continuum of gene expressions into latent constituent distributions, one promising approach is to exploit information of upstream regulatory mechanisms. We might be able to use relevant genomic and epigenomic features to build a prior distribution of expression levels of genes, even though we still lack a systematic understanding of the gene regulatory mechanism. Conversely, it may be feasible to filter out nonfunctional alterations by integrating transcriptome-based TH characterization with other omics-based methods, facilitating the clear explanation of the driver event of the subclones.
Applications of single-cell sequencing
Although numerous approaches based on bulk sequencing data have been proposed, it is worth noting that the most straightforward way to investigate TH is separate molecular characterization of every single cell in a tumor. Understandably, single-cell DNA sequencing have showed its wide application in characterization of clonal diversity and evolution [130, 131] for various cancer types including breast cancer [132], clear cell renal carcinoma [133] and leukemia [134, 135]. Relevant computational tools include Single Cell Genotyper [136], SCITE [137], OncoNEM [138], SiFit [139], B-SCITE [140], SiCloneFit [141] and PhISCS [142]. Single-cell RNA sequencing has also been increasingly used. Since the pioneering study on primary glioblastoma cells (without microenvironmental cells) that reported cell-to-cell variability of gene expression and splicing patterns [143], the field has been broadened to characterize interaction among cells constituting microenvironment of metastatic melanoma [144], or to suggest higher-resolution subtype classifications of colorectal cancer using single cell-based transcriptomic profiles [145]. Meanwhile, some of the recent studies have been utilizing methods for single-cell trajectory inference for TH characterization. For example, Monocle [146, 147] was used to reveal the evolutionary trajectory in glioblastoma [148, 149], liver cancer [150], cutaneous T cell lymphoma [151] and uveal melanoma [152]. On the other hand, Wanderlust [153] was used to uncover the dynamics of single-cell transcriptomes in melanoma [154] over the pseudotime dimension.
Single-cell approaches still have critical technical limitations such as allelic dropout or doublets, which result in missing values in genotype calls and thus hamper robust analyses of TH. One promising approach to deal with these experimental artifacts is the integration of single-cell and bulk sequencing data. For example, ddClone [36] infers subclonal structures by a typical SNV-based scheme, but the clustering of VAF values is informed with single-cell genotypes. B-SCITE [140] and PhISCS [142] are subclonal phylogeny-aware methods that also combine the single-cell and bulk sequencing methods. Moreover, such integrative approaches are also effective for transcriptome-based cell-type deconvolution [155–157].
Recently, intriguing observations are emerging along with the technological advances that enabled the simultaneous measurement of multiple omics from a single cell. For example, G&T-seq [158] and TARGET-seq [159] revealed that the genomic and transcriptomic TH were tightly linked within a cell. In addition, joint profiling of single-cell transcriptome and chromatin states with scCAT-seq enabled the characterization of cellular subpopulations with different regulatory states [160]. Collectively, these findings recapitulate the necessity of integrative multi-omics characterization of TH. Currently, the single-cell multimodal sequencing methods are inadequate to replace bulk sequencing in terms of scalability and completeness of the measurements. Therefore, based on the conceptual background established by single-cell multi-omics studies, it is essential to implement multi-omics integrative methods based on bulk data.
Towards multi-omics and machine learning approaches for tumor heterogeneity chracterization
Integrative analysis of parallel evolution of genomes and epigenomes in cancer
The striking similarities and differences between genetic evolution (inferred from SNV or SCNA) and epigenetic evolution (inferred from DNA methylation) have offered an exciting avenue for TH studies: taking advantage of the complementarity between the two omics layers. The similarity between phylogenetic and phyloepigenetic trees have been reported in a wide variety of cancer types [161–166], opening up the possibility of an integrative analysis of phylogenetic and phyloepigenetic evolutionary histories. However, even though it has been shown that the epigenomic-genomic co-evolution [167] occurs, it remains questionable whether the co-evolution is ubiquitous across cancer types. Interestingly, in AML, the two layers of heterogeneity were found to be not necessarily linked to each other [168]. It implied that the genetic and epigenetic evolution in cancer might occur independently in some cases, yet not denying the co-evolution of those two omics layers in other cases. The results collectively imply that the two omics layers evolve `in parallel', which in turn can show convergent or distinct evolutionary histories depending on cancer types.
To our knowledge, computational methods utilizing the complementarity of epigenetic and genetic cancer evolution are not yet developed. However, since high-throughput data for cancer genomes and DNA methylomes have been rapidly accumulating, it would be an attractive field of research to conduct a joint inference of phylogenetic and phyloepigenetic trees. Although the details must be elaborated in further researches, it may be implemented by iterative and alternative inferences of phylogenetic and phyloepigenetic trees while constraining one tree by the other tree based on the candidate subclone that is likely to be appearing in both of the trees.
Integrating epigenomes and transcriptomes for cell-type deconvolution
We have already discussed various approaches using epigenome or transcriptome to infer the proportions of diverse cell types comprising tumor microenvironment. Despite those successful applications of individual-omics approaches, we still have room to improve the accuracy and robustness through integrating multi-omics molecular profiles. EDec [169] is a cell-type deconvolution approach that combines transcriptome and DNA methylome. It first selects a set of informative CpG loci with a catalog of reference methylomes of known cell types and infers underlying cell-type proportions. Subsequently, cell-type-specific transcriptome profiles are inferred using the proportions, which enables differential expression analysis done for each cell type separately.
ML approaches and applications
Most TH characterization approaches discussed above are based on explicit statistical modeling and manual feature selection, and their performances largely depend on our prior knowledge. Fortunately, as many large-scale studies of TH have been conducted by various international consortia [170, 171], we are gradually reaching a sufficient amount of relevant data to train a model to automatically learn the common characteristics of TH. In this section, we provide some insights on several possible approaches and applications of ML frameworks for future TH studies and introduce relevant works.
Data-driven feature extraction Feature extraction is the core principle behind how a machine learns and generalizes, where only the features relevant to the task are extracted from the noisy data. Clinical molecular profile data suffer from extreme noise arising from biological and technical variability. However, as the number of data grows, there will be a greater chance that an ML model captures biologically meaningful and common modules of TH, hopefully suggesting novel insights about cancer evolution. Recent approaches called REVOLVER [172] and Hintra [39] adopt the transfer learning paradigm to leverage the shared characteristics across a cohort of tumor samples. Both algorithms jointly optimize multiple tumor phylogenies across patients to capture repeated evolutionary trajectories. By penalizing unusual orderings of driver events that do not correlate well with other orderings in the cohort, the model is guided to find the recurrent evolutionary orderings. Since the method can extract recurrent snippets of driver events in a particular order, it allows us to dissect and arrange driver events in the correct order even if they were ambiguously intermingled inside a single subclone and could not be segregated by an inference with a single sample alone. This application of ML for fine-grained phylogenetic reconstruction of driver events is comparable to a super-resolution in the field of computer vision in a sense that the model extracts recurring patterns from a collection of data and exploit the patterns to get a higher-resolution view of a sample.
Ensemble learning Ensemble learning is an ML technique that improves the performance and generalization of models by combining multiple models trained to capture different aspects of data. As many different statistical approaches have been proposed for various TH characterization tasks, it will be interesting to see if ensembling those approaches improves the performance. Pioneering examples of ensemble learning methods include consensus purity estimation, defined as a median of normalized purity estimates from ESTIMATE, ABSOLUTE, LUMP and immunohistochemistry [76], and RF_Purify, a meta-learning approach that trains a random forest model predicting ABSOLUTE and ESTIMATE tumor purity estimates [173].
Multi-omics TH as a covariate We expect that information about TH extracted from multi-omics data (e.g. tumor purity, number of subclones, evolutionary histories or microenvironment composition) may serve as a novel and robust features for various clinical tasks such as cancer subtyping, prognosis prediction and optimal therapy design. Conventional molecular subtypes [87, 174] are usually defined using individual-omics measurements of bulk tumor samples, and thus the robustness of subtyping is predominantly confounded by the composition of cells. Moreover, it has been reported that the characteristics of cancer subtypes can be determined at a multi-omics level [175], which implies the existence of intrinsic subtypes that might have been neglected by individual-omics subtypes. Incorporating extracted multi-omics TH as a covariate in such tasks will provide more precise and robust results in clinical cancer researches. For example, conventional marker gene-based subtyping strategies may be refined to be dynamically adjusted according to the microenvironmental cell-type composition of the biopsy.
Conclusion and perspective
A comprehensive understanding of multi-omics TH will lead to a more precise therapeutic strategy that precisely targets every subclone at the same time. Furthermore, computationally deconvolving the mixed effects of various cancer-associated molecular aberrations may facilitate the experimental reproducibility and unveil hidden association between an aberration and cancer. Due to the complexity and large size of the molecular data, this problem can only be tackled by bioinformatic approaches.
Development of computational methods is possible only with a solid conceptual basis of multi-omics TH, and thus we need to continuously seek for the experimental evidence in parallel with algorithmic advancement. Fortunately, thanks to the development of single-cell sequencing technologies, we are gaining confidence in the existence of interplay between multiple omics layers that comprise TH [176]. While single-cell approaches have shown their great potential for exploratory analyses, we still need to establish systematic strategies based on bulk-cell multi-omics data for scalable and clinically applicable practice of cancer therapies. As we have discussed above, ideas proposed by numerous methods exploiting individual-omics layers may be good starting points for the integrative methods.
One another way to enhance our understanding of multi-omics TH is to employ data-driven ML approaches. Conventional TH characterization is usually sample-specific, which does not account for common characteristics of each cancer type. By utilizing accumulating molecular profiles of tumor samples, novel ML approaches may demonstrate the underlying patterns and similarities of TH within each cancer type, leading to a significant breakthrough in cancer therapeutics.
A tumor sample consists of heterogeneous cellular populations, including diverse subclonal cancer cells, stromal cells and infiltrating immune cells. This TH harbors significant clinical potential. Although TH often exists across multi-omics layers, most computational approaches for TH characterization only rely on individual omics data.
To facilitate the development of multi-omics integrative methods for TH characterization, we provide a comprehensive review of existing computational methods to characterize TH based on genome, epigenome and transcriptome. Furthermore, we introduce some pioneering multi-omics integrative methods.
Multi-omics molecular profiles of cancers are rapidly accumulating. Therefore, we suggest some potential applications of data-driven ML approaches for TH characterization.
Funding
Collaborative Genome Program for Fostering New Post-Genome Industry of the National Research Foundation (NRF) funded by the Ministry of Science and ICT (NRF-2014M3C9A3063541); Next-Generation Information Computing Development Program through the NRF funded by the Ministry of Science, ICT (NRF-2017M3C4A7065887); Korea Health Technology R&D Project through the Korea Health Industry Development Institute, funded by the Ministry of Health & Welfare, Republic of Korea (HI15C3224); Bio & Medical Technology Development Program of the NRF (NRF-2019M3E5D4065965).
Dohoon Lee is a PhD student of Interdisciplinary Program in Bioinformatics at Seoul National University. His research interests include tumor heterogeneity, computational epigenomics and machine learning.
Youngjune Park is a PhD student of Interdisciplinary Program in Bioinformatics at Seoul National University. His research interests include tumor evolution and machine learning.
Sun Kim is a professor of the department of computer science and engineering at Seoul National University. His research group focuses on bioinformatics and machine learning.
References
Author notes
Dohoon Lee and Youngjune Park are co-first authors and have contributed equally to this work.
