


Abstract
TP53 mutation is one of the most common genetic changes in hepatocellular carcinoma (HCC). It is of great clinical significance to tailor specialized prognostication approach and to explore more therapeutic options for TP53-mutant HCCs. In this study, a total of 1135 HCC patients were retrospectively analyzed. We developed a random forest-based prediction model to estimate TP53 mutational status, tackling the problem of limited sample size in TP53-mutant HCCs. A multi-step process was performed to develop robust poor prognosis-associated signature (PPS). Compared with previous established population-based signatures, PPS manifested superior ability to predict survival in TP53-mutant patients. After in silico screening of 2249 drug targets and 1770 compounds, we found that three targets (CANT1, CBFB and PKM) and two agents (irinotecan and YM-155) might have potential therapeutic implications in high-PPS patients. The results of drug targets prediction and compounds prediction complemented each other, presenting a comprehensive view of potential treatment strategy. Overall, our study has not only provided new insights into personalized prognostication approaches, but also thrown light on integrating tailored risk stratification with precision therapy.
Introduction
Hepatocellular carcinoma (HCC) is the third leading cause of cancer-related death worldwide, causing more than 700,000 deaths annually [1]. Despite the rapid progression of new diagnostic methods and therapeutic strategies, the high level of heterogeneity in HCC still makes the prognosis prediction and treatment exceedingly challenging [2]. Over the decade, a considerable amount of work has been done to develop gene signatures for its prognosis prediction [3–6]. For example, Liu et al. developed a four-gene (ACAT1, GOT2, PTDSS2 and UCK2) metabolic signature with prognostication potential for HCC patients [7]. Yan et al. [4] also identified a four-gene signature (PBK, CBX2, CLSPN and CPEB3) for HCC prognosis prediction. Nevertheless, most prognostic signatures were developed based on the entire HCC population without exploring tailored clinical management for high-risk patients, which is insufficient for precise risk stratifications and treatments.
Although cancer cells display similar hallmark behaviors, individual tumors barely share the same mutations [8]. Mutation in the tumor suppressor gene TP53 is the most common genetic change in HCC, and the frequency of TP53 mutation is 30% on average [9]. It is worth mentioning that this frequency can increase to nearly 60% in patients with HBV-associated HCC [10, 11]. Wild-type p53 protein is critical for cell cycle regulation and apoptosis after DNA damage [9]. Cells with mutant p53 protein can escape apoptosis and transform into cancer cells upon DNA damage events [9, 12]. TP53 mutation is correlated with tumor differentiation, vascular invasion, serum alpha-fetoprotein (AFP) levels and tumor stage in HCC [9]. It has also been demonstrated that TP53 mutation is strongly related to the immune microenvironment in HCC [9]. Most importantly, HCC patients with mutated TP53 have shorter overall survival (OS) and relapse-free survival times than those with wild-type TP53 [5, 9]. Taken together, it is essential to tailor specialized management for TP53-mutant HCC.
To address above issues, for the first time, we developed a prognostic signature for HCC with TP53 mutation and predicted potential therapeutic targets as well as agents for those high-risk patients. We constructed a random forest (RF) prediction model to estimate TP53 mutational status, successfully tackling the problem of limited sample size in TP53 mutated HCCs. A poor prognosis-associated signature (PPS) was then developed, which had superior ability to predict survival in TP53-mutant patients compared with previously established population-based signatures. Further, three therapeutic targets (CANT1, CBFB and PKM) and two agents (irinotecan and YM-155) were identified for those high-risk patients, holding the potential to improve current population-based therapeutic strategies in HCC.
Materials and methods
RNA-sequencing cohorts
Chinese HCC patients with hepatitis B virus (HBV) infection (CHCC-HBV) cohort was consisted of paired tumor and non-tumor liver tissues from 159 HCC patients who underwent primary curative resection between 2010 and 2014 at Zhongshan Hospital (Fudan University, Shanghai, China) [11]. Fragments per kilobase per million reads (FPKM) normalized gene expression data of CHCC cohort was accessed via NODE (https://www.biosino.org/node). FPKM values were transformed into transcripts per kilobase million (TPM) values that were more comparable between samples. Somatic mutation status from whole-exome sequencing (WES) of 159 samples was obtained from the supplementary files of reference [11]. In addition, gene-level proteomics data were downloaded from the Clinical Proteomic Tumor Analysis Consortium (CPTAC) website (https://proteomics.cancer.gov/programs/cptac), and protein abundances were log2-transformed and median-centered.
Liver cancer—RIKEN, JP project (LIRI-JP) included 231 HCC samples, which belonged to Japanese population primarily infected with HBV/HCV [13]. Gene expression data (raw counts), somatic mutation data and clinical data were achieved from the International Cancer Genome Consortium (ICGC) portal (https://dcc.icgc.org/projects/LIRI-JP). Raw counts were transformed into TPM values for subsequent analysis.
The Cancer Genome Atlas Liver Hepatocellular Carcinoma (TCGA-LIHC) cohort included 373 HCC patients with multi-omics data. Gene expression data (raw counts) and somatic mutation data were obtained from TCGA website (https://portal.gdc.cancer.gov/repository). Survival data corresponding to the HCC samples were achieved from TCGA Pan-Cancer Clinical Data Resource (TCGA-CDR). 352 HCC samples with available gene expression data, TP53 mutation data and corresponding clinical information at the same time were subjected to subsequent analyses. TPM normalization was also performed on raw counts data.
Microarray cohorts
The expression data and detailed clinical information of GSE14520 (including 221 HCC samples based on GPL3921 platform) and GSE76427 (including 115 HCC samples based on GPL10558 platform) were downloaded from the Gene Expression Omnibus (GEO) (http://www.ncbi.nlm.nih.gov/geo/). For GSE14520 cohort, raw expression data from Affymetrix were normalized using robust multi-array average (RMA) method located in R-package Affy. For GSE76427 cohort, the expression data from Illumina were normalized using the robust spline normalization method located in R-package lumi. The raw transcriptional profiling data of another cohort, E-TABM-36, were downloaded from the ArrayExpress Microarray Database (https://www.ebi.ac.uk/arrayexpress/). The raw expression data of 65 samples based on GPL571 platform (Affymetrix) were also normalized by RMA method. Notably, 59 samples in E-TABM-36 cohort had annotation information on TP53 mutation.
Cancer cell line data
Expression profile data and somatic mutation data of human cancer cell lines (CCLs) were obtained from the Broad Institute-Cancer Cell Line Encyclopedia (CCLE) project (https://portals.broadinstitute.org/ccle/) [14]. The CERES scores of genome-scale CRISPR knockout screens for 18,333 genes in 739 cell lines were acquired from the dependency map (DepMap) portal (https://depmap.org/portal/). CERES score is used to measure the dependency of the gene of interest in certain CCL, and a lower score indicates a higher likelihood that the gene is essential in cell growth and survival of a given CCL.
Drug sensitivity data of CCLs were achieved from the Cancer Therapeutics Response Portal (CTRP v.2.0, released October 2015, https://portals.broadinstitute.org/ctrp) and PRISM Repurposing dataset (19Q4, released December 2019, https://depmap.org/portal/prism/). The CTRP contains the sensitivity data for 481 compounds over 835 CCLs and the PRISM contains the sensitivity data for 1448 compounds over 482 CCLs. Both two datasets provide the area under the dose–response curve (area under the curve—AUC) values as a measure of drug sensitivity, and lower AUC values indicate increased sensitivity to treatment. K-nearest neighbor (k-NN) imputation was applied to impute the missing AUC values. Before imputation, compounds with more than 20% of missing data were excluded. Because the CCLs in both datasets were obtained from the CCLE project, molecular data in CCLE were thus used for subsequent CTRP and PRISM analyses.
Statistical analysis
All statistical tests were performed in R statistical software (v3.6.0, R Core Team, R Foundation for Statistical Computing, Vienna, Austria). Comparison of a continuous variable in two or more than two groups was performed using either parametric test (Student’s t-test or analysis of variance) if the variable was normally distributed or nonparametric test (Wilcoxon rank-sum test or Kruskal–Wallis test). Correlation between two continuous variables was measured by either Pearson’s r correlation or Spearman’s rank-order correlation. The hazard ratio (HR) was estimated using a Cox regression model using survival R package. Survival analysis was carried out using Kaplan–Meier methods and the log-rank test was used to determine the statistical significance of differences. Time-dependent area under the receiver operating characteristic curve (AUC) was computed using the timeROC R package. Time-dependent concordance index (C-index) was calculated using pec R package. Nearest template prediction (NTP) analyses (GenePattern, https://cloud.genepattern.org/) was used to predict previously published HCC classifications based on the provided subclass specific signatures. For all statistical analysis, a two-tailed P < 0.05 was considered significant.
See supporting information (Supplementary methods) for fully detailed methods descriptions, including TP53 mutation prediction, gene selection and model development, Pathifier analysis and gene set enrichment analysis, drug target analysis, estimation of drug response in clinical samples, and connectivity map analysis.
Results
Clinical characteristics of included populations
A summary of detailed information of all clinical cohorts included in this study is presented in Table S1, available online at https://dbpia.nl.go.kr/bib, and a flow chart of study design is displayed in Figure 1A. A total of 1135 HCC patients from six clinical cohorts (CHCC-HBV, LIRI-JP, TCGA-LIHC, GSE14520, GSE76427 and E-TABM-36) were retrospectively analyzed in this study (see Table S2 available online at https://dbpia.nl.go.kr/bib). Of these patients, 863 (76.04%) were male and 272 (23.96%) were female, and the median age at diagnosis was 60 years (range: 14–93 years; cut-off value of age in other analyses was set at 55 years). Prognosis information was available in 1116 patients, and TP53 mutation status was available for 799 patients. We conducted survival analysis on 780 patients with both available prognosis and TP53 mutation information to investigate the prognostic difference between TP53-mutant and wild-type patients. The result showed a significant prognostic difference between two groups, with longer median survival time (MST) in TP53 wild-type group (MST = 81.87 months, 95% confidence interval [CI]: 64.51–99.22 months) than in TP53-mutant group (MST = 46.57 months, 95% CI: 39.82–53.31 months, P < 0.001), which was consistent with the conclusion of previous study (Figure 1B) [5].
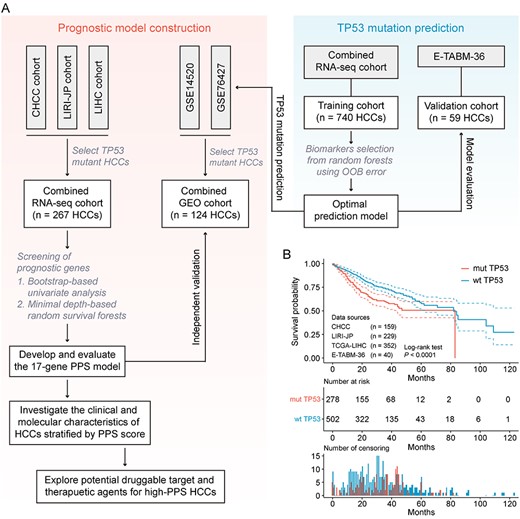
Design overview. (A) Schematic diagram of the study design. (B) Kaplan–Meier curves for OS of 780 HCC patients demonstrate that TP53-mutant patients have statistically significantly worse prognosis than TP53 wild-type patients (log-rank test, P < 0.00001).
A robust model predicts TP53 mutations based on transcriptome data
As described in the Methods section, a robust model for TP53 mutation prediction was first constructed using RF method on the combined RNA-seq cohort (after removing batch effect, see Figure S1A available online at https://dbpia.nl.go.kr/bib). This prediction model achieved a prediction accuracy of 100% in the training cohort (combined RNA-seq cohort) and 93.2% in the independent validation cohort (E-TABM-36). ROC curve was also applied to assess model performance, and the AUC close to 1 indicating a high sensitivity at a very low false positive rate of the model. The model achieved an AUC of 1.00 in training cohort and 0.96 in validation cohort, suggesting that the performance of this model was efficient enough for TP53 mutation prediction in other transcriptomic cohorts (see Figure S2A and B available online at https://dbpia.nl.go.kr/bib). Next, we applied this model to GSE14520 and GSE76427 to identify estimated TP53-mutant samples. These samples were then merged into one combined cohort (n = 124) with batch effect removal (see Figure S1B available online at https://dbpia.nl.go.kr/bib). For subsequent prognostic signature development, the TP53-mutant samples in combined RNA-seq cohort were taken as training set, while the estimated TP53-mutant samples in combined GEO cohort were used as independent testing set.
Development of 17 gene-based PPS in TP53-mutant HCCs
A total of 267 TP53-mutant HCC patients with available clinical information in combined RNA-seq cohort were used to develop the prognostic signature. Univariate cox proportional hazards regression analysis was first performed and preliminarily identified 1630 genes correlated with OS (P < 0.01). Using bootstrapping method, we further identified 709 genes that were stably correlated with prognosis in more than 900 bootstrap iterations. Next, we used minimal depth (MD)-based random survival forest (RSF) method to select the most important features associated with prognosis. The RSF analysis was repeated 1000 times and a 17-gene set in the model with the largest C-index value was considered as PPS and was retained for further studies (see Figure S3A available online at https://dbpia.nl.go.kr/bib). Cox multivariate regression model was then used to calculate the Cox regression coefficient of signature genes, and PPS score of each sample was defined as taking the sum of regression coefficient for each of PPS genes multiplied with its expression value. The detailed information of 17 PPS genes was listed in Table S3, available online at https://dbpia.nl.go.kr/bib.
To investigate the relationship between 17 PPS genes and TP53, we conducted the correlation analysis between the mRNA expression of TP53 and PPS score, and between the mRNA expression of TP53 and 17 PPS-associated genes, respectively. The results showed that these pairs all had low-correlation coefficient values (r < 0.30), suggesting that the expression level of these gene pairs had weak linear correlation (see Figure S4A and B available online at https://dbpia.nl.go.kr/bib). We also performed functional similarity analysis with these 18 genes using GOSemSim package. This analysis is based on the assumption that if the functions of the two gene products are similar, their location in GOtree tends to be close. The distributions of functional similarities between these genes were visualized in Figure S4C, available online at https://dbpia.nl.go.kr/bib, and the result suggested that TP53 had high functional similarities with PPS-associated genes (see also Table S4 available online at https://dbpia.nl.go.kr/bib). In addition, differential expression analysis of PPS genes between TP53 mutant and wild-type HCCs was performed, and 11 of 17 PPS genes exhibited significantly differential expression levels between two groups (see Figure S4D and Table S5 available online at https://dbpia.nl.go.kr/bib).
Evaluation of the prognostic potentiality of PPS
For Kaplan–Meier survival analysis, patients in training and testing cohorts were divided into high and low PPS score groups according to the median value of PPS score (In other cases, PPS was consistently regarded as a continuous variable unless otherwise specified). In both cohorts, significant prognostic difference was observed between two groups, with longer MST in low PPS score group than that in high PPS score group (Figure 2A and B). In three independent RNA-seq cohorts, the results of survival analyses also revealed that the prognostic difference of TP53-mutant HCC patients stratified by median PPS score was statistically significant (see Figure S3B–D available online at https://dbpia.nl.go.kr/bib). To investigate the relationship between PPS and mortality, we divided patients into quartile groups with different relative risk (1/4–4/4) according to their PPS scores. Patients with higher relative risk showed a trend toward higher 3-year (Figure 2A and B) and 5-year (see Figure S3E available online at https://dbpia.nl.go.kr/bib) mortality in both training cohort and testing cohort. In addition, the distributions of PPS scores, survival time, survival status and corresponding expression profiles of 17-gene signature were also presented in Figure S3F, available online at https://dbpia.nl.go.kr/bib.
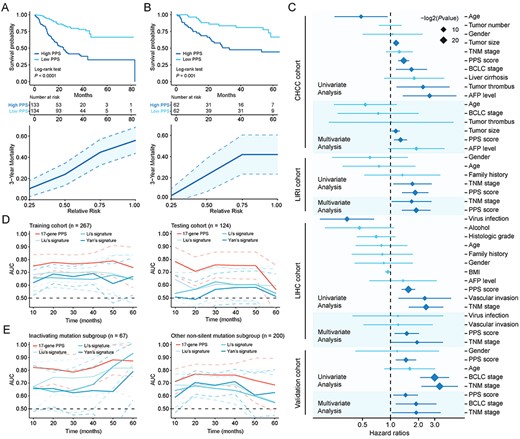
Evaluation of prognostic value of 17-gene PPS. (A) Kaplan–Meier curves of OS for patients stratified by median PPS score (upper) and the relationship between PPS score (quartile groups) and 3-year mortality (lower) in the training cohort. (B) Kaplan–Meier curves of OS for patients stratified by median PPS score (upper) and the relationship between PPS and 3-year mortality (lower) in the testing cohort. (C) Forrest plot of the univariate and multivariate Cox regression analysis in CHCC, LIRI, LIHC and validation cohorts (see also Table S6 available online at https://dbpia.nl.go.kr/bib). (D) Time-dependent area under the receiver operating characteristic (ROC) curve for the comparison of PPS with other three signatures in the training (left) and testing cohort (right). (E) Time-dependent area under the ROC curve for the comparison of PPS with other three signatures in the inactivating mutation subgroup (left) and other non-silent mutation subgroup (right). Survival difference was compared using log-rank test. Dotted lines on the time-dependent area under the ROC curve plots represent 95% CI.
Univariate and multivariate analysis were performed to assess whether PPS was an independent prognostic factor in TP53-mutant patients from CHCC, LIRI, LIHC and combined GEO cohort, respectively. Univariate analysis was first conducted using all clinical variables, and variables with P value <0.05 in univariate analysis were used to construct multivariable Cox model. Variables with statistical significance (P < 0.05) in multivariable analysis were considered as independent prognostic factors. In all four cohorts, PPS was found to be an independent prognostic factor, after adjusting for prognosis-related clinical variables (CHCC: HR = 1.28, 95% CI =1.09–1.51, P = 0.003; LIRI: HR = 1.89, 95% CI = 1.33–2.70, P < 0.001; LIHC: HR = 1.50, 95% CI =1.11–2.03, P = 0.009; combined GEO cohort: HR = 1.45, 95% CI = 1.07–1.97, P = 0.016) (Figure 2C and see Table S6 available online at https://dbpia.nl.go.kr/bib).
Previous studies have identified several population-based prognostic signatures for HCC patients, including Liu et al.’s four-gene signature [7], Li et al.’s three-gene signature [3] and Yan et al.’s four-gene signature [4]. To determine whether PPS has superior ability to predict survival in TP53-mutant patients compared with above population-based signatures, we carried out time-dependent ROC analyses. Results showed that PPS exhibited higher mean AUC values than other three population-based signatures in both training (PPS: 0.766 versus Liu: 0.685, Li: 0.658, Yan: 0.656) and testing cohorts (PPS: 0.712 versus Liu: 0.602, Li: 0.569, Yan: 0.534) (Figure 2D and see Figure S5A available online at https://dbpia.nl.go.kr/bib), indicating that PPS was a more suitable model for predicting clinical prognosis than other signatures in TP53-mutant HCC patients (see Table S7 available online at https://dbpia.nl.go.kr/bib). In addition, the calibration plots were also presented to evaluate the agreement between observed survival and PPS-predicted survival in both training and testing cohort (see Figure S5B available online at https://dbpia.nl.go.kr/bib).
We also compared the AUC values of PPS with conventional prognosis-related clinical features in CHCC, LIRI, LIHC and combined GEO cohort, respectively. PPS showed higher mean AUC values than prognosis-related clinical features in all four cohorts (CHCC: 0.762 [PPS] versus 0.711 [tumor size], 0.631 [BCLC stage] and 0.533 [TNM stage]; LIRI: 0.732 [PPS] versus 0.718 [TNM stage]; LIHC: 0.805 [PPS] versus 0.646 [TNM stage]; combined GEO cohort: 0.712 [PPS] versus 0.697 [BCLC stage] and 0.695 [TNM stage]) (see Figure S6 available online at https://dbpia.nl.go.kr/bib).
Evaluation of prognostic value of PPS in subgroups with different types of mutation
Considering that different mutation types of TP53 may have different roles in tumorigenesis, we further divided patients in RNA-seq cohort into two subgroups, inactivating mutation subgroup (including nonsense and frame-shifting mutations; the protein is usually nonfunctional) and other non-silent mutation subgroup (the protein may still be partially functional) [15, 16]. We conducted survival analysis in two subgroups respectively, and significant prognostic difference between high and low PPS score patients was observed in both subgroups, with consistently longer MST in low PPS score group than that in high PPS score group (see Figure S7 available online at https://dbpia.nl.go.kr/bib). Besides, the results of time-dependent ROC analyses indicated that PPS had higher mean AUC values than other three population-based signatures in both inactivating mutation subgroup (PPS: 0.834 versus Liu: 0.759, Li: 0.734, Yan: 0.668) and other non-silent mutation subgroup (PPS: 0.736 versus Liu: 0.650, Li: 0.628, Yan: 0.654) (Figure 2E and see Figure S5C and Table S7 available online at https://dbpia.nl.go.kr/bib). The calibration plots showed the agreement between PPS model and ideal model in two subgroups were also performed (see Figure S5D available online at https://dbpia.nl.go.kr/bib; only 3-year calibration curve was plotted in inactivating mutation subgroup due to the limited number of patients with more than 5-year follow-up time). Taken together, these results demonstrated PPS could still maintain good predictive performance in subgroups with different types of mutation.
Evaluation of prognostic value of PPS in TP53 wild-type patients
Complementarily, the prognostic potential of PPS in TP53 wild-type patients was also evaluated. PPS score of each TP53 wild-type patient in combined RNA-seq cohort and combined GEO cohort was calculated, and the prognostic difference of patients stratified by median PPS score was then determined using log-rank test. In combined RNA-seq cohort, the prognosis was significantly poorer in the high PPS score group than in the low PPS score group (see Figure S8A available online at https://dbpia.nl.go.kr/bib). However, in combined GEO cohort, no statistical significance was detected between two groups (see Figure S8B available online at https://dbpia.nl.go.kr/bib). The time-dependent ROC analysis was then used to compare the predictive performance between PPS and other signatures in combined RNA-seq cohort, and a numerically lower AUC of PPS was observed (mean AUC value: 0.670 [PPS] versus 0.691 [Liu], 0.694 [Li], and 0.683 [Yan]), suggesting that PPS failed to maintain a good predictive performance in TP53 wild-type HCC patients (see Figure S8C and D available online at https://dbpia.nl.go.kr/bib).
Correlation between PPS and HCC molecular and clinical characteristics
Many robust transcriptome-based subclasses of HCC have been identified in the past decade, including Boyault et al.’s classification (G1–G6) [17], Chiang et al.’s classification (five subclasses) [18], Hoshida et al.’s classification (S1–S3) [2], Désert et al.’s classification (four subclasses) [19] and Yang et al.’s classification (C1–C3) [20]. To investigate the correlation between PPS and molecular subclasses, we used NTP method to make subclass prediction based on subclass-specific signatures and compared the difference of PPS scores between different subclasses. PPS scores were found to be higher in Boyault’s G3, Désert’s ECM/STEM, Hoshida’s S1 and S2, and Yang’s C2 subclasses (Figure 3A and see Table S8 available online at https://dbpia.nl.go.kr/bib). Notably, these subclasses were demonstrated to have worse prognosis by corresponding studies, which was consistent with their characteristic of higher PPS scores.
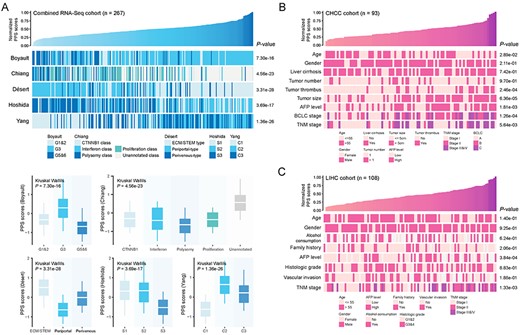
Correlation between PPS and HCC molecular and clinical characteristics. (A) An overview of the association between PPS and HCC molecular subclasses (upper) and boxplots of PPS scores stratified by different subclasses (lower) (see also Table S8 available online at https://dbpia.nl.go.kr/bib). (B) An overview of the association between PPS and HCC clinical characteristics in CHCC cohort. (C) An overview of the association between PPS and HCC clinical characteristics in LIHC cohort. The statistical significance of difference was determined using Kruskal–Wallils test.
Next, we explored the relationship between PPS and conventional clinical characteristics in CHCC, LIRI, LIHC and combined GEO cohort, respectively. In all cohorts, more advanced clinical stages (including BCLC and TNM stage systems) were associated with higher PPS scores. Besides, other clinical characteristics, including age, tumor thrombus, tumor size and AFP level, were also found to be correlated with PPS (Figure 3B, C and see Figure S9 available online at https://dbpia.nl.go.kr/bib).
Identification of PPS-related biological processes
To investigate which biological processes are involved in poor prognosis of TP53-mutant HCC patients, we conducted transcriptome-based Pathifier analysis and proteome-based gene set enrichment analysis (GSEA). First, Pathifier analysis was performed using expression profiles from TP53-mutant tumor and paired normal samples, and pathway deregulation score (PDS) which could exhibit the degree of dysregulation of certain biological process was thus obtained. The correlation analysis between PDS and PPS score was conducted, and biological processes with positive correlation coefficient were considered to be associated with poor prognosis in TP53-mutant patients. The result indicated that proliferation-related processes, such as Myc targets v1 and Myc targets v2, and metabolism-related processes, such as glycolysis, fatty acid metabolism, and bile acid metabolism, showed the highest correlation with poor prognosis (Figure 4A).
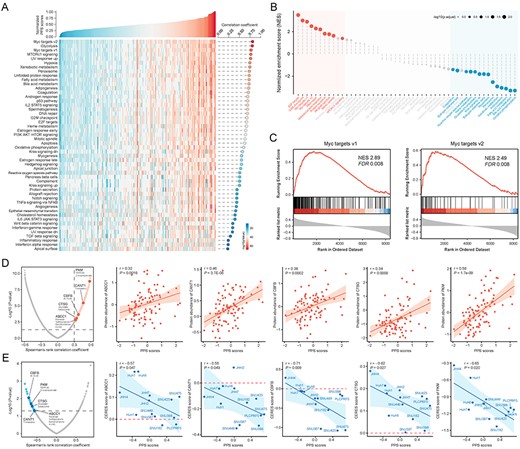
Identification of PPS-related biological processes and drug targets. (A) An overview of the association between PPS and PDS. The correlation coefficient and significance are determined using Spearman’s correlation. (B) The result of gene set enrichment analysis shows high PPS score-associated (red) and low PPS score-associated (blue) biological processes (see also Table S9 available online at https://dbpia.nl.go.kr/bib). Color toward gray on the plot indicates no statistical significance. (C) Two representative GSEA enrichment plots of the ‘Myc targets v1’ and ‘Myc targets v2’ hallmarks. (D) Volcano plot (left) and scatter plots (right) of Spearman’s correlations and significance between PPS scores and protein expression of drug targets (see also Table S11 available online at https://dbpia.nl.go.kr/bib). Red dots indicate the significant positive correlations (P < 0.05, and Spearman’s r > 0.3). (E) Volcano plot (left) and scatter plots (right) of Spearman’s correlations and significance between PPS score and CERES score of drug targets (see also Table S11 available online at https://dbpia.nl.go.kr/bib). Blue dots indicate the significant negative correlations (P < 0.05, and Spearman’s r < −0.5). TP53-mutant hepatoma cell lines are labeled on the scatter plots.
Next, we performed GSEA using proteomics data from CHCC cohort (93 TP53-mutant patients) to validate above conclusion. The correlation coefficient between PPS and abundance of 8456 gene-level proteins was first calculated, and GSEA was then performed using the list of correlation coefficient as input. The result showed that proteins with positive correlation coefficient were enriched in proliferation-related processes, including E2F targets, G2M checkpoint, Myc targets v1 and Myc targets v2, while proteins with negative correlation coefficient were enriched in metabolism-related processes, including oxidative phosphorylation, bile acid metabolism and fatty acid metabolism (Figure 4B and C and see Table S9 available online at https://dbpia.nl.go.kr/bib). As expected, the PPS-related biological processes identified by above two methods were highly consistent, and thus the dysregulation of proliferation and metabolism-related processes might be possible factors leading to poor prognosis in TP53-mutant patients.
Identification of potential drug targets for high PPS score HCCs
Proteins presenting a high positive correlation with PPS might have potential therapeutic implication in high PPS score patients. However, most of human proteins remain undruggable for the reason that they lack obvious active sites to which small-molecule compounds can bind or are found within cells out of reach of biological agents. Therefore, to identify potentially druggable therapeutic targets for TP53-mutant patients with poor prognosis, we collected the target information of 6125 compounds and conducted a two-step analysis to find candidate targets (see Table S10 available online at https://dbpia.nl.go.kr/bib). First, the correlation coefficient between the expression level of druggable proteins and PPS was calculated, and 163 protein targets were identified with correlation coefficient more than 0.30 (P < 0.05). Next, through conducting correlation analysis between CERES score and PPS score based on TP53-mutant hepatoma cell lines, we further identified 43 poor prognosis-dependent targets (Spearman’s r < −0.5 and P < 0.05) (Figure 4D and E and see Table S11 available online at https://dbpia.nl.go.kr/bib). Five genes, including ABCC1, CANT1, CBFB, CTSG and PKM, were identified by both analyses above. Notably, the CERES scores of ABCC1 and CTSG were more than zero in most hepatoma cell lines, indicating that ABCC1 and CTSG might not be essential in HCC. The three remaining genes, CANT1, CBFB and PKM, were considered to be potential therapeutic targets, which meant that inhibiting the function of these three genes in high-PPS score patients might achieve favorable treatment efficiency.
Estimation of drug response in clinical samples
The CTRP and PRISM datasets contain the gene expression profiles and drug sensitivity profiles of hundreds of CCLs, which can be utilized to construct prediction model of drug response. The two datasets shared 160 compounds. After removing duplication, there were 1770 compounds in total (Figure 5A and see Table S12 available online at https://dbpia.nl.go.kr/bib). We excluded compounds with NAs in more than 20% of the samples and cell lines derived from hematopoietic and lymphoid tissue. Finally, 654 CCLs with 354 compounds in CTRP dataset and 439 CCLs with 1291 compounds in PRISM dataset were used for subsequent analysis.
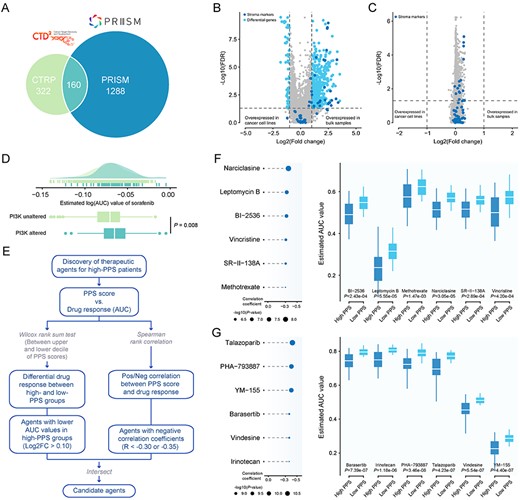
Identification of candidate agents with higher drug sensitivity in high-PPS score patients. (A) A venn diagram for summarizing included compounds from CTRP and PRISM datasets (see also Table S12 available online at https://dbpia.nl.go.kr/bib). (B) Volcano plot of differential expression between bulk HCC samples and hepatoma cell lines (Wilcoxon rank-sum test: adjust P < 0.05, and log2FC > 1). Stroma markers are highlighted in deep colour (see also Table S13 available online at https://dbpia.nl.go.kr/bib). (C) Volcano plot of differential expression between purified HCC samples and hepatoma cell lines (Wilcoxon rank-sum test: adjust P < 0.05, and log2FC > 1). Stroma markers are highlighted in deep color (see also Table S13 available online at https://dbpia.nl.go.kr/bib). (D) Comparison of estimated sorafenib’s sensitivity (logAUC) between PI3K-MTOR altered and unaltered groups. (E) Schematic outlining the strategy to identify agents with higher drug sensitivity in high PPS score patients. (F) The results of Spearman’s correlation analysis and differential drug response analysis of six CTRP-derived compounds. (G) The results of Spearman’s correlation analysis and differential drug response analysis of six PRISM-derived compounds. Note that lower values on the y-axis of boxplots imply greater drug sensitivity.
Compared with cell lines, conventional transcriptomes of clinical tumor sample are contaminated by normal and stroma components. Considering that the confounding transcriptional signals could reduce the accuracy of subsequent drug response prediction, we utilized ISOpure algorithm to eliminate the impact of non-tumor components, and this algorithm could yield a purified tumor expression matrix using non-tumor expression profiles as reference. To investigate whether the contribution of stroma to the tumor transcriptomes was removed after purification, we conducted differential expression analyses between bulk HCC samples and hepatoma cell lines, and between purified HCC samples and hepatoma cell lines, respectively. The results were visualized in Figure 5B and C and Table S13, available online at https://dbpia.nl.go.kr/bib, and 56 stroma markers were marked on the volcano plots. Before purification, close to half of stroma markers (46.4%) exhibited higher expression level in bulk HCC samples than those in hepatoma cell lines (log2FC > 1 and adjusted P < 0.05). After purification, no differentially expressed stroma markers between purified samples and cell lines was detected, suggesting that purified expression profiles were no longer affected by non-tumor components. Subsequently, the pRRophetic package which had a built-in ridge regression model was used to predict the drug response of clinical samples based on their purified expression profiles, and the estimated AUC value of each compound in each clinical sample was thus obtained.
Before proceeding further, we demonstrated that the results of drug response estimation were reliable. Sorafenib, a multi-targeted kinase inhibitor for the treatment of advanced HCCs, was used to investigate whether the estimated sorafenib’s response was consistent with its clinical efficacy. A recent study found that patients who harbored mutations in the PI3K-mTOR pathway (including PIK3CA, PTEN, TSC1 and TSC2) had lower rates of clinical benefit from sorafenib treatment and exhibited a worse prognosis compared with patients without mutations in PI3K-mTOR pathway [21]. We thus divided patients in the RNA-seq cohort into two groups according to their alteration status in PI3K-mTOR (altered versus unaltered: 83 versus 657). The difference of the estimated AUC values of sorafenib between two groups was compared using Wilcoxon rank-sum test, and the result indicated that patients with alterations in PI3K-mTOR showed significantly higher estimated AUC values (P = 0.008) (Figure 5D), consistent with how sorafenib behaved clinically.
Identification of potential therapeutic agents for high PPS score HCCs
Two different approaches were adopted to identify candidate agents with higher drug sensitivity in high PPS score patients (Figure 5E). The analyses were performed using CTRP and PRISM-derived drug response data, respectively. First, differential drug response analysis between PPS score-high (top decile) and PPS score-low (bottom decile) groups was conducted to identify compounds with lower estimated AUC values in PPS score-high group (log2FC > 0.10). Next, Spearman correlation analysis between AUC value and PPS score was used to select compounds with negative correlation coefficient (Spearman’s r < −0.30 for CTRP or −0.35 for PRISM). These analyses yielded six CTRP-derived compounds (including BI-2536, leptomycin B, narciclasine, methotrexate, SR-II-138A, and vincristine) and six PRISM-derived compounds (including barasertib, irinotecan, PHA-793887, talazoparib, vindesine and YM-155). All these compounds had lower estimated AUC values in PPS score-high group and a negative correlation with PPS (Figure 5F and G).
Although the 12 candidate compounds identified showed a higher drug sensitivity in PPS score-high patients, above analyses alone could not support the conclusion that these compounds had therapeutic effect in HCC. Therefore, multiple-perspective analyses were subsequently conducted to investigate the therapeutic potential of these compounds in HCC. We first used the CMap analysis to find compounds of which gene expression patterns were oppositional to the HCC-specific expression patterns (i.e. gene expression increased in tumor tissues but decreased by treatment of certain compounds). Four compounds, including narciclasine, irinotecan, PHA-793887 and YM-155, had CMap scores <−95, representing that these compounds might have potential therapeutic effect in HCC (see Table S14 available online at https://dbpia.nl.go.kr/bib). Secondly, fold-change differences of the expression levels (including mRNA- and protein-level) of candidates’ drug targets between tumor and normal tissue were calculated, and a higher fold change value indicated a greater potential of candidate agent for HCC treatment. Thirdly, a comprehensive literature search was performed in PubMed (https://www.ncbi.nlm.nih.gov/pubmed/) to find out the experimental and clinical evidence of candidate compounds in treating HCC. All results were presented in Figure 6 and see Table S15, available online at https://dbpia.nl.go.kr/bib. In general, irinotecan and YM-155, which had robust in vitro and in silico evidence, were considered to hold the most promising therapeutic potential in TP53-mutant HCC patients with high PPS scores.
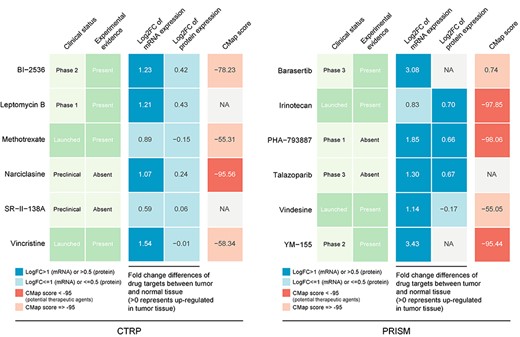
Identification of most promising therapeutic agents for high PPS score patients according to the evidence from multiple sources (see also Table S15 available online at https://dbpia.nl.go.kr/bib). Six CTRP-derived agents and six PRISM-derived agents were shown on the left and right of the diagram, respectively.
Discussion
In the last decade, high-throughput analyses of large number of samples have significantly propelled the understanding of HCC biology, enabling scientists to recapitulate the key events in hepatocarcinogenesis. Our increased knowledge of molecular profiling and genetic defects has been translated into new targets and biomarkers that influence HCC decision making, which has thrown light on improving patient’s outcomes [22]. TP53 is one of the most frequently mutated genes in HCC. Quite a few researches have revealed the role of TP53 as a biomarker of certain molecular characteristic and a prognostic factor for unfavorable survival in HCCs [9, 23, 24]. Considering the unique molecular and clinical characteristics of TP53-mutant HCC patients, it is essential to tailor specialized management for these patients. The aim of this study was to develop an efficient approach of prognosis prediction for TP53-mutant HCCs, and ultimately aid physicians in devising treatment strategies. As expected, PPS developed specifically for TP53-mutant patients had significantly better performance in prognostication compared with other whole population-based gene signatures. These results called for precise prognosis prediction approaches toward patients with similar biological patterns to achieve more reliable prognostication.
HCC tumors are highly heterogeneous between individuals, making it almost impossible to find a therapy fitting all HCC cases. Unfortunately, all current therapies for advanced HCC are population-based due to the lack of corresponding biomarkers, and thus failed to achieve satisfactory therapeutic effects. Therefore, finding tailored treatment strategies for specific groups, as one of the main purposes of this study, is of great significance to maximize the therapeutic effect. Apart from being informative regarding prognosis, PPS can also be used for precise oncology, as a biomarker to guide targeted treatment. Three potential therapeutic targets (CANT1, CBFB and PKM) and two agents (irinotecan and YM-155) were identified for high-PPS score HCC patients in this study.
The protein encoded by CANT1 belongs to the apyrase family. It functions as a calcium-dependent nucleotidase with a preference for uridine diphosphate (UDP) [25]. It has been reported that CANT1 is overexpressed in prostate cancer [26] and clear cell renal cell carcinoma (ccRCC) [27]. Silence of CANT1 suppresses cell proliferation, migration, invasion, arrests cell cycle in S phase and promotes apoptosis [27]. The CBFB gene encodes a transcription factor and has recently emerged as a highly mutated driver in several human malignancies including breast cancer [28], acute myeloid leukemia [29], prostate and ovarian cancer [30]. It has been well established that mutation in CBFB along with RUNX1 is critical for hematological malignancies. CBFB is involved in cell development, stem-cell homeostasis, and has been implicated in the control of cancer-related genes [30]. PKM encodes a pyruvate kinase involved in glycolysis [31]. This kinase has been shown to interact with thyroid hormone and may mediate cellular metabolic effects induced by thyroid hormones [31]. PKM is highly expressed in a variety of cancers such as gastric cancer [32], colon cancer [33], breast cancer [34], lung cancer [35], cervical cancer [36], especially HCC [35]. Taken together, evidence has shown that the three targets identified in current work all play special roles in malignant development, suggesting the feasibility of developing corresponding targeted therapies for high-risk TP53-mutant HCC.
Irinotecan is a topoisomerase I inhibitor that has been widely used as first-line chemotherapy in multiple anticancer therapies [37]. SN38, the in vivo active metabolite of irinotecan, undergoes enterohepatic recirculation resulting in high local concentrations in the hepatobiliary tree [38]. Numerous studies have shown that SN38 can inhibit HCC growth in vitro [37]. The efficacy of irinotecan has been evaluated in phase II studies of HCC patients. However, objective response rates of using irinotecan alone were only 0–7% [39, 40]. Research demonstrated that a combination of Dasatinib and irinotecan/SN38 was able to reinforce anti-HCC efficacy and might be a potential medical choice for HCC therapy [37]. Interestingly, a study investigating the apoptotic mechanisms of irinotecan in HCC reported that SN-38 significantly increased the expression of p53 protein in the nucleus and several apoptosis-inducing proteins while significantly decreased the anti-apoptosis protein. Furthermore, increases in p53 DNA-binding activity were observed in the nuclei of HCC cell line after SN-38 treatment [41]. This experimental result strengthens the potential efficacy of irinotecan for TP53-mutant patients, and we speculated that irinotecan might achieve a better therapeutic effectiveness in high-PPS score HCCs. Current work emphasized the significance of selecting patients who could benefit from targeted therapies.
YM-155 is a small imidazolium-based agent that has specific activity against survivin [42]. In HCC cell lines with increased expression of survivin and p-survivin, YM155 significantly inhibited proliferation and induced cell cycle arrest and apoptosis, leading to DNA damage by dysregulation of cell-cycle checkpoint-related regulatory genes [42]. Moreover, in a mouse model using patient-derived HCC xenografts with elevated survivin and p-survivin expression, YM155 demonstrated significantly better efficacy than sorafenib [42]. YM-155 has presented a safe profile and anti-cancer activity in several phase I/II clinical trials of non-small cell lung cancer, esophageal cancer, prostate cancer and non-Hodgkin lymphoma [43–45]. But unfortunately, its clinical efficacy has been insofar only moderate [42]. Current work provided new insights into improving therapeutic effect of YM-155 by selecting potential YM155-responsive patients, and thus shed new light on delivering precision medicine for HCCs.
As a signature particularly designed for TP53 mutated HCCs, PPS is superior to other approaches in risk stratification and personalized treatment prediction. However, there are still limitations in the present analyses. First, the number of cohorts with both RNA-seq and WES data available was limited. Aiming to achieve more reliable results with larger sample size, we used the machine learning method to estimate TP53 mutation status in some patients. However, there might be slight discrepancy between the estimated TP53 mutation status and the actual TP53 mutation status of these patients. Second, the results of drug targets prediction and compounds prediction failed to verify each other, which might reduce the persuasiveness of our conclusions. Third, since the frequency of TP53 mutation in HCCs is 30% on average, a substantial proportion of HCC patients may not benefit from PPS model clinically (only ~20% patients could be the beneficiaries of PPS). Therefore, PPS model may not be cost-effective in clinical application. Some novel risk stratification models with satisfactory predictive performance should be developed to cover more HCC patients. Finally, all the conclusions in this study were drawn from in silico analyses, and further experimental and clinical validations are necessary for promoting the clinical application of our findings.
Conclusions
In conclusion, current work developed a novel gene signature, PPS, for prognostic prediction of TP53-mutant HCC. The PPS model has important clinical significance in both low- and high-PPS patients. For patients with low PPS scores, clinicians can adopt a low-toxicity therapy strategy to avoid ineffective over-treatment, and thus these patients can experience a better quality of life with a satisfactory prognosis. For patients with high PPS scores, our study provided them with potential therapeutic targets and agents, which might improve their prognosis in a most effective way. Overall, this study has not only provided new insights into personalized prognostication approaches, but also thrown light on integrating tailored prognosis prediction with precision therapy.
Availability of data and material
All data used in this study are publicly available. RNA-seq data of CHCC cohort are available through NODE database (https://www.biosino.org/node). RNA-seq data of LIRI cohort are available through ICGC portal (https://dcc.icgc.org/projects/LIRI-JP). RNA-seq data of LIHC are available through TCGA website (https://portal.gdc.cancer.gov/repository). The data of GSE14520 and GSE76427 are downloaded from GEO (http://www.ncbi.nlm.nih.gov/geo/), and the data of E-TABM-36 are acquired from ArrayExpress Microarray Database (https://www.ebi.ac.uk/arrayexpress/). The proteomics data of CHCC are available from the CPTAC data portal website (https://cptac-data-portal.georgetown.edu/cptacPublic/). The molecular and dependency data of CCLs are available through DepMap portal (https://depmap.org/portal/). The drug response data of CCLs are available through CTRPv2 (https://portals.broadinstitute.org/ctrp) and PRISM (https://depmap.org/portal/prism/). We have upload key step-associated R code into Github (https://github.com/samyangC/PPS-for-TP53-mutant-HCC). Other data and code are available from the corresponding author upon reasonable request.
The problem of limited sample size in TP53-mutant liver cancer was tackled using machine learning method.
This study highlights the importance of developing a specific prognostic model for TP53-mutant liver cancer.
This study demonstrated that a prognostic signature can be used not only to predict survival, but also to investigate personalized treatment strategies.
This study identified three therapeutic targets (CANT1, CBFB and PKM) and two most promising drugs (irinotecan and YM-155) for TP53-mutant liver cancer.
Declaration of Conflicts of Interest
The authors declare no conflict of interest.
Declaration of Sources of Funding
National Natural Science Foundation of China (NSFC) (81300370), China Postdoctoral Science Foundation (CPSF) (2018T110855 of Special Support Program and 2017M622650 of General Support Program) and by Natural Science Foundation of Guangdong (NSFG) (2018A030313161).
Chen Yang and Junfei Chen are PhD students at Shanghai Cancer Institute, Renji Hospital, Shanghai Jiao Tong University School of Medicine, China. They are focusing on exploring potential therapeutic strategies for hepatocellular carcinoma using bioinformatics analysis.
Xiaowen Huang is a bachelor student at Ministry of Health, Division of Gastroenterology and Hepatology, Renji Hospital, Shanghai Jiao Tong University School of Medicine, China. Her research interests include pharmacogenomics and drug repositioning.
Yan Li is a bachelor student at Department of Immunology, Zhongshan School of Medicine, Sun Yat-sen University, China. She is focusing on multi-omics analysis of hepatocellular carcinoma.
Yuanyuan Lv is a research associate at Shanghai Cancer Institute, Renji Hospital, Shanghai Jiao Tong University School of Medicine, China. She is proficient in clinical diagnosis and treatment of liver cancer.
Shixue Dai is an associated professor at Department of Gastroenterology, Guangdong Provincial People’s Hospital, Guangdong Academy of Medical Sciences, South China University of Technology, China. His research group focuses on exploring potential therapeutic strategies for multiple gastrointestinal diseases.
References
Author notes
Chen Yang, Xiaowen Huang and Yan Li contributed equally to this work.
