


Abstract
Aberrant DNA methylation is a fundamental characterization of epigenetics for carcinogenesis. Abnormality of DNA methylation-related functional elements (DMFEs) may lead to dysfunction of regulatory genes in the progression of cancers, contributing to prognosis of many cancers. There is an urgent need to construct a tool to comprehensively assess the impact of DMFEs on prognosis. Therefore, we developed SurvivalMeth (http://bio-bigdata.hrbmu.edu.cn/survivalmeth) to explore the prognosis-related DMFEs, which documented many kinds of DMFEs, including 309,465 CpG island-related elements, 104,748 transcript-related elements, 77,634 repeat elements, as well as cell-type specific 1,689,653 super enhancers (SE) and 1,304,902 CTCF binding regions for analysis. SurvivalMeth is a convenient tool which collected DNA methylation profiles of 36 cancers and allowed users to query their genes of interest in different datasets for prognosis. Furthermore, SurvivalMeth not only integrated different combinations, including single DMFE, multiple DMFEs, SEs and clinical data, to perform survival analysis on preupload data but also allowed for uploading customized DNA methylation profile of DMFEs from various diseases to analyze. SurvivalMeth provided a comprehensive resource and automated analysis for prognostic DMFEs, including DMFE methylation level, correlation analysis, clinical analysis, differential analysis, DMFE annotation, survival-related detailed result and visualization of survival analysis. In summary, we believe that SurvivalMeth will facilitate prognostic research of DMFEs in diverse cancers.
Introduction
As one of the most important epigenetic modifications, many studies have demonstrated the important role of DNA methylation in cancer. DNA methylation of functional elements presents distinct features, resulting in different regulatory mechanism [1]. The widely investigated DNA methylation-related functional elements (DMFEs) include CpG island-related elements (CIR), transcript-related elements (TR), repeat element (RE), as well as cell-type specific CTCF binding regions (CTCFBR) and super enhancers (SE). DMFE is gradually crucial in development of cancer biomarkers [2, 3]. Recent researches allowed the identification of uniquely abnormal patterns among different DMFEs in cancer and showed the distinct effects for patients’ prognosis. For example, aberrant activation of the WNT/β-catenin signaling pathway in tumors was caused by the reduced expression of tumor suppressor gene APC, whose hypermethylation in promoter region led to low expression and predicted poor prognosis of cancers [4–7]. Sandoval et al. discovered that patients with hypermethylation of HIST1H4F, PCDHGB6, NPBWR1, ALX1 and HOXA9 in promoter CGI had a shorter relapse-free survival than patients with hypomethylation for lung cancer [8]. Yang et al. found that hypermethylation in gene body region might drive overexpression of oncogenes and demethylation of gene body was a potential target for therapy [9]. Hypomethylation of REs could lead to higher mortality in colorectal cancer [10]. Abnormal DNA methylation contributed to strong cell-selective regulation of CTCF occupancy in different cancers [11]. Moreover, the regulatory mechanism of DNA methylation in enhancer region has received more and more attention [12–16]. Bell et al. discovered that enhancer regions were the most differentially methylated in tumors compared with other DMFEs, and differentially methylated regions of enhancer could provide better division of patients’ prognosis than other omics data [17]. Aran et al. found that abnormal DNA methylation in enhancers had stronger link with expression of target genes than DNA methylation in promoter regions even when the promoter was constantly unmethylated [14, 18].
On the other hand, webservers and databases for analyzing DNA methylation can provide comprehensive and effective foundation for cancer research. The user friendly tools allowed researchers without bioinformatic skills to implement their studies more conveniently, which included DiseaseMeth, Lnc2Meth, MethSurv, Xena and DNMIVD [19–24]. All these webservers and databases highlighted the interest of DNA methylation on prognosis. For Diseasemeth database, it mainly focused on aberrant DNA methylation of TR and CIR in human diseases and included differential methylation analysis, function annotation and survival analysis [19]. When users performed survival analysis based on DiseaseMeth, it would transfer to the web tool ‘PROGgene’ to accomplish corresponding survival analysis [25]. However, the PROGgene utilized expression profile of genes to perform survival analysis but not DNA methylation profile. For Lnc2Meth database, it mainly examined DNA methylation of lncRNAs in cancers and included differential methylation analysis, function annotation, probe reannotation for lncRNAs and survival analysis. The function of survival analysis estimated the prognosis of single lncRNA DMFEs (TSS1500, TSS200, 1_exon or gene body) based on single element [20]. For MethSurv webserver, it could use CIR and TR to screen single CpG site to perform survival analysis based on single element [21]. For Xena database, it mainly focused on the comprehensive exhibition, analysis and download of multiple omics data such as somatic mutation, copy number variation, gene expression, DNA methylation, protein abundance and clinical data. However, Xena could perform univariate survival analysis based on multiple omics data, but for DNAmethylation it didn’t consider of the combination of different elements and the roles of DMFEs [24]. For DNMIVD database, it mainly included differential methylation analysis, function annotation, network analysis, correlation analysis and survival analysis. The function of survival analysis respectively based on the lists of CpG sites or gene symbols to perform survival analysis based on multivariate proportional hazards regression model, which could custom the combination of genes or CpG sites but not consider of the characterization of DMFEs on prognosis adequately [22]. These tools utilized the DNA methylation data of partial DMFEs to perform survival analysis (Table 1). However, these tools suffered from several limitations that they only simply integrated different CpG sites or gene symbols without comprehensively considering the diverse contribution of various DMFEs in survival analysis and couldn’t upload users’ own data to perform survival analysis. Now the new score model of survival analysis has arisen to help to estimate the role of DMFEs for prognosis more accurately. With increasing studies in human diseases, more data about DMFEs are rapidly generated, resulting in an urgent need of online tools to comprehensively reveal the regulatory mechanism of DMFEs for diseases [26]. However, the tools focusing on comprehensively integrating multiple kinds of DMFEs to perform survival analysis have not been developed. In addition, if the tools allowed for various cancers to be uploaded and analyzed for survival analysis, they will help to advance disease research of DMFEs on prognosis.
Comparison of web tools for survival analysis
| Tool | Elements per analysis | Data source | DMFE | Input | Data type | Grouping strategy |
|---|---|---|---|---|---|---|
| DiseaseMeth | 1 | TCGA | TR/CIR | Gene symbol | Expression | - |
| Lnc2Meth | 1 | TCGA | TR | Gene symbol/transcript id | Methylation | Mean/median |
| MethSurv | 1 | TCGA | TR/CIR | Gene symbol | Methylation | Mean/median/upper and lower quantiles/maxstat |
| Xena | 1 | TCGA | TR | Gene symbol/genomic interval/CpG site | Methylation | Median/upper third, middle third, and lower third/upper and lower quartiles |
| DNMIVD | 1 or multiple | TCGA | TR | CpG site/ gene symbol | Methylation | Median/beta values of 0.3 and 0.7 as cutoff |
| SurvivalMeth | 1 or multiple | TCGA, GEO, upload data from users | TR/CIR/SE/CTCFBR/RE | CpG site/gene symbol/genomic interval/enhancer | Methylation | Mean/median/1/4 quantiles/3/4 quantiles/ maxstat/ROC 1 year/ROC 3 years/ ROC 5 years |
We therefore developed a comprehensive and user-friendly webserver for DNA methylation analysis of widespread DMFEs on prognosis (SurvivalMeth, http://bio-bigdata.hrbmu.edu.cn/survivalmeth/). We first collected annotation information of DMFEs, including gene symbol, TR, CIR, RE, CTCFBR and SE. SurvivalMeth allowed users to query and analyze the affection of CpG site, gene symbol, CIR, TR, RE, CTCFBR, SE, clinical data and even the comprehensive combination of various elements for prognosis. Users could set the customized threshold of parameters to acquire the results (Table 1). Meanwhile, SurvivalMeth provided the visualized results for survival analysis such as survival curve and many distribution figures of DNA methylation pattern commonly used in studies. Moreover, SurvivalMeth also provided differential methylation analysis between tumor and normal samples or among different stages of clinical data. In order to help query affection of the currently concerned DMFEs for prognosis simply and rapidly, SurvivalMeth has processed and analyzed data from the Cancer Genome Atlas (TCGA) and Gene Expression Omnibus (GEO) for direct query and use. Furthermore, users could also upload data of various diseases to find possible functional roles of DMFEs on prognosis. In summary, SurvivalMeth not only helped users to identify the correlation between DMFEs and prognosis based on public data, but also enabled customized data to analyze the influence of combination of DMFEs on prognosis. Therefore, SurvivalMeth can comprehensively discover the key role of DMFEs on prognosis and aid scientists without bioinformatic skills in identifying novel DMFE biomarkers in diseases.
Materials and methods
DNA methylation profiles
We obtained the DNA methylation and clinical data from TCGA and GEO. For TCGA, we downloaded HM450K and HM27K data in 33 cancer types. For GEO, we used a list of key words ‘DNA methylation’, ‘cancer’, ‘tumor’, ‘Homo sapiens’ to query the data sets, and obtained about 1700 data sets. We selected the literature with survival curves and >40 tumor samples, and checked the annotation file in GEO and relevant supplementary tables. In total, 11 data sets of 450K and 27K from GEO were obtained. Thus, we obtained 81 DNA methylation profiles of 13,371 samples across 36 cancers, covering more than 480,000 DNA methylation sites. The number of samples was shown in Supplementary Table S1. For each CpG site, β-value (range 0–1) was calculated as its methylation level based on the formula Methy/ (Methy + Unmethy), where ‘Methy’ and ‘Unmethy’ meant intensity of methylation and unmethylation, respectively.
Genomic annotation of DMFEs
The genomic localizations and annotation information for DMFEs of HM27K and HM450K were based on GPL13534, downloaded from GEO [27]. The annotation file included the relationship between CpG sites and gene symbols, CpG site locations in chromosomes, TRs and CIRs, which were annotated based on hg19. First, we extracted the CpG site, gene symbol and TR that showed one-to-one relationship between two of the three elements, respectively. Otherwise, we inputted ‘-’ for the information of DMFEs.
The CpG sites were also mapped to the region of REs. The annotation file of REs was downloaded from UCSC, including chromosome locations, RE class and RE family. The main class of REs was consisted of long interspersed nuclear element, long terminal RE, short interspersed element, DNA RE and so on.
The SE regions of epigenetic modification were used to assess the role of DNA methylation. The annotation file of SEs was downloaded from sedb [28], including their chromosome locations, overlapping genes, proximal genes, closest genes, closest genes (Active), tissues, cell line and histone modification [29]. The annotation of CTCFBR was download from UCSC and Cistrome, including their chromosome locations and cell line [30].
The relationship between cell lines and TCGA cancer types was downloaded from the Cancer Cell Line Encyclopedia [31]. The annotation information and detailed definition of DMFEs was shown in Table 2 and Supplementary Table S2.
The detailed information of each DMFE
| DMFE | Abbreviation | Detailed components | Number of components |
|---|---|---|---|
| CpG island-related element | CIR | CpG island, N_Shelf, N_Shore, S_Shelf, S_Shore | 150254, 24844, 62870, 22300, 49197 |
| Transcript-related element | TR | Promoter, whole gene, 1stExon, 3’UTR, 5’UTR, Gene Body, TSS1500, TSS200 | 17313, 19388, 5086, 11004, 5225, 17484, 16010, 13238 |
| Repeat element-related element | RE | LINE, LTR, SINE, DNA, simple repeat, low complexity, satellite, rolling circle, RNA | 20159, 17326, 23784, 7038, 3155, 4335, 1304, 37, 496 |
| CTCF binding region | CTCFBR | CTCF | 1304902 |
| Super enhancer | SE | Super enhancer | 1689653 |
Calculating the methylation level of DMFEs
The methylation level of DMFEs was determined through annotation information and CpG sites detected above. For each DMFE, the methylation level of CpG site or the average methylation level in the corresponding region was used to perform survival analysis respectively. The CpG sites in ‘TSS1500’, ‘TSS200’, ‘5’UTR’ and ‘1stExon’ were defined as the sites located in promoter region. The number of remaining CpG sites and genes in different cancers was showed in home page.
Survival analysis for DMFEs
SurvivalMeth utilized the integrated set of DMFEs filtered through the DMFE-related parameters and data-processing to perform survival analysis. First, SurvivalMeth calculated the regression coefficient through regression analysis and used the risk score system to estimate the risk of each patient. Second, patients were divided into two groups through the optimal cut-off method and the result of survival analysis was visualized by the Kaplan–Meier plot (K–M plot).
Regression analysis
Risk score system
Optimal cut-off model and log-rank test
The model assumed that an unknown cut-off point μ in X determined two patient groups regarding the response Y. The result of standardized two-sample linear rank statistic was estimated for each cut-off point μ in X. The maximum of the standardized statistics was used as a test statistic for the hypothesis of independence above. The module helped to identify an optimal cut-off point where the separation of patient groups showed the most significance of statistics [35, 36]. Besides the optimal cut-off model, we also provided other cut-offs such as median, mean, 25% quartile, 75% quartile and ROC curve. Then the result of survival analysis was visualized through the K–M plot with R package ‘survminer’. The significance of cox fitting was assessed by likelihood ratio test, Wald test and Score (log-rank) test, and the significance of K–M plot was estimated by log-rank test.
Differential analysis
Differentially methylated sites and DMFEs were filtered based on both their differential methylation level and significance of differential methylation analysis. The differential methylation level was calculated based on the formula Avecancer−Avenormal where Avecancer and Avenormal represented the average methylation level of CpG site or DMFE in tumor and normal samples, respectively. The methods of differential analysis included student’s t-test, limma and significance analysis of microarrays (SAM) algorithms [37, 38]. The P-value was adjusted based on the Benjamini & Hochberg method [39]. The customized threshold values of differential methylation levels, P-values and adjusted P-values have been provided for filtering the significant result.
Implementation of the webserver
The webserver was organized with Django (version 1.10.5) and MySQL (version 5.1.73). The interface was implemented using Hyper Text Markup Language, Cascading Style Sheets and JavaScript. The analyzed environment was constructed by the R language (version 3.6.0) and Python (version 3.6.8).
Webserver overview
SurvivalMeth helps users to investigate the effect of DMFEs on prognosis, and the flow chart was shown in Figure 1. SurvivalMeth included the commonly concerned DNA methylation data and corresponding results of survival analysis from TCGA and GEO. It also allowed users to upload disease data to perform online survival analysis. For the preupload module, after selecting a cancer and a platform, users could perform survival analysis of CpG site, gene symbol, genomic interval, SE and even combination of CpG site, gene symbol, SE and clinical data. The outcomes showed the survival-related results including tabular form of regression analysis, risk score analysis, log-rank test, the visualization of DNA methylation level, correlation, survival curve and risk score. In order to stratify the customized requirements, users could make differential analysis of DMFEs or set parameters to filter DMFEs before survival analysis. For the user-defined module, users could provide a mixture matrix of any disease to SurvivalMeth, which was consisted of survival time, survival status and DNA methylation level of any kind of DMFEs. After uploading data successfully, users could set various combinations of DMFEs to perform survival analysis, and the result also included tabular form and visualized form of survival analysis.
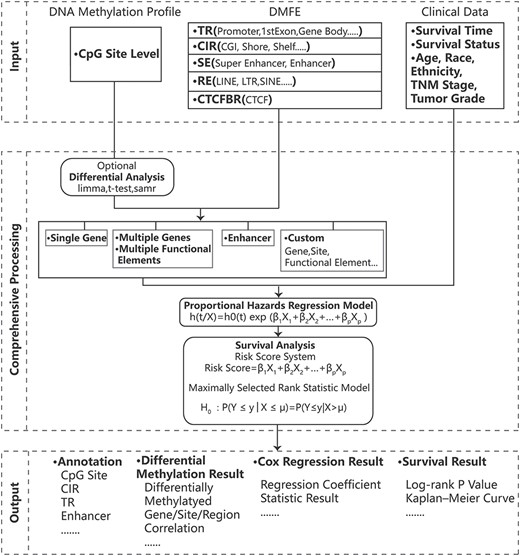
The workflow of SurvivalMeth. SurvivalMeth integrated the DNA methylation profiles, DMFEs and clinical data. SurvivalMeth utilized differential analysis, Cox proportional hazards regression model, risk score system and maximally selected rank statistic model to analyze the function of DMFEs on prognosis. The tabular and visualized outcomes were shown on the result interface, including survival status, regression analysis, K–M plot and annotation.
User interface
Integration of DMFEs based on preupload data
Based on preupload data, SurvivalMeth provided three ways to evaluate the role of DMFEs on prognosis: ‘Single Case’ and ‘Multiple Case’. Further, because of the importance and interest of enhancer for researchers, a section named ‘Enhancer Case’ was used to perform survival analysis of SEs particularly [16, 40] (Figure 2 and supplementary help document).
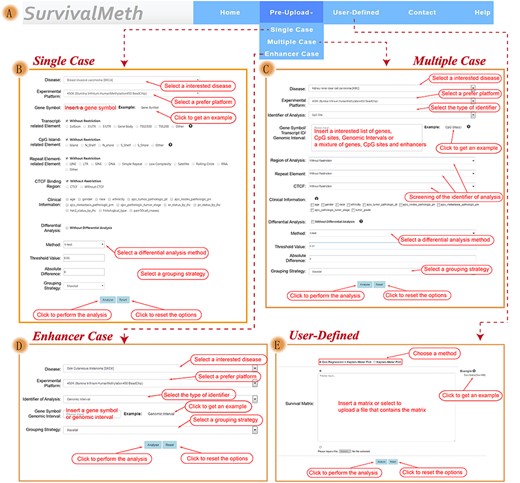
The functional interface of SurvivalMeth. (A) Navigation bar of SurvivalMeth including two main modules (‘Pre-Upload’ and ‘User-Defined’). (B) Input interface of ‘Single Case’ section. (C) Input interface of ‘Multiple Case’ section. (D) Input interface of ‘Enhancer Case’ section. (E) Input interface of ‘User-Defined’ module.
In these three sections, users could input CpG sites, gene symbols or genomic intervals. To explore the prognostic role of DMFEs located in same gene, ‘Single Case’ section allowed inputting a gene symbol to extract one or multiple CpG sites in specific DMFEs to perform survival analysis. To assess prognostic role of the customized combination of multiple gene symbols or CpG sites, ‘Multiple Case’ section allowed inputting a list of gene symbols, CpG sites, genomic intervals or a combination of CpG sites, gene symbols and enhancers to perform survival analysis. To allow users to analyze methylation sites on their interest functional elements, both ‘Single Case’ and ‘Multiple Case’ sections enabled users to set parameters of TR, CIR, RE and CTCFBR for gene symbols or CpG sites. In order to explore the prognostic role of DNA methylation in SE, ‘Enhancer Case’ section utilized a gene symbol or genomic interval to extract SE through the overlap of input and chromosome location, overlapping gene, proximal gene, closest gene or closest gene (Active) of SE, and used the CpG sites located in super enhancer regions to perform survival analysis. These three sections supported univariate and multivariate survival analysis and allowed to add clinical data for survival analysis such as age, gender race and so on. Besides, the differential analysis between tumor and normal samples could be executed to screen differential DMFEs for survival analysis, which offered three parameters including method, threshold value and absolute difference for differential analysis. The threshold value of differential analysis and absolute difference could be set by users.
Integration analysis of DMFEs based on online tools
Based on the user-defined data, users could choose to perform the Cox proportional hazards model analysis and the K–M plot or only the K–M plot. The function was implemented by R and python. A matrix format data was required. To perform the Cox proportional hazards model analysis and the K–M plot, the uploaded matrix should include DNA methylation levels of DMFEs, survival time and survival status of tumor samples. To plot the K–M plot, the uploaded matrix should include survival time, survival status and group information for each sample. The details of the required format were listed in Supplementary Tables S3, S4 and supplementary help document.
After successfully uploading matrix, SurvivalMeth returned a checkbox of uploaded DMFEs. If the uploaded DNA methylation profiles were designed based on CpG site from the platform of HM450K or HM27K, the corresponding annotation of DMFEs would be returned, otherwise they might be replaced by ‘-’. From the checkbox, users could select each one or any combination of the DMFEs to perform survival analysis.
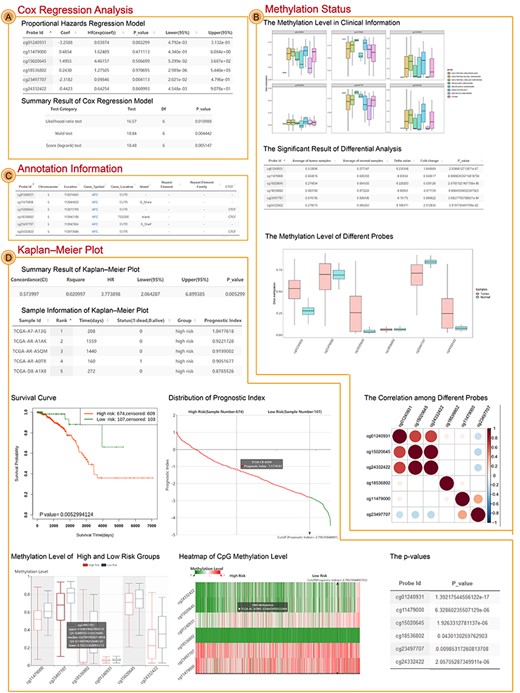
The result interface of Single Case. (A) The result of Cox regression analysis, including proportional hazards regression model and summary result of the model. (B) The result of differential analysis, including significant sites, unsignificant sites, boxplot of methylation status and correlation figure among different sites. (C) The annotation of CpG sites from HM450K. (D) The result of Kaplan–Meier plot, including summary result (log-rank test) and survival curve, visualization and table of patients’ risk score, box figure of methylation level and P-value between high- and low-risk groups and heatmap of methylation level.
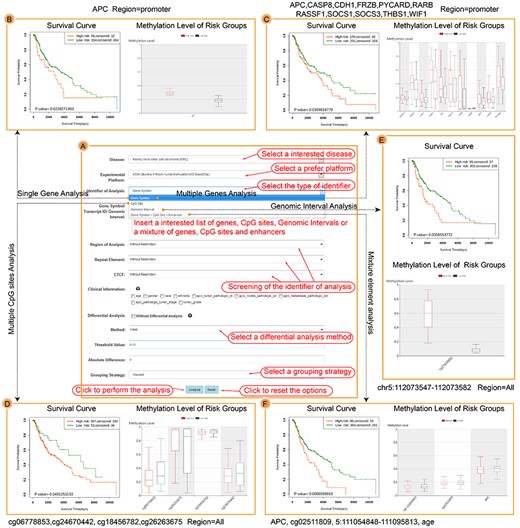
The results of Multiple Case. (A) The input interface of Multiple Case. (B) The survival result of APC promoter in SKCM. (C) The survival result of 11 melanoma biomarkers based on the multivariate Cox proportional hazards regression model. (D) The survival results of four CpG site biomarkers based on the multivariate Cox proportional hazards regression model. (E) The survival result of CpG sites near the region of transcript start site of APC based on the multivariate Cox proportional hazards regression model. (F) The survival result of a mixture list including APC promoter, CpG site, enhancer and age based on the multivariate Cox proportional hazards regression model.
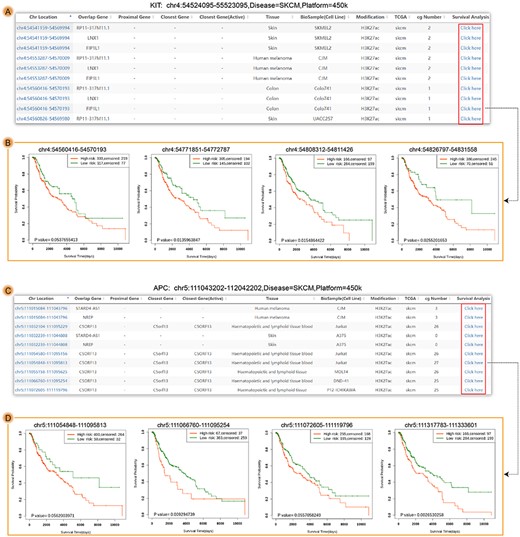
The results of Enhancer Case. (A) The searched result interface of Enhancer Case for KIT. (B) The survival results of four enhancer regions (chr4:54560416-54570193, chr4:54771851-54772787, chr4:54808312-54811426 and chr4:54826797-54831558). (C) The searched result interface of Enhancer Case for APC. (D) The survival results of four enhancer regions (chr5:111054848-111095813, chr5:111066760-111095254, chr5:111072605-111119796 and chr5:111317783-111333601). Each row of A and D included one enhancer and corresponding annotation information, and users could choose any row with CpG sites to perform survival analysis.
The result page and data visualization
The result page provided four interfaces: methylation status, Cox regression analysis, K–M plot and annotation information. For methylation status, it showed the average methylation value of tumor or normal samples, delta value, fold change and P-value of DMFEs based on the preset analytical method above. It also provided the visualization of DNA methylation in different sample groups or clinical stages and the correlation figure among different DMFEs. For Cox regression analysis and K–M plot, it provided the result of Cox proportional hazards model and log-rank test, including detailed statistic results obtained from R packages. In addition to the statistic result, it also provided K–M curve of overall survival (OS), line figure of sorted risk score and box heatmap figure of DNA methylation profile between high- and low-risk groups. When pointing to figures, it might show the risk score and DNA methylation level of each point in line and heatmap figures and showed the max value, min value, lower quartile, upper quantile and median in the box figure. SurvivalMeth also performed differential analysis between high- and low-risk groups using t-test. In addition, the visualized result provided various styles of figures with high resolution based on ‘echarts’ or ‘ggplot2’. For annotation information, it provided annotation of CpG sites extracted from HM450K annotation file. Furthermore, before showing the result of analysis, the Enhancer Case offered an extra table of SEs associated with input. The table included chromosome location, overlapping gene, proximal gene, closest gene, closest gene (Active), tissue source, cell line, histone modification, TCGA barcode and number of CpG sites located in SE. Users could use any row of the table to perform survival analysis of SEs. If the number of CpG sites was zero, SE could not be used for further analysis. The detailed introduction for result was shown in supplementary help document.
Applications
Adenomatous polyposis coli, also named as APC, was a tumor suppressor gene and acted as an antagonist of the Wnt signaling pathway. It was also involved in other processes including cell migration and adhesion, transcriptional activation and apoptosis [41]. The hypermethylation in APC promoter region has been demonstrated to result in transcriptional repression and contribute to the pathogenesis, prognosis and progression in multiple cancers [42–51]. Therefore, we inputted APC to perform the workflow of Single Case. The Single Case filtered CpG sites located in TSS1500, TSS200, 5’UTR and 1stExon to perform survival analysis based on HM450K data of breast invasive carcinoma (BRCA) (Figures 2B and3). There were 14 CpG sites located in promoter region of APC, six of which were differential and eight were not (Figure 3B). The average value of six differential CpG sites was higher in tumor samples (0.41) than in normal samples (0.34) (Figure 3B). From the survival result we found the combination of six CpG sites significantly associated with OS (Concordance Index = 0.57, HR = 3.77, CI = [2.06, 6.9], log-rank P-value = 0.005) (Figure 3D). Moreover, we also identified the prognostic role of APC in cervical cancer and lung cancer (Supplementary Figure S1).
The detailed information of DMFEs for user-defined module
| CpG site | Gene symbol | Chromosome | Location | Type |
|---|---|---|---|---|
| cg03003746 | miR-200a | 1 | 1102833 | miRNA |
| cg03593550 | miR-935 | 19 | 54485404 | miRNA |
| cg05376374 | miR-129-2 | 11 | 43602920 | miRNA |
| cg13766329 | miR-1249 | 22 | 45596980 | miRNA |
| cg19267861 | miR-124-3 | 20 | 61809724 | miRNA |
| cg21236500 | miR-4479 | 9 | 139779897 | miRNA |
| cg22358580 | miR-615 | 12 | 54426725 | miRNA |
| cg23651812 | miR-429 | 1 | 1104366 | miRNA |
| cg06722407 | LINC00421 | 13 | 19918586 | lncRNA |
| cg06892907 | KB-1732A1.1 | 8 | 103818062 | lncRNA |
| cg12918457 | LINC00900 | 11 | 115630748 | lncRNA |
| cg20892260 | RP11-175E9.1 | 8 | 23564025 | lncRNA |
| cg23651812 | RP11-465B22.8 | 1 | 1104366 | lncRNA |
| cg23883696 | RP11-676J15.1 | 18 | 70534298 | lncRNA |
| cg25081106 | MIR4500HG | 13 | 88324169 | lncRNA |
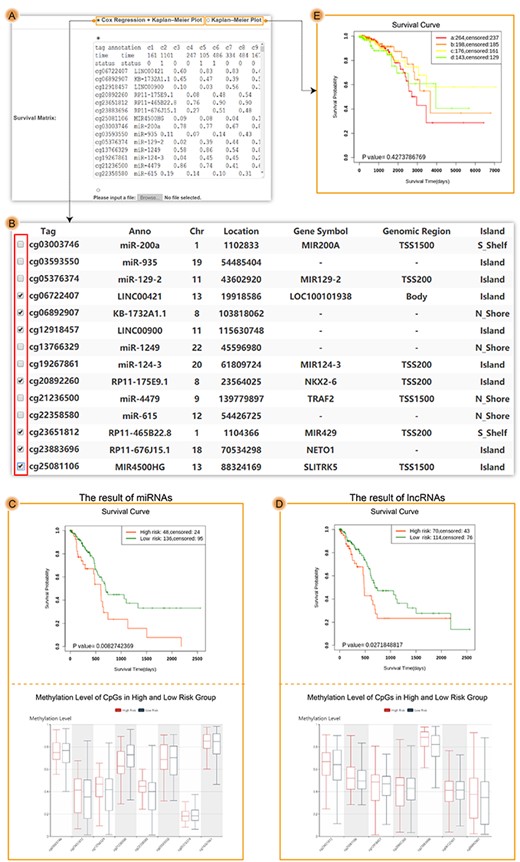
The results of user-defined module. (A) The input interface of user-defined module. (B) The uploaded result interface of user-defined module, in which each row included one DMFE and corresponding annotation information. Users could select one or more DMFEs to perform survival analysis. (C) The survival results of eight CpG sites associated with miRNA. (D) The survival results of seven CpG sites associated with lncRNA. (E) The result of K–M plot with multiple groups.
We next utilized various examples to display the function of Multiple Case in HM450K of skin cutaneous melanoma (SKCM) (Figure 4). Firstly, we used the average value of CpG sites in DMFE promoter of single APC to perform survival analysis (Figure 4A). The results showed that hypermethylation of APC promoter led to poor prognosis of SKCM (Concordance Index = 0.51, HR = 1.64, CI = [0.97, 2.77], log-rank P-value = 0.024) (Figure 4B). Secondly, we selected 11 epigenetic biomarkers of melanoma and used multivariate proportional hazards regression model to estimate the influence of DMFE promoter on prognosis: APC, CASP8, CDH1, FRZB, PYCARD, RARB, RASSF1, SOCS1, SOCS3, THBS1 and WIF1 [51–62]. The patients could be divided into two groups significantly (P-value of Likelihood ratio test = 0.019) and the gene set helped to predict the prognosis of melanoma (Concordance Index = 0.62, HR = 1.4, CI = [1, 1.94], log-rank P-value = 0.037) (Figure 4C). Thirdly, we utilized four CpG sites (cg06778853, cg24670442, cg18456782 and cg26263675) to perform survival analysis through the multivariate proportional hazards regression model [63]. The results of SurvivalMeth were consistent with previous study (P-value of Likelihood ratio test = 1.368e-11, Concordance Index = 0.7, HR = 1.64, CI = [1.08, 2.5], log-rank P-value = 0.049) (Figure 4D). Fourthly, we extracted one CpG site in chr5:112073547-112073582 which was near the start site of APC transcript. The results showed that cg02511809 was associated with prognosis of SKCM (Concordance Index = 0.52, HR = 1.84, CI = [1.18, 2.86], log-rank P-value = 0.0009) (Figure 4E). Finally, we used a mixture input including CpG sites, gene symbols, SEs and clinical data to perform survival analysis in SKCM. The SE was extracted from Enhancer case. The results showed that integration for APC promoter, CpG site cg02511809, enhancer chr5:111054848-111095813 and age also contributed to the prognosis (P-value of Likelihood ratio test = 6.822e-07, Concordance Index = 0.64, HR = 1.68, CI = [1.05, 2.68], log-rank P-value = 0.009) (Figure 4F).
We also used the workflow of Enhancer Case to evaluate the relationship between prognosis and enhancer methylation located in the upstream of genes from 1 kb to 1 mb (Figures 2D and5). First, we searched the enhancer region of gene KIT whose enhancer methylation was associated with prognosis in melanoma [17]. Seventy-three enhancer regions have been found, in which 23 were associated with prognosis (Figure 5A). Second, we also assessed the enhancer region of gene APC. Fourty-seven enhancer regions have been collected, in which 13 were associated with prognosis (Figure 5C). Four examples of KIT and APC were shown in Figure 5B and D, respectively. These examples suggested that DNA methylation in enhancer region might contribute to the prognosis of patients.
For user-defined module, we used example data to perform survival analysis. The row elements of example data were consisted of DNA methylation value of different DMFEs such as CpG sites associated with miRNAs or lncRNAs, which have been demonstrated to predict the prognosis in pancreatic adenocarcinoma (Table 3) (Figure 6) [64]. After uploading the data, the result interface displayed detailed annotation information of row elements (Figure 6B). Next, two lists of eight CpG sites of miRNAs and seven CpG sites of lncRNAs were selected to perform survival analysis, respectively. The results of miRNAs (Concordance Index = 0.74, HR = 1.94, CI = [1.09, 3.45], log-rank P-value = 0.008) and lncRNAs (Concordance Index = 0.75, HR = 1.72, CI = [1.01, 2.94], log-rank P-value = 0.027) could predict prognosis and were consistent with previous study (Figure 6C and D). The examples showed that users could choose different elements based on their requirement. Users could also upload clinical information and group information to make K–M plot with no less than two groups (Figure 6E).
Discussion
The importance of DNA methylation in diagnosis and prognosis, coupled with DMFEs, leads to an urgent need for comprehensively integrating various DMFEs methylation on prognosis [58, 65–67]. SurvivalMeth allowed for survival analysis based on not only multiple DMFEs of one interested gene but also the combination of various DMFEs from multiple genes. SurvivalMeth also aimed at the relationship between enhancer DNA methylation and prognosis, which was not covered by previous databases and webservers. Moreover, SurvivalMeth could integrate DMFEs and clinical data to explore the role on prognosis. For preupload data from TCGA and GEO, users only need to input the lists of genes or DMFEs and follow the guidance to perform customized prognostic analysis. The simple and synthetic input, comprehensive DMFEs, abundant parameters and convenient operation help biologists and clinicians validate their results and new biomarkers for cancers. Furthermore, SurvivalMeth supports biologists and clinicians to upload their own mixture matrix of any disease for analysis. Users only need to prepare conventional format of DNA methylation profile for survival analysis. This function complements the shortcomings of only using the preupload data offered by developers of webservers and allows a more customized combination of different DMFEs based on the requirement of users.
Existing methylation-related databases and webservers mainly focused on seldom DMFEs and provided partial results of survival analysis. SurvivalMeth utilized the abundant DMFEs, parameters and customized combination of DMFEs to satisfy the requirement of rapid research progress, and also filled a void of uploading personalized data profiles of various diseases to analyze the impact of DNA methylation in cancers. SurvivalMeth not only provided compressive tabular results such as differential analysis, cox regression, log-rank test, clinical information and annotation, but also provided various visualized results such as methylation status of tumor, normal or clinical data, correlation figure among different DMFEs, survival curve, heatmap and many kinds of figures associated survival analysis (Supplementary Table S5). To demonstrate the reliability of SurvivalMeth, we decided to assess the result of the CpG site cg02511809 in Figure 4E through other tools which gave the similar output to SurvivalMeth, including Xena, MethSurv and DNMIVD (Supplementary Figure S2). The CpG site was significantly associated with prognosis in SurvivalMeth and MethSurv. High methylation level could lead to a poor prognosis, but Xena and DNMIVD were not. Because the grouping strategies of Xena and DNMIVD were the median method, but SurvivalMeth and MethSurv had various kinds of grouping strategies to explore the optimal cutoff.
Although SurvivalMeth is a useful tool, there is room for improvement. SurvivalMeth now provides a platform for comprehensive analysis of DMFEs. In the future, we will integrate more data into the webserver and update it as a comprehensive resource tool of DNA methylation. With the progress of DMFEs and DNA methylation data, more DMFEs and DNA methylation data such as HM850K, whole genome bisulfite sequencing, reduced representation bisulfite sequencing and even the prospective data will be added to explore the function of DNA methylation. The increase and abundance of DNA methylation data from different platforms will validate the role of DMFEs on prognosis comprehensively. In addition, multiple omics data such as mutation, gene expression, copy number and clinical data will help understanding the mechanism of DMFEs more comprehensively. Therefore, the multiple omics data will be integrated for further analysis.
In summary, SurvivalMeth will help to discover new insights into regulatory mechanisms and applications of DMFEs in cancer prognosis and provide novel ideas and assisting for scientists.
SurvivalMeth provided comprehensive survival analysis based on clinical data and DNA methylation of DMFEs.
SurvivalMeth provided various DMFEs and abundant filtering parameters to estimate the role of DMFEs on prognosis based on the currently concerned DNA methylation data from TCGA.
SurvivalMeth provided tabular and visualized results to display the relationship between DMFEs and prognosis.
SurvivalMeth allowed users to upload data and set more customized combination of DMFEs to further explore the function of joint DMFEs on prognosis.
Acknowledgments
We thank the friends who help us solve the problems when constructing SurvivalMeth.
Funding
National Key R&D Program of China [grant number 2018YFC2000100]; the National Natural Science Foundation of China [grant numbers 61873075, 31871338, 31970646]; Natural Science Foundation for Distinguished Young Scholars of Heilongjiang Province [grant number JQ2019C004]; Heilongjiang Touyan Innovation Team Program; Research fund of Harbin Medical University Daqing Campus [grant number DQXN201609] and Innovative Scientific Research Funded Project of Harbin Medical University [grant number 2017JCZX06].
Chunlong Zhang is a PhD student in the College of Bioinformatics Science and Technology at Harbin Medical University.
Ning Zhao is a PhD student in the School of Life Sciences and Technology at Harbin Institute of Technology.
Xue Zhang is a MS student in the College of Bioinformatics Science and Technology at Harbin Medical University.
Jun Xiao is a MS student in the College of Bioinformatics Science and Technology at Harbin Medical University.
Junyi Li is a MS student in the College of Bioinformatics Science and Technology at Harbin Medical University.
Dezhong Lv is a MS student in the College of Bioinformatics Science and Technology at Harbin Medical University.
Weiwei Zhou is an undergraduate in the College of Bioinformatics Science and Technology at Harbin Medical University.
Yongsheng Li is an associate professor in the College of Bioinformatics Science and Technology at Harbin Medical University. Key Laboratory of Tropical Translational Medicine of Ministry of Education, Hainan Medical University, Haikou, China.
Juan Xu is a professor in the College of Bioinformatics Science and Technology at Harbin Medical University. Key Laboratory of Tropical Translational Medicine of Ministry of Education, Hainan Medical University, Haikou, China.
Xia Li is a professor and head of the Chair in the College of Bioinformatics Science and Technology at Harbin Medical University. Key Laboratory of Tropical Translational Medicine of Ministry of Education, Hainan Medical University, Haikou, China.
References
Author notes
Chunlong Zhang, Ning Zhao and Xue Zhang contributed equally to this work.
