


Abstract
Identifying microRNAs that are associated with different diseases as biomarkers is a problem of great medical significance. Existing computational methods for uncovering such microRNA-diseases associations (MDAs) are mostly developed under the assumption that similar microRNAs tend to associate with similar diseases. Since such an assumption is not always valid, these methods may not always be applicable to all kinds of MDAs. Considering that the relationship between long noncoding RNA (lncRNA) and different diseases and the co-regulation relationships between the biological functions of lncRNA and microRNA have been established, we propose here a multiview multitask method to make use of the known lncRNA–microRNA interaction to predict MDAs on a large scale. The investigation is performed in the absence of complete information of microRNAs and any similarity measurement for it and to the best knowledge, the work represents the first ever attempt to discover MDAs based on lncRNA–microRNA interactions.
In this paper, we propose to develop a deep learning model called MVMTMDA that can create a multiview representation of microRNAs. The model is trained based on an end-to-end multitasking approach to machine learning so that, based on it, missing data in the side information can be determined automatically. Experimental results show that the proposed model yields an average area under ROC curve of 0.8410+/−0.018, 0.8512+/−0.012 and 0.8521+/−0.008 when k is set to 2, 5 and 10, respectively. In addition, we also propose here a statistical approach to predicting lncRNA-disease associations based on these associations and the MDA discovered using MVMTMDA.
Python code and the datasets used in our studies are made available at https://github.com/yahuang1991polyu/MVMTMDA/.
Introduction
MicroRNAs and long noncoding RNAs (lncRNAs) have been found involved in transcriptional and post-transcriptional processes, forming a gene expression program that all eukaryotic cells rely on [1]. MicroRNAs are ~22 nt ncRNAs and they generally bind to the three prime untranslated region (3'UTR) of the mRNA imperfectly. In most cases, this can lead to translational inhibition or degradation of its target mRNA. Although much effort has focused on the functions and biogenies of microRNAs, lncRNAs are gaining prominence as they take up the largest portion of mammalian noncoding transcriptome. It has recently been found to serve the role of critical epigenetic regulators of gene expression [2]. Most diseases are frequently associated with alteration of the transcriptome, and such an altered transcription pattern has recently been found to not just be restricted to the protein-coding RNAs aberrantly expressed but also to dysregulation of the expression of microRNAs and lncRNAs. As a result, much effort is currently being made to characterize those lncRNAs and microRNAs that interfere with gene expression and signaling pathways at various stages of disease development.
Recently, there has been an increasing body of experimental evidence that shows that through a sophisticated and multilayered mode of regulation noncoding RNA, including lncRNA and microRNA, can influence every aspect of normal tissue physiology [1]. Recently, the competitive endogenous RNA (ceRNA) hypothesis [3] has gained substantial attention as it unifies all the hypotheses about the general mechanism of the intricate interplay among diverse RNA species. Specifically, it proposes that lncRNAs that share specific microRNA response elements (MREs) communicate with and co-regulate each other by competing for binding to the shared microRNAs. Considering that both lncRNA and microRNA are key regulators that control cellular processes, and that they interact with each other to fine-tune gene expression, knowledge of the mechanisms by which they cooperate is the first step toward understanding the functions that they exert in disease processes. Unfortunately, in spite of its importance, little is known about the co-regulation between lncRNA and miRNA in disease processes.
However, with the advent of high-throughput sequencing techniques, more and more lncRNAs and microRNAs have been identified to be involved in the development of diverse diseases, which include cancers, acting as oncogenes or as tumor suppressors [4]. Both lncRNA and microRNAs are now routinely used as biomarkers in disease diagnosis and treatment. Much progress has also been made toward their use as molecular targets for new drugs. This promising trend depends largely on our understanding of the associations between lncRNA or microRNA and a diversity of different diseases.
Recently, with the advances in analytical methods including circulation, genetic, epigenetic, miRNA-target and tissue-expression assays, several databases, such as HMDD and miR2Disease, have been established to allow data related to the relationship between lncRNA/microRNA and different diseases to be publicly accessible. Unfortunately, as the assays are time consuming and tedious, the data that have been collected so far are still relatively limited in number, focusing only on a few key noncoding RNAs rather than their contextual regulation network. In addition, it can be difficult to integrate the data in the databases together to form a complete regulation network due to their sparsity in number and their being from different bioassay-based research.
In recent years, there has been increasing research interest to exploit lncRNA–miRNA interaction (LMI) in studies related to various complex human diseases [5] such as colorectal cancer [6, 7], cervical squamous cell carcinoma (CESC) [8] and heart failure [9], etc. Rather than investigating into the signaling pathways of a few types of noncoding RNAs, these studies consider transcriptome-wide regulation that involves both microRNAs and lncRNAs cooperating together. However, it should be noted that, as information about lncRNA–microRNA regulation network is not available from existing databases, current research in this area is mainly based on sequence-based microRNA target-prediction algorithms, such as miRWalk, Cytoscape and TAM [10–12]. These algorithms are used to construct a predicted LMI network so that they can be used to predict pathogenic lncRNA–microRNA co-regulations. However, as pointed out by some studies, most existing microRNA target-prediction algorithms predict too many false positives and the LMI networks constructed based on the results that these algorithms predict would therefore be unreliable [13]. Although ground-truth data of LMI may help us understand the important regulation functions of ncRNA thereby deciphering the complex ncRNA regulation network in the pathology of diseases, finding out the relationship between LMIs and the diseases that they are associated with is difficult.
As it is slow and tedious to perform laboratory experiments, relying on computational approaches can allow potential candidates for experimental confirmation to be quickly identified by better integrating prior information from different relevant studies much faster and with much lower costs. Toward this goal, a number of computational tools have been developed for computer-aided ncRNA biomarker discovery. As reviewed in [14, 15], most existing methods in this domain rely on the basic assumption that microRNAs that are similar tend to be involved in diseases that have similar pathological characteristics. While this assumption seems to be very reasonable, it should be noted that how microRNA similarity should be defined is a complex and open problem. Apart from known microRNA-disease association that can be used for training prediction model, there are different kinds of supplementary information relevant to microRNA and disease. This kind of knowledge is often called side information, which can be introduced into model to boost prediction performance. Different metrices for microRNA similarity have been proposed using different side information and statistical metrices such as Pearson correlation coefficients, cosine similarity and Euclidean distance [15]. However, as the features in the feature vectors of the side information may not be linearly dependent, these metrices may not be able to capture the complex relationship between two lncRNAs/microRNAs. In addition to this problem, the data of side information, such as the LMIs, are quite limited in amount and are incomplete. Due to the missing data, microRNA similarity cannot be determined accurately and for this reason,microRNA-diseases associations (MDAs) cannot be predicted accurately. Hence, in order to improve prediction accuracy, there is a need to learn an effective feature representation for microRNA and lncRNA.
There has recently been an increasing number of computational tools proposed to predict MDA. Many of these tools do not take into consideration the incompleteness of information about what raw features of microRNAs can best be used for prediction. Also, these tools determine functional similarity for microRNAs based on data sources that are not reliable [14, 15]. For example, the functional similarity score matrix (http://www.cuilab.cn/files/images/cuilab/misim.zip) released by Wang et al. [16] was obtained using a computational model developed with a data set, which has not been continually updated, and as such, prediction of the association relationships are not reliable. One other limitation with existing tools is related to the statistical methods that they use to compute the microRNA similarity scores. As explained above, they are too simple to capture the complex correlation relationship among microRNAs. For example, the use of Gaussian kernel measure or linear Euclidean distance, which are widely used, do not capture dependence of features in microRNA feature vectors [14]. In this work, we compared four state-of-the-art existing methods with the proposed MVMTMDA model. All of them are based on similarity measurement and use different techniques with various advantages. Specifically, IMCMDA and MDHGI model use two matrix completion techniques to consider a space mapping from the similarity space to the space of input network [17, 18]; the method proposed in Zeng et al.’s [19] work adopts a structural perturbation method, considering the structural consistency property of the input network; MDA similarity kernel fusion (SKF) model uses a similarity fusion method to consider the correlation between different similarities when performing link prediction [20]. In summary, the choice of data sources and the way side information is integrated do not provide current computation methods the best tools to predicting MDAs most accurately. To develop better methods for this purpose, we take the co-regulation between lncRNA and microRNA into account when predicting new microRNA biomarkers. Based on the assumption that the patterns of lncRNA–microRNA co-regulation can be implied from the network of LMI identified by large-scale CLIP-seq experiments, we developed a computational model to predict MDAs on a transcriptome-wide scale by introducing known LMIs. There has also been a method called DCSMDA [21] proposed to use LMI for predicting MDAs. It is based on similarity matrix construction and unsupervised learning. Different from DCSMDA, the proposed model can consider the data missing problem in LMI network. In addition, it is a supervised approach that is able to consider known MDAs for prediction.
To evaluate the performance of the proposed model, we implement 2-fold, 5-fold and 10-fold cross-validation to predict associations between microRNA and disease using the ground true data from HMDD v3.0 and lncRNASNP v2.0. A number of additional experiments are also implemented for the performance comparison of the proposed method with state-of-the-art methods for MDA prediction. We use multiple criteria to evaluate the prediction performance including the area under ROC curve (AUC), hit ratio (HR) and normalized discounted cumulative gain (NDCG) [22]. As a result, MVMTMDA yielded the best performance with average AUC of 0.8512+/−0.012, HR of 0.7553 and NDCG of 0.4895 in 5-fold cross-validation. The experimental results demonstrate the effectiveness of MVMTMDA for predicting large-scale associations between miRNA and disease by introducing the LMI network. We publicly release our predicted results including predicted LMI, MDA, lncRNA-disease associations and the graph embeddings for microRNA, which are expected to be useful for future research in noncoding RNA domain.
Materials
The data we used in this work include experimentally validated lncRNA–microRNA interactions and MDAs. There are several public databases providing such two types of data resource. In order to obtain the up-to-date data resource, we collect the datasets from lncRNASNP v2.0 [23] and HMDD v3.0 [4], both of which have been recently updated within a year.
lncRNASNPv2.0 database (http://bioinfo.life.hust.edu.cn/lncRNASNP) integrates the data from starBase v3.0 [24] database (http://starbase.sysu.edu.cn/) providing comprehensive knowledge on lncRNAs. It records 45 329 LMIs between 3521 types of lncRNA and 276 types of microRNAs. HMDD v3.0 database (http://www.cuilab.cn/hmdd) provides 18 732 MDAs between 874 types of diseases and 1207 types of microRNAs.
We discard the redundant data and manually match the ids of microRNA in lncRNASNP v2.0 database and those in HMDD v3.0 database. As a result, the LMI dataset we collected has 10 465 LMIs between 541 lncRNAs and 268 microRNAs. Based on the 268 types of microRNAs whose ids are successfully matched to HMDD database, we collect 11 253 MDAs covering 799 types of diseases.
Methods
Problem statement
In this work, we propose MVMTMDA to predict MDAs considering the co-regulation of lncRNA and microRNA. As mentioned in the Introduction section, one challenge in our work is to solve the problem of incompleteness and sparsity of LMI networks. To this end, we introduce what we call multitask learning when we design our model. Based on multitask learning, LMIs and MDA are simultaneously predicted. Considering that both known networks of LMI and MDA are far less than complete and that the information contained in these networks are complementary to each other, we believe, therefore, that prediction of new links in one network can be made based on the other ones. These predictions are also mutually beneficial. An accurate link prediction in the LMI network, for example, can provide useful information for MDA predictions to be made more accurately and vice versa.
Another challenge of our prediction task lies in the development of a similarity measure between lncRNA/microRNA in an lncRNA–microRNA-disease network. Due to complexity of their synergistic effects, such a measure would be highly complex as well. To tackle the problem, we propose to learn embedding features for lncRNA and microRNA from the LMI and MDA networks and this can be defined as a multiview learning problem. We consider the functional roles of a given microRNA to have two heterogenous representations on LMI and MDA networks, respectively, with each network having a different view. The key to tackling the multiview learning problem is to effectively exploit the diversity and consistency of multiview data of the networks of LMI and MDA, which consequently identifies the feature dimensions in which the characteristics of the original data could be retained.
In this paper, we present a deep neural network to exploit association/interaction relationship of microRNAs to diseases and lncRNAs using a graph embedding technique. Given a kind of microRNA, m, with a set of its known associated diseases, D, the proposed method can predict new diseases associated with m, learn feature representation for m’s function, and predict lncRNAs that are associated with D. The learned features synthesize the information in the networks of LMI and MDA and thus are anticipated to comprehensively describe functional role and correlations of lncRNA and microRNAs.
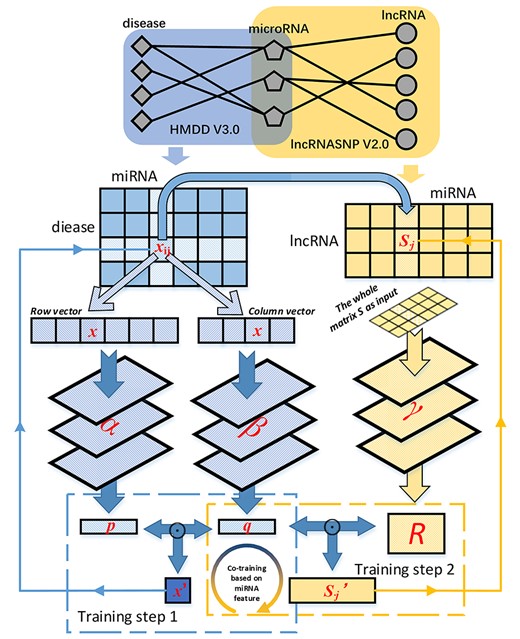
Schematic diagram of multiview multitask learning for microRNA-disease association prediction. There are three neural networks included in the MVMTMDA model (marked as α, β and γ), aiming to learn the embeddings for disease, microRNA and lncRNAs, respectively. The process for training the model contains two steps, which alternatively proceed. p and R are optimized in step 1 and 2, respectively, and q keeps being optimized in both steps.
Multiview multitask learning for predicting microRNA-disease associations
The proposed model, MVMTLMDA, is designed with a deep structure composed of three neural networks. Different from conventional prediction models for MDA that separate similarity measurement and value prediction, it provides end-to-end solution to handle graph-based raw data to yield the final results without any statistical assumption. Specifically, it learns the hidden features for diseases, microRNAs and lncRNAs via multiview learning and yields the prediction via multitask learning (Figure 1).
To the best of our knowledge, this work is the first attempt to consider the topological information of lncRNA–microRNA interaction network to predict MDAs. Apart from the prediction improvement from previous models, the contribution of our work lies in some outstanding characters of our method that can be outlined as follows: (i) MVMTMDA is able to integrate data from different types of relevant biological network for prediction even if the data is incomplete; (ii) it realizes end-to-end training for feature representation from multiple biological networks; and (iii) it provides a solution to combine the issues of MDA prediction and lncRNA-disease association prediction.
Multiple graph embeddings via multiview learning
It should be noted that, because of the operation of dot product in Equations 11 and 12, the weight matrixes in the last layers of neural networks should have the same column dimension, assuring that the dimensions of pi and qj and the column dimension of R are the same. The embedding feature of microRNA qj connects the results of neural networks β and γ, and therefore it remains and combines the information of their inputs (i.e. known MDAs and LMIs). As qj is used to yield the scores for each pair of MDA and LMI, it can effectively represent the biological role of a given microRNA on both networks while training the model by recovering X and S. We consider X and S are strongly related data that provide two different view for the function of microRNAs and the embedding features yielded from the proposed are basically based on multiview learning.
Model training via multitask learning
Prediction of lncRNA-disease association with MDA and LMI
In the datasets that we collected, each type of lncRNA and disease has relation to at least one microRNA, such that the P-value for each lncRNA-disease pair can be calculated using Equation 16. By setting P-value < 0.05, we consequently identify 15 945 lncRNA-disease associations from a total of 432 259 lncRNA-disease pairs. To further control the false positive rate (FPR) of our prediction, we, in addition, conduct false discovery rate (FDR) correction on the computed P-values. The lncRNA-disease pairs with FDR < 0.05 are considered to have strong positive or negative correlation. As a result, we identify 25 076 potential lncRNA-disease association. The predicted lists are available in Supplementary Table S1.
Functional clustering of microRNAs based on multiview embedding features
In recent years, the similarity measurement for function of microRNAs has been attracting increasing attention due to its significance in the domain of noncoding RNA research [26, 27]. In this section, we propose a new type of functional similarity measure for microRNAs based on MDA and LMI.
As the connection joint of the networks of MDA and LMI, in this work, microRNA is considered to have two views to represent its biological functions. Motivated by this, the proposed MVMTMDA learns graph embedding features for each type of microRNA, comprehensively considering their relationship with diseases and target lncRNAs. The microRNA features learned from the proposed model can thus imply the functional similarity among microRNAs. In this section, we implement K-means clustering in the feature space of the microRNA graph embedding learned by the MVMTMDA model.
Specifically, we first use all data in MDA dataset as training set to train the two-layer model of MVMTMDA until results converged. Secondly, in order to visualize the cluttering results in 3 × 3 subfigures, we reduced the dimension of embedding features to 3. Specifically, we applied principal component analysis (PCA) on microRNA features. Based on the first three dimensions in PCA, the clustering algorithm of k-means was implemented. We set the number of clusters as 6 and the corresponding scatter diagram is shown in Figure 2. In addition, we calculate the Pearson correlation coefficient (PCC) of microRNA features as the function similarity score.
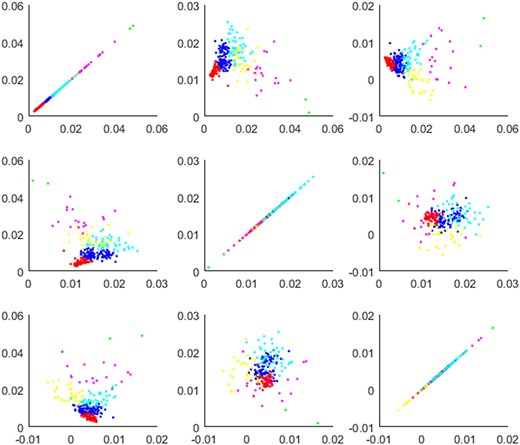
Scatter diagram of functional clustering for 268 types of microRNAs. Six different colors represent the distribution of six clusters, based on three dimensions of microRNA nodes. The subfigure in i-th row and j-th column present the nodes distribution based on the i-th and j-th dimension.
We publicly release the embedding features of microRNAs along with the clustering results and the microRNA functional similarity (available in Supplementary Table S2). The prediction scores for each microRNA-disease pair are also available in Supplementary Table S3. It is anticipated that the microRNA-disease pair with high predicted scores will be confirmed by biological experiment in the future.
Results
Performance evaluation for MVMTMDA
To evaluate the prediction performance of the proposed model, we used a real dataset involving experimentally confirmed MDA and LMI and tested accuracy using 2-fold, 5-fold and 10-fold cross-validation. Specifically, in k-fold (k = 2, 5 and 10) cross-validation, we randomly separate the samples of MDA into k roughly equal parts. k-1 of them are in turn used as training samples and the rest one is for testing. To quantify the performance in k-fold cross-validation, we adopt three kinds of criteria, i.e. AUC, HR and NDCG.
In each fold of prediction, we calculate the ranks of testing samples among the unlabeled samples. Those testing samples obtaining a rank higher than the given threshold are considered as positive. Setting different thresholds, we computed the corresponding true positive rates (TPRs, sensitivity) and FPRs (1-specificity) where sensitivity and specificity are the percentages of testing samples predicted as positive and negative, respectively. Corresponding receiver operating characteristic (ROC) curves are computed by plotting TPR versus FPR and AUC is computed. AUC = 0.5 implies a purely random guess and AUC =1 indicates perfect prediction. In addition, we adopt the metrics of HR and NDCG. We used the testing samples and 50× its number of random unlabeled samples to construct the Ground-truth item set (GT) and truncated the ranked list at 10 for both metrics. As such, the HR intuitively measures the percentage of testing samples in the top-10 list, while the NDCG measures the ranking quality, which assigns higher scores to hits at top position ranks. For both metrics, larger values indicate better performance.
To avoid any bias caused by the random sample partitioning in cross-validation, we repeat the random sampling along with prediction for 20×. The performance results of average AUC, best HR and best NDCG yielded by MVMTMDA are listed in Table 1. As larger size of training set would lead to a more accurate prediction, it shows that the prediction accuracy yielded by the proposed model yields increases with the increased number of folds in k-fold cross-validation. The corresponding ROC curves shown in Figure 3a–c show the HR and NDCG yielded by the proposed model increase rapidly within the first 10 epochs and tend to stabilize after the 20th training epoch.
Prediction performance w.r.t. AUC, HG and NDCG using MVMTMDA in k-fold cross-validation
| CV method | 2-fold CV | 5-fold CV | 10-fold CV |
|---|---|---|---|
| Average AUC | 0.8410+/−0.018 | 0.8512+/−0.012 | 0.8521+/−0.008 |
| Best HR | 0.7196 | 0.7553 | 0.7603 |
| Best NDCG | 0.4429 | 0.4895 | 0.5030 |
| CV method | 2-fold CV | 5-fold CV | 10-fold CV |
|---|---|---|---|
| Average AUC | 0.8410+/−0.018 | 0.8512+/−0.012 | 0.8521+/−0.008 |
| Best HR | 0.7196 | 0.7553 | 0.7603 |
| Best NDCG | 0.4429 | 0.4895 | 0.5030 |
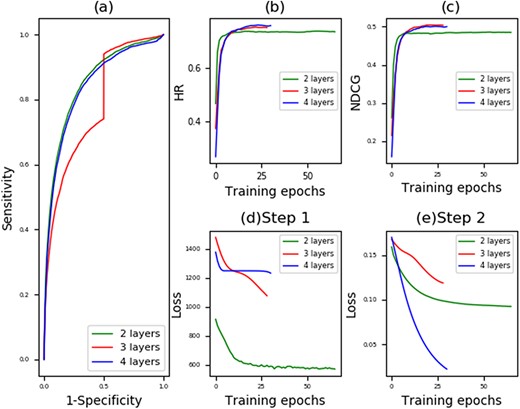
Prediction performance of MVMTMDA: (a) ROC curves yielded by MVMTMDA with two, three and four layers; (b) Hit ratio yielded by MVMTMDA with increasing training epochs; (c) NDCG yielded by MVMTMDA with increasing training epochs; (d) the training loss in Equation 14 for the step 1 with increasing training epochs; (e) the training loss in Equation 15 for the step 2 with increasing training epochs.
Performance evaluation on LMI prediction using MVMTMDA
As mentioned, we consider that the prediction of MDA and that of LMI are mutually beneficial. Given a type of microRNA, its involvement in different diseases offers useful information for predicting its target lncRNA. In this section, we try to use the MDA to predict LMI using MVMTMDA, whose prediction performance is concerned. Specifically, we exchange the matrixes of X and S, with X as the LMI matrix and S as the MDA matrix. We set the model parameters the same as the setting in the above experiment. As a result, predicting LMIs with two hidden layers, MVMTMDA yielded average AUC of 0.8747+/−0.018, 0.9014+/−0.012 and 0.9037+/−0.011 in 2-fold, 5-fold and 10-fold cross-validation (Figure 4 and Table 2). The reliable results demonstrate the usefulness of MDA for LMI prediction, and the effectiveness of the proposed model to integrate different types of biological networks for prediction.
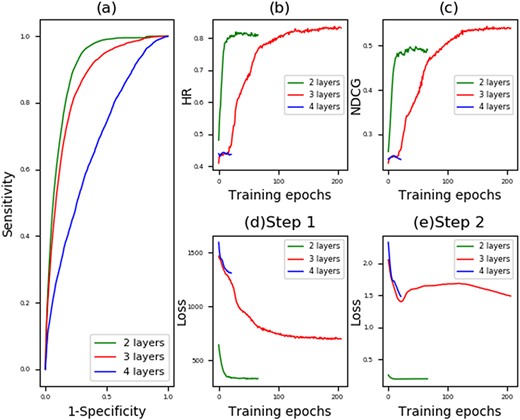
Performance yielded MVMTMDA in LMI prediction: (a) ROC curves yielded by MVMTMDA with two, three and four layers; (b) Hit ratio yielded by MVMTMDA with increasing training epochs; (c) NDCG yielded by MVMTMDA with increasing training epochs; (d) the training loss in Equation 14 for the step 1 with increasing training epochs; (e) the training loss in Equation 15 for the step 2 with increasing training epochs.
Prediction performance on LMI dataset using MVMTMDA in k-fold cross-validation
| CV method | 2-fold CV | 5-fold CV | 10-fold CV |
|---|---|---|---|
| Average AUC | 0.8747+/−0.018 | 0.9014+/−0.012 | 0.9037+/−0.011 |
| HR | 0.7310 | 0.8506 | 0.9045 |
| HDCG | 0.4119 | 0.5542 | 0.6504 |
| CV method | 2-fold CV | 5-fold CV | 10-fold CV |
|---|---|---|---|
| Average AUC | 0.8747+/−0.018 | 0.9014+/−0.012 | 0.9037+/−0.011 |
| HR | 0.7310 | 0.8506 | 0.9045 |
| HDCG | 0.4119 | 0.5542 | 0.6504 |
Performance comparison
In this subsection, we compare the proposed MVMTMDA with other methods that were previously proposed for predicting MDA and LMI. There are an increasing number of computational tools proposed for predicting potential microRNAs involved in different diseases. We here select four methods for performance comparison, all of which are recently published in 2018.
In these works, there are two kinds of data used to compute the microRNA similarity. One is the microRNA functional similarity yielded by MISIM [16], which hasn’t been updated for several years. In addition, Wang’s microRNA similarity was calculated based on an MDA dataset collected in 2010 such that it is inappropriate for MDA prediction. The other one is microRNA sequence similarity. However, the relation between microRNA functional similarity on pathology and microRNA sequence similarity is still unknown. To the best of our knowledge, the proposed MVMTMDA is the first one to consider the network structure of LMI to predict MDA. For the sake of fairness, we also introduced LMI into the compared prediction models.
Apart from the prediction tools for RNA target that are based on sequence matching, existing network-based prediction models for LMI is limited. For the performance comparison about LMI prediction, we compare MVMTMDA with the model of EPLMI [28] and three other baseline methods (i.e. Katz measure [29], basic LFM [30] and neighbor-based collaborative filtering [31]).
Performance comparison on the prediction of MDA and LMI in 5-fold cross-validation
| Prediction task | Method | Average AUC |
|---|---|---|
| Prediction of microRNA-disease associations | IMCMDA [17] | 0.6233+/−0.032 |
| MDHGI [18] | 0.6932+/−0.027 | |
| Zeng et al.’s work [19] | 0.7883+/−0.012 | |
| MDA-SKF [20] | 0.8192+/−0.010 | |
| The proposed method | 0.8512+/−0.012 | |
| Prediction of lncRNA–microRNA interactions | Neighbor-based CF [21] | 0.7301+/−0.026 |
| LFM CF [22] | 0.7692+/−0.025 | |
| EPLMI [23] | 0.8126+/−0.012 | |
| Katz [24] | 0.8737+/−0.008 | |
| The proposed method | 0.9014+/−0.012 |
The reasons for the superior performance of the proposed model may lie in two aspects. One is that MVMTMDA adopts deep neural network structure, which can automatically learn the complex relation between microRNA from MDA and LMI network in an end-to-end manner. The other one is that the proposed model considers the incompleteness of the side information and adopts multitask learning to fill the missing values of it.
Impact of side information on MVMTMDA
As mentioned in sections 4.1 and 4.2, MVMTMDA predicts MDAs using the network of LMI as side information and can also predict LMIs with MDA network as side information. In this subsection, we evaluate the usefulness of the introduction of the side information. Specifically, for performance comparison, the second step of optimization (Equation 15) is discarded, such that the data of side information would be ignored when training the model. As shown in Table 4, without using the side information, the prediction performance of the proposed model significantly declines in the 2-fold and 5-fold cross-validation. The comparison results demonstrate the ability of MVMTMDA to integrate multiple graph data, and also confirm our assumption that the information of LMI and MDA is closely related and mutually beneficial for the prediction task of each other.
Results of 2-fold and 5-fold cross-validation yielded the proposed model with and without side information
| Prediction | Cross-validation | MVMTMDA with side information | MVMTMDA without side information |
|---|---|---|---|
| MDA prediction | 2-fold CV | AUC: 0.8410; HR: 0.7196; NDCG: 0.4429 | AUC: 0.8306; HR: 0.7224; NDCG:0.4507 |
| 5-fold CV | AUC: 0.8512; HR:0.7553; NDCG: 0.4895 | AUC: 0.8423; HR: 0.7442; NDCG: 0.4705 | |
| LMI prediction | 2-fold CV | AUC: 0.8747 HR:0.731; NDCG: 0.4119 | AUC: 0.8316; HR:0.6217; NDCG: 0.3445 |
| 5-fold CV | AUC: 0.9014; HR:0.8506; NDCG: 0.5542 | AUC: 0.8697; HR:0.8291; NDCG: 0.5470 |
Sensitivity to hyperparameters
Depth of layers in networks
The number of layers in neural networks is critical for the performance of deep learning-based models. In this work, we simply set the layer numbers and the layer sizes of neural networks α, β and γ the same. We set the number layers as two, three and four for testing. Layer sizes that we set in our experiments are 64::32::16::8, 32::16::8 and 32::16 in the four-layer, three-layer and two-layer structure, respectively. Table 5 shows the prediction performance yielded by MVMTMDA with different layers in 5-fold cross-validation. Figures 3 and 4 show the corresponding curves for prediction performance and optimization. The results show that the proposed model was optimized with layer number set as 2. We therefore use such structure for MVMTMDA in the experiments of this paper.
Prediction performance using MVMTMDA with two, three and four layers in 5-fold cross-validation
| Prediction task | Depth of layers in networks | ||
|---|---|---|---|
| Two layers | Three layers | Four layers | |
| MDA prediction | 0.8512+/−0.012 | 0.781+/−0.011 | 0.8384+/−0.015 |
| LMI prediction | 0.9014+/−0.012 | 0.8602+/−0.015 | 0.7647+/−0.022 |
| Prediction task | Depth of layers in networks | ||
|---|---|---|---|
| Two layers | Three layers | Four layers | |
| MDA prediction | 0.8512+/−0.012 | 0.781+/−0.011 | 0.8384+/−0.015 |
| LMI prediction | 0.9014+/−0.012 | 0.8602+/−0.015 | 0.7647+/−0.022 |
Negative sampling ratio
In this work, the samples from the datasets of MDA and LMI we collected are all positive such that the prediction task is a semi-supervised learning problem in which unlabeled samples are important to be considered. To train the model, we need to sample negative instances from unlabeled data to construct the set of X− in Equations 14 and 15. In this experiment, we apply different negative sampling ratios (i.e. 1, 3 and 5) to observe the performance variance with regards to the prediction on MDA and LMI. As shown in Table 6, MVMTMDA yielded the best prediction performance with negative sampling ratio set as 1 and 5 in the prediction of MDA and LMI, respectively. Figure 5 shows the corresponding precision-recall curves for the experiment. The area under the precision-recall curve (AUPRC) values for the green, red and blue curve are 0.3261, 0.3228 and 0.3024, respectively. The prediction performance is generally stable with different negative sampling ratios.
Prediction performance using MVMTMDA with different negative sampling ratios in 5-fold cross-validation
| Prediction task | Negative sampling ratio | ||
|---|---|---|---|
| 1-neg | 3-neg | 5-neg | |
| MDA prediction | 0.8512+/−0.012 | 0.8506+/−0.011 | 0.8437+/−0.015 |
| LMI prediction | 0.9014+/−0.012 | 0.8922+/−0.015 | 0.9109+/−0.012 |
| Prediction task | Negative sampling ratio | ||
|---|---|---|---|
| 1-neg | 3-neg | 5-neg | |
| MDA prediction | 0.8512+/−0.012 | 0.8506+/−0.011 | 0.8437+/−0.015 |
| LMI prediction | 0.9014+/−0.012 | 0.8922+/−0.015 | 0.9109+/−0.012 |
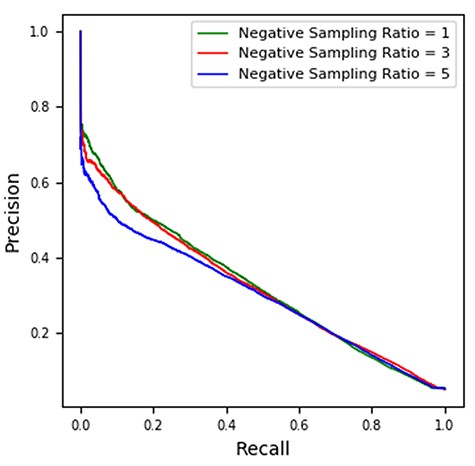
Precision-recall curves for microRNA-disease association prediction in 5-fold cross-validation. The AUPRC values for the green, red and blue curve are 0.3261, 0.3228 and 0.3024, respectively.
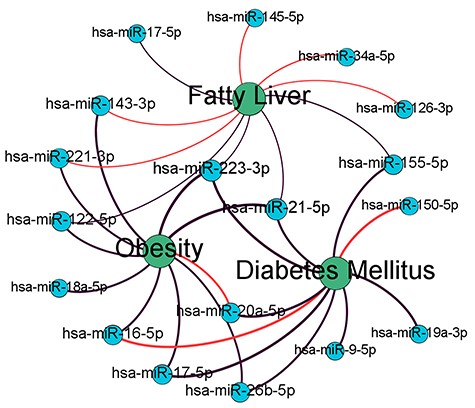
Top-10 prediction networks for obesity, diabetes mellitus and fatty liver. Black links mean known microRNA-disease associations existing in training data set while red links mean the predicted associations. Different line widths demonstrate the relation of predicted values.
Case studies
To further evaluate the prediction performance of the proposed method, in this section, we analyze the top-ranking prediction results focusing on four types of human diseases (colon neoplasms, obesity, diabetes mellitus and fatty liver). Specifically, we used the data of all known microRNA-disease associations as training samples and the method of MVMTMDA to perform prediction. The unknown microRNA-disease pairs in the top-ranking lists are manually verified from the published literatures.
Colon neoplasms, the most common malignancy in the gastrointestinal tract, is the third leading cause of cancer-related deaths in men and in women [32]. A number of microRNAs have been confirmed to involve in the mechanism of colon neoplasms. Using the method of MVMTMDA, we searched the top 10% ranked list of colon neoplasms. Table 7 shows the scores of 10 microRNA-disease pairs that are not included in the training set. As a result, 60% of them (6/10) were successfully verified from published literatures. The result illustrates that the top-ranking prediction yielded by the proposed method is efficient.
Unknown microRNA-disease pairs in top 10% prediction list for colon neoplasms
| Disease | microRNA | Score | Evidence |
|---|---|---|---|
| Colon neoplasms | hsa-miR-186-5p | 0.9773 | PMID: 26885189 |
| hsa-miR-20b-5p | 0.9702 | PMID: 27878272 | |
| hsa-miR-26a-5p | 0.9614 | PMID:26083618 | |
| hsa-miR-9-5p | 0.9582 | PMID:27844330 | |
| hsa-miR-27b-3p | 0.9563 | PMID: 28351320 | |
| hsa-miR-98-5p | 0.9658 | unconfirmed | |
| hsa-miR-144-3p | 0.9586 | unconfirmed | |
| hsa-miR-495-3p | 0.9566 | unconfirmed | |
| hsa-miR-199b-5p | 0.9688 | unconfirmed | |
| hsa-miR-451a | 0.9579 | PMID: 24875473 |
Ranked lists of top-10 microRNA-disease pairs for obesity, diabetes mellitus and fatty liver. (‘ecorded’ means the pair exists in the HMDD v3.0, i.e. the training data set)
| Diseases | MicroRNAs | Scores | Evidence | Diseases | MicroRNAs | Scores | Evidence |
|---|---|---|---|---|---|---|---|
| Obesity | hsa-miR-16-5p | 0.9317 | Recorded | Diabetes mellitus | hsa-miR-150-5p | 0.9472 | PMID:30552111 |
| hsa-miR-18a-5p | 0.9277 | Recorded | hsa-miR-9-5p | 0.9319 | Recorded | ||
| hsa-miR-17-5p | 0.9335 | Recorded | hsa-miR-155-5p | 0.9407 | Recorded | ||
| hsa-miR-20a-5p | 0.9265 | Unconfirmed | hsa-miR-223-3p | 0.9583 | Recorded | ||
| hsa-miR-221-3p | 0.9250 | Recorded | hsa-miR-21-5p | 0.9383 | Recorded | ||
| hsa-miR-26b-5p | 0.9216 | Recorded | Fatty Liver | hsa-miR-145-5p | 0.7771 | PMID: 0425654 | |
| hsa-miR-122-5p | 0.9254 | Recorded | hsa-miR-17-5p | 0.7386 | Recorded | ||
| hsa-miR-21-5p | 0.9714 | Recorded | hsa-miR-221-3p | 0.7544 | Unconfirmed | ||
| hsa-miR-143-3p | 0.9381 | Recorded | hsa-miR-34a-5p | 0.7664 | Recorded | ||
| hsa-miR-223-3p | 0.9698 | Recorded | hsa-miR-122-5p | 0.7314 | Recorded | ||
| Diabetes mellitus | hsa-miR-16-5p | 0.9498 | PMID:31568645 | hsa-miR-21-5p | 0.8701 | Recorded | |
| hsa-miR-17-5p | 0.9607 | Recorded | hsa-miR-155-5p | 0.7573 | Recorded | ||
| hsa-miR-19a-3p | 0.9467 | Recorded | hsa-miR-143-3p | 0.7299 | Unconfirmed | ||
| hsa-miR-20a-5p | 0.9518 | Recorded | hsa-miR-126-3p | 0.7692 | Unconfirmed | ||
| hsa-miR-26b-5p | 0.9323 | Recorded | hsa-miR-223-3p | 0.7655 | Unconfirmed |
In addition, we also investigated the top-10 ranked lists across different diseases. Three types of clinically associated diseases, i.e. obesity, diabetes mellitus and fatty liver, are selected for the analytics [33]. As shown in Table 8, there are totally eight known microRNA-disease pairs in the three top-10 ranked lists, and three of them were confirmed by checking the published literatures. Figure 6 shows the MDA network constructed by the top-10 MDA pairs across obesity, diabetes mellitus and fatty liver. In this network, more than half (11/18) microRNA nodes are shared by at least two disease nodes. Specially, the nodes of has-miR-223-3p and has-miR-21-5p are central in this network, linked to all disease nodes. This shows that microRNA predicted by MVMTMDA model tend to form clusters in the MDA network across different diseases that are clinically associated. MicroRNAs of similar biological functions tend to be involved in the mechanisms of similar diseases. Considering that the proposed method performs prediction based on the graph embedding features of nodes (i.e. p and q in Equation 11), the result proves the learned embedding features able to describe the distance of microRNA nodes in MDA and LMI networks, which reveals the similarity and dissimilarity of their biological functions.
Conclusion
The identification of MDAs is of great significance in microRNA therapeutics. Current computational methods for predicting MDAs haven’t considered the co-regulation between lncRNA and microRNA, which is becoming known to be very important for their function mechanisms. In this work, we propose a multiview multitask model composed of three deep neural networks to fill this gap. Considering the networks of MDA and LMI are two different views collaboratively implying the biological function of microRNAs, we apply a multiview learning method to extract embedding features for microRNA from two different graphs. In addition, we combine the prediction of MDA and LMI, which are closely related as they both belong to parts of aberrant ceRNA regulation on diseases. A number of experiments were implemented on the real datasets that we collected and extensive analysis is also made on the predicted results. The experimental results demonstrate the feasibility and effectiveness of the proposed model to predict MDA on a large scale.
The main contribution of our work is 4-fold. Firstly, the propose model is the first one to consider the interaction between lncRNA and microRNA for large-scale prediction of MDA. LMI is ideal data to uncover the association between microRNA and disease due to their meaning and data type. Secondly, we consider the incompleteness of the side information and use a multitask learning method to synchronously predict MDAs and LMIs. Thirdly, the proposed model enables an end-to-end prediction for MDA. Any type of graph data associated with microRNA (e.g. microRNA–gene interaction and microRNA–protein interaction) can be flexibly and directly used as inputs to improve the prediction, which is important because the amount of microRNA data is increasing rapidly. Fourthly, different from similarity-based model, the proposed model can automatically extract features from the raw data, providing a new type of data source for measuring microRNA functional similarity.
The proposed MVMTMDA model is the first of its type to consider the structural information of lncRNA–microRNA interaction network for predicting microRNA-disease association.
A novel deep learning-based method is proposed to consider the incompleteness of features using multitask learning, while the previous works in this domain did not.
A kind of graph embedding feature for depicting the underlying microRNA function in both networks of microRNA-disease association and lncRNA–microRNA interaction can be learned through multiview learning.
This work presents a new solution for an end-to-end prediction of microRNA-disease association with any graph data feature as inputs.
Funding
The National Natural Science Foundation of China under (Grant 61572506 to Z.-H.Y.).
Conflict of Interest
The authors declared that they have no conflicts of interest to this work.
Yu-An Huang is currently working toward the PhD degree in the Department of Computing at the Hong Kong Polytechnic University. His current research interests mainly focus on data mining algorithms and applications.
Keith C.C. Chan received the BMath (Hons) degree, MSc degree in Computer Science and Statistics and PhD degree in Systems Design Engineering from the University of Waterloo, Canada, in 1984, 1985 and 1989, respectively. He joined the Hong Kong Polytechnic University in 1994, where he is currently a professor in the Department of Computing.
Zhu-Hong You obtained his PhD degree in Control Science and Engineering from the University of Science & Technology of China (USTC). He is currently a Professor with the Xinjiang Technical Institute of Physics and Chemistry, Chinese Academy of Science, Ürümqi, China.
Pengwei Hu received the PhD degree from the Department of Computing, The Hong Kong Polytechnic University, Hong Kong, in 2019. Currently, he is a research scientist at IBM Research China. His research interests include machine learning, data mining, data fusion and biomedical informatics.
Lei Wang received the PhD degree from China University of Mining and Technology. He is currently working as a Postdoc research fellow in the Xinjiang Technical Institute of Physics and Chemistry, Chinese Academy of Science, Ürümqi, China.
Zhi-An Huang is currently working toward the PhD degree in the City University of Hong Kong. His current research interests mainly focus on brain signal analytics and medical data mining.
