


Abstract
Genome-wide association studies (GWAS) using longitudinal phenotypes collected over time is appealing due to the improvement of power. However, computation burden has been a challenge because of the complex algorithms for modeling the longitudinal data. Approximation methods based on empirical Bayesian estimates (EBEs) from mixed-effects modeling have been developed to expedite the analysis. However, our analysis demonstrated that bias in both association test and estimation for the existing EBE-based methods remains an issue. We propose an incredibly fast and unbiased method (simultaneous correction for EBE, SCEBE) that can correct the bias in the naive EBE approach and provide unbiased P-values and estimates of effect size. Through application to Alzheimer’s Disease Neuroimaging Initiative data with 6 414 695 single nucleotide polymorphisms, we demonstrated that SCEBE can efficiently perform large-scale GWAS with longitudinal outcomes, providing nearly 10 000 times improvement of computational efficiency and shortening the computation time from months to minutes. The SCEBE package and the example datasets are available at https://github.com/Myuan2019/SCEBE.
Introduction
Genome-wide association studies (GWAS) with longitudinal outcomes allow higher statistical power to detect genetic variants with relatively weak effects [1, 2], better identification patient populations and better understanding of mechanisms of disease resistance and disease progression [3], etc. Mixed-effects model is a powerful and popular tool to model repeated measurements [4]. However, computation burden become challenging for such model as millions of single nucleotide polymorphisms (SNPs) are evaluated in GWAS. Currently, the most commonly used algorithm for testing association is either the Wald test or the likelihood ratio test [3, 4]. In addition, local convergence may lead to biased parameter estimation and P-values for mixed-effects models.
Empirical Bayesian estimates (EBEs) derived from the base mixed-effects model without covariates have long been used as an ad hoc approach to facilitate variable selection for low-dimension data [5, 6]. Efforts were made to utilize EBE-based approach [thereafter referred as naïve EBE (NEBE)] to test association in GWAS [7, 8] with longitudinal outcomes. Despite of its simplicity, it is well known that the EBEs are biased as they tend to be shrunk to the corresponding population mean [6, 9] and may not be suitable for identification of significant variables [9, 10]. Therefore, there is an urgent need to develop an efficient and scalable algorithm to compute unbiased association test statistics for GWAS with longitudinal outcomes.
We propose a novel, high-throughtput algorithm to provide an efficient and scalable computation of the association test statistics for GWAS with longitudinal outcomes. This method not only corrects the bias caused by shrinkage and provides numerically identical estimation and P-values to those from the standard mixed-effects model, but also could be 10 000 times faster than the current standard approach.
Methods
We propose a simultaneous correction for empirical Bayesian estimator (SCEBE), which can simultaneously correct genetic effects on all random parameters. The SCEBE method contains three steps:
Step 1: fit a base mixed-effects model without covariates (thereafter referred as base model). In this step, maximum likelihood estimators (MLEs) or restricted maximum likelihood estimators (REMLs) are obtained for the fixed effects, between-subject variability (random effects) and within-subject variability under the base model.
Step 2: treat the predictors of random effects (i.e. EBEs) from Step 1 as phenotypes for genome-wide association analysis using a standard linear regression model. The resulting SNP effect estimates (and corresponding P-values) are referred as the NEBEs. The EBEs are the weighted sum of the population and sample mean, thus suffer from the shrinkage to population mean especially when longitudinal samples are sparse or/and within-subject variability is large. The shrunk EBEs tend to produce biased NEBE estimators.
While this paper was in development, Sikorska et al. also published an alternative, efficient algorithm for genome-wide analysis of longitudinal data (GALLOP) [11]. The main idea of GALLOP is to efficiently solve the Henderson equation by taking consideration of the block diagonal feature of the coefficient matrix of the Henderson equation. In this paper, we also implemented GALLOP in our R package and applied it to the simulation and real data analysis for comparison.
Results
ADNI data analysis
The data were downloaded from the Alzheimer’s Disease Neuroimaging Initiative (ADNI) database (www.loni.usc.edu/ADNI). The ADNI is an ongoing longitudinal multicenter study aimed at detecting and monitoring the early stage of Alzheimer’s disease (AD) by investigating the magnetic resonance imaging, positron emission tomography, genetic, biochemical biomarkers and neuropsychological and clinical assessment. Since the initial phase ADNI-1 was carried out in 2004, the ADNI has been extended to ADNI-2, ADNI-3 and ADNI-GO. There are 784 individuals enrolled in the study and a total of 6 528 104 SNPs were sequenced and screened after quality control. In this paper, we used one of the most widely used imputation methods, segmented haplotype estimation and imputation tool [12], to impute missing genotypes. After deleting SNPs with minor allele frequency being smaller than 0.05 and SNPs with only one genotype for all individuals, 6 414 695 SNPs were analyzed. We used repeatedly measured Rey Auditory Verbal Learning Test (RAVLT) forgetting scale scores over time as the longitudinal response phenotype, and investigated the SNP effects on the progression rate of RAVLT over time.
The key features of the proposed method SCEBE are time efficiency and accuracy compared to standard LME. We first compared the computation time cost for different approaches using the ADNI data (6 414 695 SNPs) (Figure 1). The computation was performed on an Ubuntu 16.04 LTS running on a server with [email protected] and 8G RAM. It required approximately 145 days (single-CPU time) for LME to scan through all the SNPs, while only 2, 37 and 118 min were needed for NEBE, SCEBE and GALLOP, respectively (Figure 1A). Therefore, SCEBE approach was nearly 10 000 times faster than LME (Figure 1B).
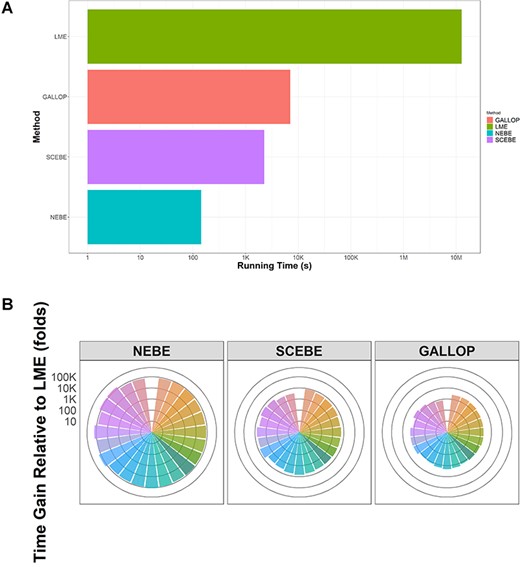
(A) Running time required for LME/NEBE/GALLOP/SCEBE to complete GWAS scan of ADNI data (performed on an Ubuntu 16.04 LTS running on a server with [email protected] GB and 8 GB RAM; 784 individuals and 6 414 695 SNPs). (B) Fold change in computation time (logarithm scale) for NEBE/GALLOP/SCEBE relative to standard LME to complete GWAS scan of 23 chromosomes in ADNI data (784 individuals and 6 414 695 SNPs; fold change is calculated as time for LME over time for alternative methods; each bar represents a chromosome; performed on an Ubuntu 16.04 LTS running on a server with [email protected] GB and 8 GB RAM).
The SCEBE also provide unbiased estimates and similar P-values compared to classical LME (Figure 2). In contrast, as expected, the estimates of effect size based on NEBE approach had marked biases (Figure 2B). Due to the shrinkage, the estimated effect of the SNPs on the disease progression (slope) based on NEBE was close to zero despite that the underlying genetic effects based on LME were apparent for many SNPs (Figure 2B). Furthermore, the P-values from the intermediate biased NEBE are obviously different from those of the standard LME (Figure 2A). SCEBE corrected the bias in estimation and P-values from NEBE and provided very similar P-values as the standard LME (Figure 2A). In comparison, GALLOP and SCEBE shared very similar P-values for association tests and estimation of SNP effects for the ADNI data. Nevertheless, the SCEBE was three to four times faster than GALLOP (Figure 1A and B).
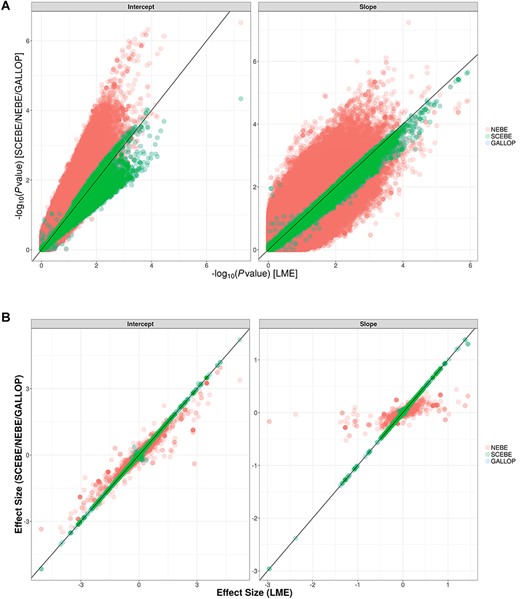
(A) Scatter plots of P-values from NEBE/GALLOP/SCEBE against LME on the −log10 scale for ADNI data with 784 individuals and 6 414 695 SNPs. (B) Scatter plots of estimates from NEBE/GALLOP/SCEBE against LME for ADNI data with 784 individuals and 6 414 695 SNPs.
Manhattan plot based on SCEBE for the ADNI data is presented in Figure 3. A closer look at the top 20 SNPs for both baseline disease status (intercept) and disease progression (slope) is displayed in Figure 4. Four out of the top 20 SNPs for the baseline AD status are related to genes that have been reported to be associated with AD [13, 14]. Among them, rs429358 is within apolipoprotein E (APOE), rs12721051 is within APOC1 and rs4420638 and rs56131196 are 500B downstream variants of APOC1. It is well known that APOE4 is involved in the pathogenesis of both late-onset familial and sporadic AD [13]. In addition, recent literature suggested that immunosuppression associated with APOC1 in the context of Aβ innate immune activation is potentially clinically relevant [14].
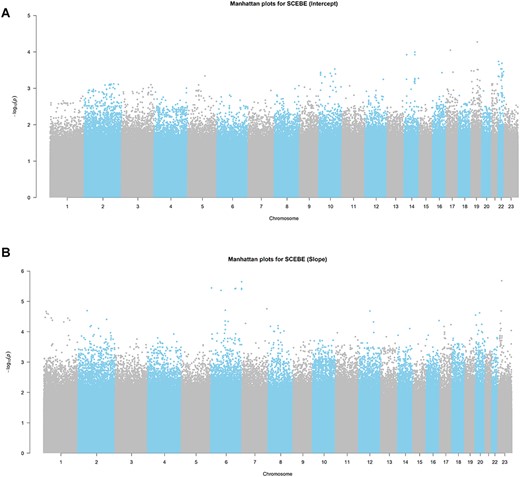
(A) Manhattan plot for testing associations on baseline disease status (intercept) by SCEBE for ADNI data with 784 individuals and 6 414 695 SNPs. (B) Manhattan plot for parameter estimation on disease progression (slope) by SCEBE for ADNI data with 784 individuals and 6 414 695 SNPs.
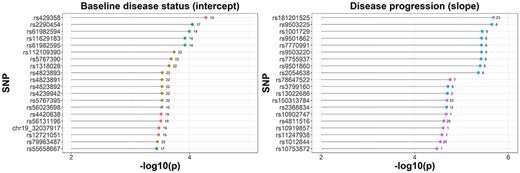
Lollipop plot for top 20 SNPs selected by SCEBE for ADNI data with 784 individuals and 6 414 695 SNPs (x-axis is −log10 of P-values and y-axis is the SNP name; the number behind each bar is the chromosome ID).
In addition, among the top 20 SNPs for disease progression according to RAVLT scores, rs3799160 is within PDE10A, which has been reported to be related to AD in recent literatures [15, 16]. It was discovered that most phosphodiesterase (PDE) isoforms (including PDE10A) are expressed in the brain, and PDE inhibitors are capable to improve memory performance in different animal models of AD [15]. Additionally, expression of PDE10A was found to be upregulated after long-term potentiation induction in the hippocampus of awake adult rats [16], indicating that it may have effects on memory and cognition.
Since very few GWAS have been reported using RAVLT scores over time, the other SNPs identified in this study (Supplementary data, Table S1) may provide new insights for biology of AD and its disease progression. Further investigations are warranted in the future to better understand the biology of these SNPs.
Simulation studies
Association test
We also use extensive simulations to compare the standard LME with the NEBE, SCEBE and GALLOP approaches. Briefly, m = 100, 500, 1000 or 10 000 subjects were simulated for a given scenario. Two unbalanced sampling schemes, sparse (1, 2, 3 or 5 samples per subject over time) and intensive (3, 5, 7 or 9 samples per subject over time) sampling, were implemented in the simulations. Assuming that the allele frequency of risk allele |${p}_A$| is randomly sampled from a uniform distribution |$\mathrm{U}\big(\mathrm{0.05,0.5}\big)$| and Hardy–Weinberg equilibrium holds in population, the probabilities of three genotypes are |${p}_A^2,\kern0.5em 2{p}_A\big(1-{p}_A\big),{\big(1-{p}_A\big)}^2$|, respectively. Hundred, 1000 and 10 000 SNPs are independently sampled from a multinomial distribution with probability |$\big({p}_A^2,2{p}_A\big(1-{p}_A\big),{\big(1-{p}_A\big)}^2\big)^{\prime }$|. We assumed that no effects of SNPs were on baseline disease status (intercept), while the effect sizes of SNPs on disease progression (slope) were randomly sampled from a uniform distribution|$\mathrm{U}\big(\mathrm{0,0.5}\big)$|. The between-subject covariance was assumed diagonal with all elements were set to 1, while the within-subject covariance was also assumed diagonal, which was set to 0.5, 1, 2 or 3 to allow different levels of shrinkage. In total, 96 scenarios were simulated and each was done for 1000 replicates.
For the association test, although the P-values calculated based on NEBE appear to be trending the same way as those based on the LME approach, the discrepancy in the P-values from these two approaches was obvious as the data points scatter around the 1:1 identity line (Supplementary data, Figure S1). On the contrast, SCEBE provided very similar P-values for the association test on both intercept and the slope of the model compared to the LME approach regardless of the level of shrinkage.
As expected, compared to standard LME, NEBE severely underestimated the effect size due to shrinkage (Supplementary data, Figure S2). However, after corrections, the estimates from SCEBE are virtually identical to those based on the LME approach as the data points perfectly aligned on the 1:1 identity line. Similar to the findings based on the real ADNI data, the simulation study also demonstrated that GALLOP and SCEBE provided similar P-values and estimates for SNP effects (Supplementary data, Figures S1 and S2). All of the four investigated approaches can well controlled the type I error rate at the nominal level (Supplementary data, Figure S3).
Computation complexity
Since multiple integrations/approximations are required, the computation time for fitting a classic LME by lmer in ‘lme4’ package increases with the cubic of the number of individuals [17]. In addition, for a typical GWAS with LME, millions of LME model fittings are needed by adding one SNP at a time into the model.
The proposed SCEBE only requires a single run of the time-consuming LME model (i.e. the base model without SNP effects) to estimate the random effects parameters. Then the association studies are performed by treating the EBEs for a model parameter as the phenotype and SNPs as genotypes using linear regression models. This substantially reduces the per-SNP computation time as it converts the complex LME model to simple linear regression. Finally, the bias in SNP-effect estimates and test statistics caused by shrinkage of EBEs is corrected by a correction matrix. Since analytic expression for the correction matrix can be derived theoretically, the computation can be done through matrix–vector manipulation for all the SNPs together as long as the computer memory allows.
Our simulation experiments confirmed that the computation time of SCEBE was drastically improved compared to that for LME (Supplementary data, Figure S4A). Depending on sample size and number of SNPs, approximately 100–2000 folds of increase in computation efficiency were observed for SCEBE. The gain in time efficiency relative to LME improved with increasing sample size or/and increasing number of SNPs (Supplementary data, Figure S4B). In the GWAS analysis for ADNI data where over 6 million of SNPs were involved, the gain in time efficiency was approximately almost 10 000 time for SCEBE (Figure 1B). Consistent with the analysis for ADNI data, the SCEBE was three to four times faster than GALLOP in the simulation studies (Supplementary data, Figure S4).
Confounding
Confounding due to relatedness or population stratification is one of the most challenging issues in statistical inferences for GWAS [18–21]. We conducted additional simulations to study the impact of population stratification on statistical inference based on the approaches discussed in this article. We simulated data using the Balding–Nichols model [22–24] (details are provided in Supplementary Data/Section 2).
As expected, in the presence of population stratification, the quantiles of test statistics of the SNPs tend to deviate from the theoretical quantiles of Chi-square distribution with 1 degree of freedom (Supplementary data, Figure S5). However, SCEBE could still provide unbiased estimates and very similar P-values compared to the standard LME despite of population stratification (Supplementary data, Figure S6A and B). This suggests that population stratification has similar impact on the standard LME and SCEBE. Furthermore, it appears that genomic control [17] could correct the test statistics back to the theoretical distribution for both SCEBE and LME when all simulated SNPs had no effects and reduce the influence of population stratification when there were SNPs with active effects (Supplementary data, Figure S5).
Discussion
GWAS with longitudinal outcomes based on repeated measures could markedly increase the statistical power, particularly for detecting genetic variants with relatively weak effects [1, 2]. Mixed-effect modeling has been an attractive approach for GWAS with longitudinal outcomes despite of its computational challenge and cost [3, 25]. Althgouh EBE-based approaches can reduce the computational time [7, 8], these approaches suffer from shrinkage-induced bias in estimation and association test (i.e. P values), particularly in presence of large measurement errors or with sparse observations per subject. We proposed an approach that can correct the bias related to NEBE, but preserve the feature of high throughput for NEBE. We demonstrated that this novel approach with ADNI data and completed a GWAS with longitudinal outcomes on millions of SNPs within an hour in comparison with months using the standard LME modeling, representing nearly 10 000 times improvement of computational efficiency. In addition, our simulation shows that the improvement of time efficiency by SCEBE increases with increasing sample size (Supplementary data, Figure S3). This feature suggests the potential application of SCEBE to modern data with large sample size, particularly for emerging large-scale genetic data from biobanks [26].
Confounding due to relatedness or population stratification is one of the most important and challenging issues in GWAS. Our simulation studies showed that population stratification had similar impacts on all the approaches. Furthermore, our simulation showed that genomic control could correct the bias in the test statistics caused by population stratification. SCEBE reduces the LME-based GWAS for longitudinal outcomes to standard linear-regression GWAS, where EBEs are treated as phenotypes. This allows coupling SCEBE with other more sophisticated approaches, such as, EIGENSTRAT/principal components analysis [19, 20] and linkage disequilibrium regression [21], for controlling bias due to population stratification. Future research on how to use SCEBE with these confounding-controlling approaches is warranted.
Over the last decade, different approaches have been attempted for nonlinear GWAS of longitudinal outcomes [27–29]. However, these methods are extremely time-consuming and often require hours for only 1000 tests [1], which is not scalable for large-scale GWAS data with millions of SNPs. In the present paper, although we limited ourselves to linear mixed-effects modeling, SCEBE can be easily extended to nonlinear longitudinal data, which open the door for efficient and scalable functional GWAS for more complex nonlinear longitudinal traits.
While this paper was in development, Sikorska et al. also present a new algorithm that expedites genome-wide analysis of longitudinal data (GALLOP) [11]. GALLOP solves the equivalent penalized least squares problem efficiently and factorizations and transformations are used to avoid inversion of large matrices. Both of our simulation study and real-data analysis suggest that GALLOP and SCEBE provide similar P-values and estimation for effect size in the context of linear model for disease progression. However, SCEBE was three to four times faster than GALLOP. More importantly, when generalizing to nonlinear mixed-effects model, our preliminary simulation study indicated that the performance of GALLOP could be less consistent and exhibited suboptimal performance compared to SCEBE (Supplementary Data/Section 3 and Supplementary data, Figure S7). This suggests that SCEBE is robust and consistent for GWAS using both linear and nonlinear longitudinal data. Future investigation may be needed in this area.
Modeling GWAS data on longitudinal outcome using mixed-effects model can improve statistical power; however, computational complexity and efficiency remain difficult and challenging.
SCEBE provides almost identical estimation and P-values compared to the standard likelihood based approach.
SCEBE provides nearly 10 000 times improvement of computational efficiency and shortens the computation time from months to minutes.
Funding
Y.Yang is supported by National Science Foundation of China (NSFC), Grant No. 11671375. M.Y. is supported by the Natural Science Foundation of Anhui Provincial Education Department, Grant No. KJ2017A171 and Doctoral research funding of Anhui Medical University, Grant No. XJ201710. J.X. is supported in part by the University of Hong Kong Seed Fund for Translational and Applied Research (201711160015) and The University of Hong Kong—Zhejiang Institute of Research and Innovation Seed Fund, and General Research Fund (17308018) of Hong Kong.
Min Yuan is an associate professor in biostatistics in the Center for Big data in Public Health, Anhui Medical University, Anhui, China. Her interest is developing statistical models in genomic research.
Xu Steven Xu is a data scientist in Genmab US, Inc., Princeton, NJ, USA. His interest is developing statistical models and quantitative analysis in clinical trials.
Yaning Yang is a professor in biostatistics in the Department of Statistics and Finance, University of Science and Technology of China, Heifei, China. His interest is genetic statistics.
Yinsheng Zhou and Yi Li are PhD students in biostatistics in the Department of Statistics and Finance, University of Science and Technology of China, Hefei, China. Their interest is developing computational algorithm in haplotype-based research.
Jinfeng Xu is an associate professor in Department of Statistics and Actuarial Science, University of Hong Kong, Pok Fu Lam, Hong Kong. His interest is statistical modeling with longitudinal data.
Jose Pinheiro is a statistician in Janssen Research and Development LLC, Raritan, NJ, USA. His interest is statistical modeling with longitudinal data.
References
Author notes
Min Yuan and Xu Steven Xu contributed equally to this work.
