


Abstract
With the advances of next-generation sequencing technology, the field of disease research has been revolutionized. However, pinpointing the disease-causing variants from millions of revealed variants is still a tough task. Here, we have reviewed the existing linkage analysis tools and presented PedMiner, a web-based application designed to narrow down candidate variants from family based whole-exome sequencing (WES) data through linkage analysis. PedMiner integrates linkage analysis, variant annotation and prioritization in one automated pipeline. It provides graphical visualization of the linked regions along with comprehensive annotation of variants and genes within these linked regions. This efficient and comprehensive application will be helpful for the scientific community working on Mendelian inherited disorders using family based WES data.
Introduction
Linkage analysis is a classical statistical approach employed to find out the approximate location of disease-associated genes. By using polymorphic markers to track the co-segregation of genetic material with the phenotype in the enrolled family, linkage analysis can narrow down the regions of interest and reduce the number of candidate genes, which can largely alleviate the workload and time of researchers. Furthermore, linkage analysis offers statistical evidence of a variant’s involvement in disease susceptibility [1, 2]. As shown in the workflow, where familial sample collection is followed by genotyping (by any of the various means), linkage analysis and targeted sequencing has been successfully applied to discover rare variants in a segment associated with a genetic disorder [3–5] (Figure 1A).
In the last decade, the development of high-throughput sequencing technology has revolutionized the field of human genetics and dramatically accelerated the pathogenic variant discovery [6–8]. At present, both whole-genome sequencing (WGS) and whole-exome sequencing (WES) are in active practice for discovering pathogenic variants. Since its comparatively lower cost, along with the majority of the known Mendelian disease-causing variants located in protein-coding regions of the genome, WES is more widely used than WGS [7, 9]. Although WES only targets 1% of the genomic region, still hundreds of thousands of variants would be detected from each sample. Therefore, it is still a great challenge to effectively screen these large number of variants and to find out primary candidate disease-associated variants. Sequencing familial samples and performing variant filtration with the Mendelian inheritance pattern is a more effective strategy as compared to using sporadic samples. The variants following the genetic laws are further screened by ruling out the variants with allele frequency exceeding a certain threshold in public databases (such as the 1000 Genomes Project [10] and ExAC [11]) and then prioritized by pathogenicity predicted by bioinformatic tools (such as SIFT [12], Polyphen-2 [13] and MutationTaster [14]) (Figure 1B) However, in practice the efficiency of hard-filtering by predefined thresholds is affected by many factors such as the number of sequenced members, allele frequency reference dataset quality (population size and distribution) and selected filtering thresholds. Therefore, this WES-based filtering approach is still insufficient to identify the disease-causing variants, as it sometimes leads to too many candidates or failure to find candidates. Moreover, it cannot offer statistical evidence of a variant’s involvement in disease susceptibility [15, 16].
To improve screening efficiency, previously several studies attempted to analyze the family samples by combining the array-based linkage analysis with the WES-based hard-filtering approach, which has been successfully applied to target the pathogenic variants [17–19]. However, their linkage analysis is based on an additional single nucleotide polymorphism (SNP) array test, which increases the cost and time consumption. Thus, a more efficient and cost-saving strategy is to use WES data for linkage analysis directly and to further screen candidate variants within the linked regions (Figure 1C).
In this study, we have systematically reviewed the classical linkage analysis tools and discussed the feasibility of performing linkage analysis using WES data. Moreover, we implemented an easy-to-use web-based tool, PedMiner consisting of the following key features: (i) *.VCF files of family based WES data are used to perform linkage analysis directly; (ii) One-step automated pipeline that integrates pedigree relationship inference, linkage analysis, variants annotation and prioritization.
Classical linkage analysis tools
A number of tools have been developed previously to perform linkage analysis (Table 1) [20–32]. Here, we briefly summarized the features of existing tools regarding some specific aspects:
Type of Tools
Currently, most available linkage analysis tools are based on command-lines that run fast and can perform batch analysis. However, these tools are not easy-to-use for users with limited bioinformatics skills as the task always needs to be set up on a server to run the scripts. Additionally, users need to deal with many confusing parameters.
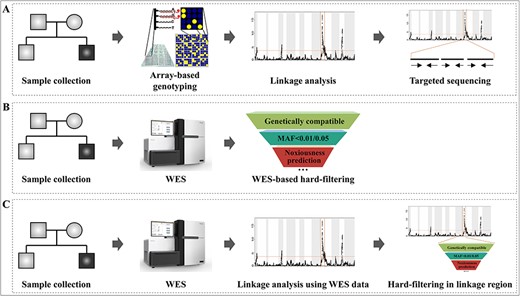
Development of the disease-associated variants identification strategy. (A) Traditional linkage analysis workflow. (B) WES-based hard-filtering approach. (C) Perform linkage analysis using WES data directly and further screen candidate variants within the linked regions.
A comparison of family-based linkage analysis tools currently in use
| Tool | Type | Algorithm | Input format | Results display | ||||
|---|---|---|---|---|---|---|---|---|
| Linkage region | Graphical visualization | Annotation | Filtration | Reference | ||||
| LINKAGE | Package | Elston-Stewart | LINKAGE Format | ✓ | ✕ | ✕ | ✕ | [20, 21] |
| MENDEL | Package | Elston-Stewart and Lander-Green | SNP data in binary format | ✓ | ✕ | ✕ | ✕ | [22] |
| TLINKAGE | Package | Elston-Stewart | DATAFILE format | ✓ | ✕ | ✕ | ✕ | [23] |
| GENEHUNTER | Package | Lander-Green | GENEHUNTER format | ✓ | ✕ | ✕ | ✕ | [24] |
| LOKI | Package | MCMC | LOKI format | ✓ | ✕ | ✕ | ✕ | [25] |
| SIMWALK2 | Package | MCMC | SIMWALK2 format | ✓ | ✕ | ✕ | ✕ | [26] |
| MERLIN | Package | Lander-Green | QTDT / LINKAGE format | ✓ | ✕ | ✕ | ✕ | [27] |
| SUPERLINK | Package | Bayesian networks | SUPERLINK format | ✓ | ✕ | ✕ | ✕ | [28] |
| EASYLINKAGE-Plus | Package | Several Integrated programs (including GENEHUNTER) | SNP data in plain text | ✓ | ✓ | ✕ | ✕ | [29] |
| PSEUDOMAKER | Package | Several Integrated programs | LINKAGE format | ✓ | ✕ | ✕ | ✕ | [30] |
| PLINK | Package | GPS | PLINK format | ✓ | ✓ | ✕ | ✕ | [31] |
| SEQLINKAGE | Package | Elston-Stewart | WGS data in VCF format | ✓ | ✓ | ✕ | ✕ | [32] |
| PedMiner | Web | Lander-Green | WES data in VCF format | ✓ | ✓ | ✓ | ✓ | This study |
MCMC: Markov chain Monte Carlo, GPS: Global positioning system, Tick (✓): implemented in the tool, Cross (✕): not available.
Algorithm implanted
Several algorithms have been proposed and implanted in linkage analysis tools to calculate the likelihood of observed pedigrees. Among them, the Elston–Stewart algorithm and the Lander–Green algorithm are most commonly used [15, 33]. For the Elston–Stewart algorithm, the time for computation increases linearly with the size of the pedigree but increases exponentially with the number of biomarkers. Tools developed on Elston–Stewart algorithm like LINKAGE and SEQLINKAGE are capable of analyzing large pedigrees but the number of biomarkers that can offer is generally limited to six to eight [34]. Conversely, the Lander–Green algorithm consumes computational time that increases exponentially with the size of the pedigree but increases linearly with the number of biomarkers. Tools based on the Lander–Green algorithm like GENEHUNTER and MERLIN are suitable to analyze small- or medium-sized pedigrees with large numbers of biomarkers [35].
Input requirement
In general, linkage analysis requires information of pedigree relationship, phenotype, genotype and reference genetic map. However, classical tools are developed to analyze genotype array datasets and require their own stringent formats that are diverse among different tools. Thus, additional format conversion tools like MEGA2 are required to prepare the files needed for linkage analysis [36].
Result display
Most tools show the analyzed results in plain text, which is not intuitive for users to narrow down the linkage regions. Though EASYLINKAGE, PLINK and SEQLINKAGE provide figures to illustrate the logarithm of the odds (LOD) score, these tools only provide linkage region coordinates but without any annotations for the genes within the linkage regions. Furthermore, because most of the current tools are designed for linkage analysis using genotype array data, variant annotation and filtration functions are not accessible.
These tools have been successfully applied to locate the disease-causing genes with genotype array data. However, in the era of sequencing, whether the classical tools can be used to analyze the sequence data deserves more attention and trial.
Linkage analysis for next-generation sequencing (NGS) data
Several studies have explored the feasibility of performing linkage analysis directly with polymorphic markers extracted from WES data, which point out that this combined linkage and WES-based hard-filtering approach is feasible and powerful in reducing the number of candidate variants [16, 37]. Here, we briefly summarized the limitations and the potential improvement of this approach.
Marker distribution
When performing linkage analysis using polymorphic markers extracted from WES data, the missing variants outside of exons might be a problem for the present linkage algorithms. Gazal et al. [16] performed linkage analysis using WES data and found that both the false-positive and false-negative signals are quite low even the genome coverage is not uniform in WES targeted region. It is worth mentioning that this limitation can be overcome by introducing advanced capture technologies. With the application of ‘exome plus’ capture, in which extra probes are designed and attached to an exome capture kit and a large number of variants located in non-exonic regions are obtained [6]. For example, some capture kits add probes equidistantly outside of exon regions for copy number variants analysis and SNPs detected by these probes are suitable to be used as polymorphic markers for linkage analysis. These additional non-exonic SNP markers can further alleviate the problem of non-uniform distribution of markers caused by the WES natural defect [37].
Genotype quality
Genotypes obtained by low-depth NGS technologies tend to have a higher error rate than those obtained from genotyping arrays that result in false-positive linkage peaks [38]. This problem can be addressed by the recent advances in NGS technologies. On one hand, to improve the variant calling accuracy of family based sequencing data, some tools consider both linkage disequilibrium patterns and the constraints from the family structure when it assigns individual genotypes to subjects. On the other hand, the increase of sequencing depth further reduces the rate of error in genotype calling [39–41].
Based on the above analysis, performing linkage analysis using WES data is a feasible and promising approach to locate the candidate variants efficiently. However, the existing linkage analysis tools are neither suitable nor convenient to perform analysis with WES data directly: (i) VCF format data are not supported by current linkage tools; (ii) command-line package type tools are not user-friendly; (iii) graphical visualization of linkage regions, annotation and filtration of variants or genes are not accessible. Thus, an online bioinformatics tool that can detect and systematically annotate linkage regions with family based WES data is urgently needed.
PedMiner
To meet the requirements mentioned above, we have developed a web-based application, PedMiner, which is designed to perform linkage analysis for family based WES data using the widely implanted Lander–Green algorithm. PedMiner have two main function modules: (i) detection and visualization of the linkage regions; (ii) annotation and filtration of variants and genes within the detected linkage regions (Figure 2). All the details regarding construction, quality control and step by step detail of how to run PedMiner with a case study has been documented in the Supplementary material. The web server is implemented in PHP + Python + R and is online available to all users for free at https://mcg.ustc.edu.cn/bsc/pedminer/.

The architecture of PedMiner. The linkage region detection function is based on the Lander–Green algorithm and VCF files can be upload directly. PedMiner provides relationship inference function and graphical visualization of the linkage region. The annotation and filtration functions are provided to prioritize the diseasing-causing variants and genes.
Preparations for analysis
Upload samples and assign parameters
PedMiner requires inputs in VCF format, and to reduce the uploading time, VCF files compressed in *.tar.gz or *.zip format is recommended. To initiate the analysis, users should assign the reference SNP dataset and pedigree parameters. The reference SNP dataset contains the genetic map and allelic frequency information that are required to extract SNP genotypes from the uploaded VCF files as polymorphic markers for linkage analysis. The pedigree parameters are used to indicate the structure of the family includes relationship, gender, subject’s phenotype (control or patient) and sequencing status (sequenced or not). PedMiner can generate pedigree parameters for each family member automatically and users can directly modify it on the web page (Figure 3A).
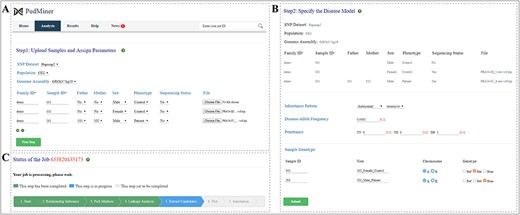
Input page of PedMiner and parameters for the linkage region detection. (A) Upload samples and assign parameters. (B) Specify the disease model. (C) Job-status displayed in real-time.
Specify the disease model
After completing the initial steps, users will be guided to select the inheritance pattern, disease-allele frequency and penetrance to specify the disease model. After this, users need to define the expected genotype of each sample according to the selected inheritance pattern (Figure 3B). Currently, eight inheritance patterns are supported by this application, including autosomal recessive and dominant, X-linked recessive and dominant, sex-influenced recessive and dominant, sex-limited recessive and sex-limited dominant.
Once all the parameters are set, users can click the ‘Submit’ button to start the analysis (Figure 3B). A web page will display the job status and the link to the detailed results (Figure 3C). PedMiner also provides the reanalysis option in which users can analyze some other inheritance patterns or settings in the same uploaded data without uploading VCF files.
Analysis of results
Once a job is completed, the parameters and detailed analysis results will be displayed in the ‘Results’ page. These results include relationship inference, linkage region interpretation, variant and gene annotation and filtration.
Relationship inference
Correct relationship among the members of pedigree under analysis is important for successfully mapping the disease locus, PedMiner integrates a relationship inference function for users to check the relationship among family members (Figure 4A). Based on the zero alleles identical by state (IBS0) and coefficient relatedness statistics displayed in the ‘Results’ page, users can infer the relationship between any samples (parent-child, sibling-sibling, monozygotic twins or sample duplicates and unrelated pairs) and true gender of each sample.
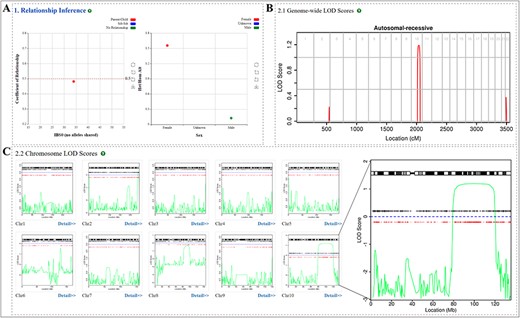
Relationship inference and linkage region interpretation result. (A) Sample relationship and sex inference. (B) Genome-wide LOD score. (C) LOD score for each chromosome and high resolution of LOD score distribution, ‘+’ and red dots represent the selected SNP markers and variants fulfilling the selected genotype pattern, respectively.
Linkage region interpretation
PedMiner provides visualization of the linkage region both in genome-wide and at single chromosomal scale. From the genome-wide LOD score distribution line graph, users can rapidly acquire all linkage regions across the entire genome (Figure 4B). Users can also get a graphical display of the linkage region with more information (SNP markers and variants fulfilling the selected genotype pattern) from a single chromosome map (Figure 4C). Furthermore, the genomic location of the linkage region was transformed from genetic position into physical position, and annotation for genes and variants within the linkage region are provided based on the physical position. By clicking the ‘Detail’ button below each thumbnail, detailed information will be presented in tabular format for each linkage region, including the position on the chromosome, LOD score, selected genotype pattern compatibility, selected marker, genotype and quality of variants.
Variant and gene annotation and filtration
PedMiner provides comprehensive annotations for variants and genes with information collected from multiple sources (Supplementary Table S1). For variant, the information includes linkage region, variant site, variant consequence, minor allele frequency (MAF), noxiousness prediction by multiple tools, corresponding gene and orthologous in mice (Figure 5A). For gene, the information includes gene location, function description, GO annotation, the phenotype of their knockout mice and disease-related information (Figure 5B).
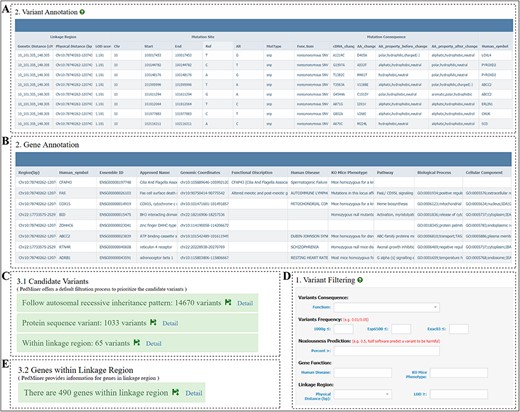
Annotation and filtration page of PedMiner. (A) Detail annotation information of the variants displayed in the table. (B) Detail annotation information of the genes displayed in the table. (C) Default three-step filtration process. (D) Variant filtration item and threshold, users can filter variants based on the variant consequence, population frequency, noxiousness software percent, gene function annotation and linkage region. (E) Genes within the linkage region.
Based on the above-mentioned annotation, PedMiner offers a default filtration process to set a priority hierarchy of the candidate variants following these commands: (i) keep variants following preset inheritance pattern; (ii) keep variants affecting protein sequence; (iii) keep variants within linkage regions as these variants are statistically co-segregate with the phenotype (Figure 5C). Results for each filtration step will be displayed on the ‘Results’ page, and users can further filter candidates via web page directly by setting the threshold for the annotation items (Figure 5D).
In case of the indirectly sequenced pathogenic variants in the gene exons of the linkage regions, PedMiner further provides the annotations of all genes in the linkage region, so that the user can select candidate pathogenic genes based on their known functions (Figure 5E). Thus, users could perform targeted sequencing to detect candidate variants in the non-exonic regions (such as promoter or enhancer region) of these genes in the follow-up experiments.
Case study
Here we are presenting our unpublished data where we have performed WES for an infertile patient and his mother from a Pakistani consanguineous family (Figure 6A). WES identified 14 670 variants that follow the autosomal recessive inheritance pattern. By eliminating the variants that do not affect the protein-coding sequence, 1031 variants were kept. Linkage analysis highlighted a region in chromosome 10 with LOD score > 1 that is statistically more likely contains the disease-causing variant (Figure 4B). After keeping variants located in the linkage region, the number of candidate variants is further reduced from 1031 to 65. For the remaining variants, 59 variants were eliminated due to high MAF (>0.05). For the last six variants, three variants were eliminated due to less than half noxious software predict it to be harmful. Those filter processes left three variants. Based on the gene annotation information, we found that a splice site variant located in the CFAP43 gene is most likely the disease-causing variant (Figure 6B and C). Detailed analysis results and the filtration process can be accessed at http://mcg.ustc.edu.cn/bsc/pedminer/result.php?job_id=576938593887. Furthermore, the co-segregation of this CFAP43: c.1442 + 1G > A variant in the pedigree was experimentally confirmed by Sanger sequencing (Figure 6D). By using PedMiner, the pathogenic variant identification process has been simplified as it has improved the screening efficiency and make extensive literature research and Sanger sequencing work unnecessary, which will save time and money of researchers.
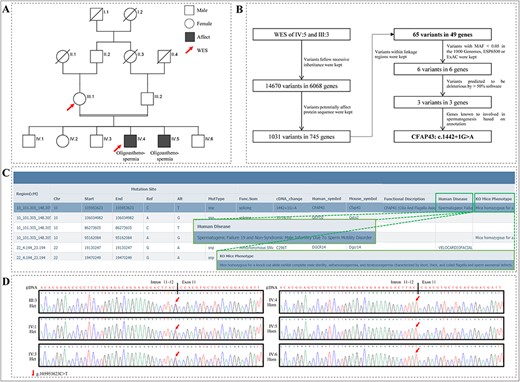
A splice site variant in CFAP43 that causes oligoasthenotspermia in a Pakistani consanguineous pedigree was identified by PedMiner. (A) Pedigree of the Pakistani consanguineous family with two patients affected with oligoasthenotspermia. (B) Flow chart of WES data analysis based on PedMiner. (C) Function annotation information of CFAP43. (D) Sanger sequencing chromatograms of the CFAP43 splice site variant in family members.
We also applied PedMiner to an already published data without the use of this tool and we successfully identified the same disease-causing variant as originally published [42]. The details have been documented in the supplementary material.
Conclusion
Disease gene and variant identification are critical to understanding the genetic basis of biological processes and improving human health. Here, we have shown that performing linkage analysis directly with polymorphic markers extracted from WES data is a feasible and promising solution to improve variants filtering efficiency, reduce analysis complexity as well. However, current linkage analysis tools are designed to perform linkage analysis using array-based genotyping data, which is not convenient to integrate those linkage analysis tools into the WES data analysis pipeline. Additionally, current linkage analysis tools are not user-friendly and functionally incomplete. Thus, we present PedMiner, which integrates linkage analysis, disease-associated variant annotation and prioritization for family based WES data. This combined strategy rejuvenates the tradition linkage analysis as well as improves the efficiency of the WES data filtering process. PedMiner will meet the great need for fundamental research and clinical diagnosis.
Systematically reviewed the traditional linkage analysis tools and WES-based hard-filtering approach, and summarized the limitations and potential improvement of performing linkage analysis with WES data.
Provided an easy-to-use web-based application, PedMiner, the one-step automated pipeline that integrates linkage analysis using family based WES data, linkage region visualization, variant/gene annotation and prioritization.
PedMiner successfully identified a splicing variant in CFAP43 as the candidate oligoasthenotspermia-causing variant in a Pakistani consanguineous family.
Author’s contribution
J.Z, D.Z and H.Z constructed the pipeline. J.Z and Y.Z wrote the manuscript. I.F modified the manuscript. Y.Z and Q.S conceived and supervised the project.
Funding
This work was supported by the National Natural Science Foundation of China (31890780); National Key Research and Developmental Program of China (2016YFC1000600, 2017YFC1001500); Strategic Priority Research Program of the Chinese Academy of Sciences (XDB19010200); the National Natural Science Foundation of China (31630050 and 31771668).
Acknowledgments
We thank Dr. Lu Zhang (Hong Kong Baptist University) and Changlin Wan (Purdue University) for their advice in revise our manuscript. We also thank the Bioinformatics Center of the University of Science and Technology of China, School of Life Science, for providing supercomputing resources.
Conflict of interest
The authors declare that we do not have any commercial or associative interest that represents a conflict of interest in connection with the work submitted.
Jianteng Zhou is a PhD student at School of Life Sciences, University of Science and Technology of China, Hefei, China.
Jianing Gao is a PhD student at School of Life Sciences, University of Science and Technology of China, Hefei, China.
Huan Zhang is an associate professor at Hefei National Laboratory for Physical Sciences at Microscale, University of Science and Technology of China, Hefei, China.
Daren Zhao is a master student at School of Life Sciences, University of Science and Technology of China, Hefei, China.
Ao Li is an associate professor at School of Information Sciences, University of Science and Technology of China, Hefei, China.
Furhan Iqbal is a postdoctoral fellow at Hefei National Laboratory for Physical Sciences at Microscale, University of Science and Technology of China, Hefei, China and an associate professor of Zoology at Bahauddin Zakariya University Multan, Pakistan.
Qinghua Shi is a professor at The First Affiliated Hospital of University of Science and Technology of China, Hefei National Laboratory for Physical Sciences at Microscale, University of Science and Technology of China-Shenyang Jinghua Hospital Joint Center for Human Reproduction and Genetics, Chinese Academy of Sciences (CAS) Key Laboratory of Innate Immunity and Chronic Diseases, School of Life Sciences, CAS Center for Excellence in Molecular Cell Science, Collaborative Innovation Center of Genetics and Development, School of Life Sciences, University of Science and Technology of China, Hefei, China. His research interest is focused on genetics and human diseases.
Yuanwei Zhang is an associate professor at School of Life Sciences, University of Science and Technology of China, Hefei, China. His research interest is focused on bioinformatics and human diseases.
Reference
Author notes
Jianteng Zhou, Jianing Gao, and Huan Zhang contributed equally to this work.
