


Abstract
An accurate prognosis assessment for cancer patients could aid in guiding clinical decision-making. Reliance on traditional clinical features alone in a complex clinical environment is challenging and unsatisfactory in the era of precision medicine; thus, reliable prognostic biomarkers are urgently required to improve a patient staging system. In this study, we proposed a patient-level computational framework from mechanistic and translational perspectives to establish a personalized prognostic signature (named PLPPS) in high-grade serous ovarian carcinoma (HGSOC). The PLPPS composed of 68 immune genes achieved accurate prognostic risk stratification for 1190 patients in the meta-training cohort and was rigorously validated in multiple cross-platform independent cohorts comprising 792 HGSOC patients. Furthermore, the PLPPS was shown to be the better prognostic factor compared with clinical parameters in the univariate analysis and retained a significant independent association with prognosis after adjusting for clinical parameters in the multivariate analysis. In benchmark comparisons, the performance of PLPPS (hazard ratio (HR), 1.371; concordance index (C-index), 0.604 and area under the curve (AUC), 0.637) is comparable to or better than other published gene signatures (HR, 0.972 to 1.340; C-index, 0.495 to 0.592 and AUC, 0.48–0.624). With further validation in prospective clinical trials, we hope that the PLPPS might become a promising genomic tool to guide personalized management and decision-making of HGSOC in clinical practice.
Introduction
Ovarian cancer is one of the most commonly diagnosed gynecologic malignancies and the leading cause of cancer mortality, accounting for about 5% of cancer deaths in women in the United States according to cancer statistics, 2019 [1]. High-grade serous ovarian carcinoma (HGSOC), which is responsible for about three-quarters of ovarian cancers, is the most frequent and aggressive diagnosed histologic subtype [2]. The standard treatment options for patients with HGSOC are aggressive cytoreductive (debulking) surgery followed by the platinum (taxane)-based chemotherapy and poly (ADP-ribose) polymerase (RARP) inhibitors [2]. Despite initial high response rates after first-line standard treatment, most patients will eventually relapse and have a poor outcome with a 10-year survival rate of 30–40%, largely due to late-stage diagnoses in ~70% of cases [3]. Therefore, clinically reliable prognostic biomarkers are urgently needed to improve patient staging systems and guide more accurate and effective personalized decision-making.
Advances in mechanistic understanding of HGSOC through multi-omic analysis studies have demonstrated genomic and transcriptomic characteristics, which account for significant clinical heterogeneity of HGSOC [4–6]. These molecular aberrations provide a new avenue to complement the clinicopathological features for improving treatment decisions and prognosis of HGSOC. In the past decades, numerous efforts had been made to improve risk stratification and had generated many gene expression prognostic signatures for HGSOC patients. However, most signatures in previous studies were generated solely based on computer-based algorithms and prior information of known survival outcomes from a statistical perspective that does not take into consideration biological rationale leading to lower reproducibility [7–11]. Recent studies identified gene signatures considering biological importance prospectively before gene selection such as gene enrichment analysis, pathway analysis, module analysis or coexpression network analysis [12–17]. For example, Li et al. proposed a high-frequency sub-pathway mining approach to identify prognostic signatures. Kang et al. focused on the DNA repair pathways and developed a molecular score based on gene expression in these pathways [12]. Our previous study identified a gene signature of homologous recombination deficiency (HRD) to predict outcomes in ovarian cancer [13]. However, most studies used a cohort-level modeling approach to construct and develop gene signatures that require a collection of samples in advance for appropriate scaling and normalization, which is a difficult task given the potential biological heterogeneity among data sets and technical biases across measurement platforms that prevented the translation of such signature into clinical practice [18, 19]. Furthermore, these signatures were usually generated from a small sample size or a single dataset and subsequently were not adequately validated in a large number of independent samples profiled by the different technology platform leading to overfitting on small discovery datasets and lack of sufficient validation.
Therefore, the main objective of the present study is to combine multiple gene expression datasets and develop a patient-level computational framework to identify and validate an individualized gene signature from mechanistic and translational perspectives, which could effectively predict prognosis using expression data of a single sample produced by different laboratories and technology platforms.
Materials and methods
Patient collection and study design
We retrospectively reviewed the related articles and databases, and finally collected a total of 2310 ovarian cancer patients from 16 datasets with publicly available gene expression data, clinical annotations and considerable sample size (> = 40), including 14 array-based datasets and two next-generation sequencing (NGS)-based datasets. All data were processed as described in our previous study [20]. After restricting our analysis to patients with HGSOC (grade 2 or 3 and FIGO stage III or IV), 1982 samples were included in our study. Among them, seven array-based datasets with a larger sample size (>100) were merged into a meta-training cohort for biomarker discovery, and the remaining seven array-based small datasets were merged into meta-testing I cohort and two NGS-based datasets were merged into meta-testing II cohort for independent performance evaluation. Detailed information and sources of all 16 datasets used in this study are listed in Table 1. The diagram of the study design is presented in Figure 1.
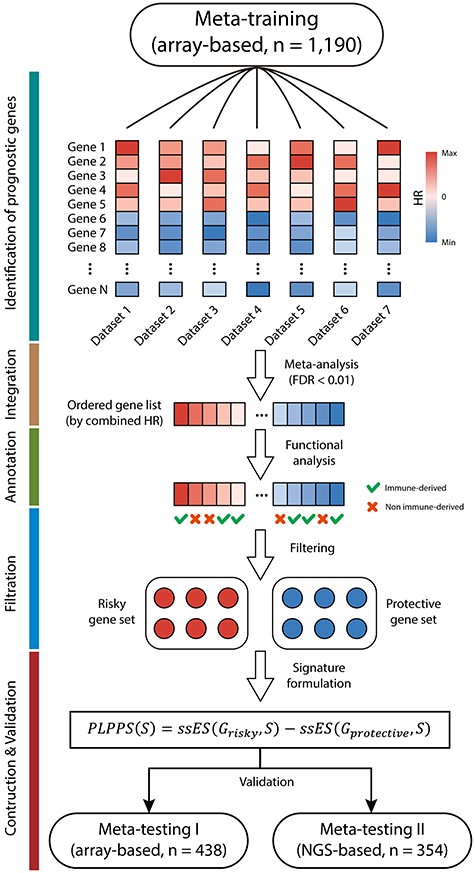
Diagram of the study design. A total of 1982 HGSOC patients from 16 HGSOC datasets were merged and divided into array-based meta-training cohort (n = 1190), array-based meta-testing I cohort (n = 438) and NGS-based meta-testing II cohort (n = 354) based on their sample size and platforms for further analysis. A mechanistically derived patient-level computational framework through the incorporation of statistical power and biological rationale prospectively was developed to generate a personalized gene signature (named PLPPS) in the meta-training cohort, which was rigorously validated in meta-testing I cohort and meta-testing II cohort.
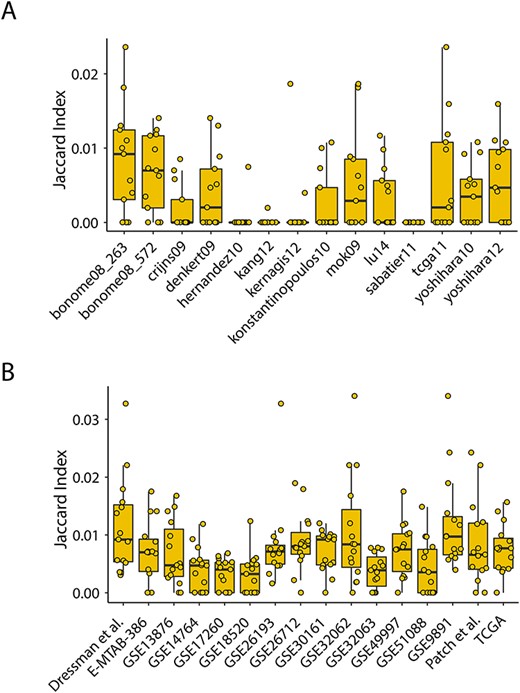
Measurement of the degree of overlap among prognostic gene sets. (A) Box plot presentations for Jaccard indices among published gene expression prognostic signatures. (B) Box plot presentations for Jaccard indices among prognostic gene sets derived from different datasets using the univariate Cox analysis.
HGSOC patient datasets enrolled in the study
| Dataset | Use | Platform | Platform type | No. of patients | Median OS (day) | Censored (%) | Ref (PMID) |
|---|---|---|---|---|---|---|---|
| GSE32062 | Meta-training | Agilent G4112F | Array | 260 | 1245 | 47 | 22 241 791 |
| GSE9891 | Meta-training | Affymetrix HG-U133 Plus 2.0 | Array | 214 | 795 | 49 | 18 698 038 |
| GSE26712 | Meta-training | Affymetrix HG-U133A | Array | 185 | 1164 | 70 | 18 593 951 |
| GSE49997 | Meta-training | ABI Human Genome Survey Microarray Version 2 | Array | 165 | 761 | 27 | 22 497 737 |
| GSE13876 | Meta-training | Operon human v3 | Array | 130 | 630 | 76 | 19 192 944 |
| E-MTAB-386 | Meta-training | Illumina HumanRef-8 v2 | Array | 128 | 889.5 | 57 | 22 348 002 |
| Dressman et al. | Meta-training | Affymetrix HG-U133A | Array | 108 | 1020 | 60 | 17 290 060 |
| GSE51088 | Meta-testing I | Agilent G4110B | Array | 93 | 1278 | 82 | 24 368 280 |
| GSE17260 | Meta-testing I | Agilent G4112F | Array | 84 | 885 | 46 | 20 300 634 |
| GSE14764 | Meta-testing I | Affymetrix HG-U133A | Array | 63 | 930 | 29 | 19 294 737 |
| GSE26193 | Meta-testing I | Affymetrix HG-U133 Plus 2.0 | Array | 61 | 1025 | 84 | 22 101 765 |
| GSE18520 | Meta-testing I | Affymetrix HG-U133 Plus 2.0 | Array | 53 | 630 | 77 | 19 962 670 |
| GSE30161 | Meta-testing I | Affymetrix HG-U133 Plus 2.0 | Array | 44 | 1010 | 70 | 22 348 014 |
| GSE32063 | Meta-testing I | Agilent G4112F | Array | 40 | 1155 | 55 | 22 241 791 |
| TCGA | Meta-testing II | Illumina HiSeq2000 | NGS | 274 | 954 | 62 | 21 720 365 |
| Patch et al. | Meta-testing II | Illumina HiSeq2000 | NGS | 80 | 805 | 81 | 26 017 449 |
Consistency evaluation of published gene expression prognostic signatures
The index-based measure (Jaccard index) defined as the size of the intersection divided by the size of the union of the gene sets was implemented to evaluate the degree of overlap between different published gene expression prognostic signatures. Correlation- and semantics-based measurements were used to assess functional similarities among different published gene expression prognostic signatures from a biological perspective. Briefly, correlation-based measurement starts with computing the correlation coefficients between individual genes based on expression levels and counts how many pairwise correlations are strong enough, as described by a previous study [21]. The semantic similarity was estimated based on the graph structure of GO using the R package ‘GOSemSim’ [22].
A permutation test was used to assess the statistical significance of functional similarities. Specifically, the observed functional similarity was calculated between two gene groups A and B, which has a size of |${N}_A$| and |${N}_B$|, respectively. Next, two gene groups with size |${N}_A$| and |${N}_B$| were randomly resampled from background for 100 times and functional similarities were calculated and re-ordered as the exact distribution. Statistical significance was estimated as the proportion of sampled permutations where the similarities were greater than or equal to the observed functional similarity.
Screening of mechanistically derived prognostic genes
In the meta-training cohort, those genes that occurred in more than two datasets were used for further analysis. Univariate Cox regression analysis was performed to assess the prognostic value of each gene in each dataset. Then, the meta-analysis was conducted to integrate the gene’s HR value from multiple datasets and evaluate their overall impact on prognosis. We assessed the heterogeneity using the Q-test and chose to conduct a random-effects model when P < 0.05, otherwise, a fixed-effects model was implemented. Next, multiple testing correction (Benjamini-Hochberg, BH) was performed, and candidate survival-related markers were identified using an adjusted P-value threshold of 0.01. Functional enrichment analysis for candidate prognostic genes was performed using the R package ‘clusterProfiler’ [23]. Candidate prognostic genes involved in significantly enriched biological processes were retained as biologically plausible prognostic genes.
Construction of a patient-level personalized prognostic signature
For a given signature |$\mathrm{G}$| of size |${\mathrm{N}}_{\mathrm{G}}$| and single sample |$\mathrm{S}$| with |$\mathrm{N}$| genes, PLPPS score is calculated as the difference between risky enrichment score |$\mathrm{ssES}\big({\mathrm{G}}_{\mathrm{risky}},\mathrm{S}\big)$| and protective enrichment score |$\mathrm{ssES}\big({\mathrm{G}}_{\mathrm{protective}},\mathrm{S}\big)$|, where |${\mathrm{G}}_{\mathrm{risky}}$|is the risky gene set with combined HR > 1 and vice versa, |$\alpha$| is an exponent, which is set to 1.5, and |$\mathrm{w}$| is an absolute value of the logarithm of combined HR for each gene, which controls the weight of rank of gene list by absolute expression (in a single sample).
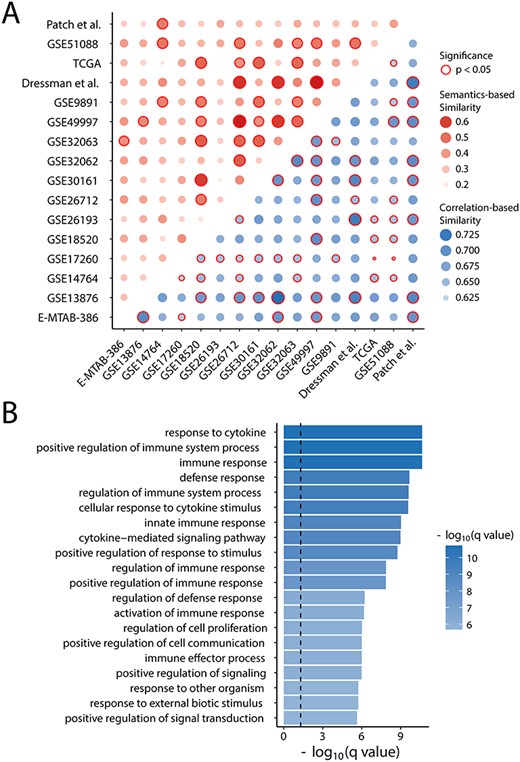
Functional evaluation of prognostic gene sets. (A) Heatmaps of semantic and expression similarities among gene expression prognostic signatures. (B) Enriched GO terms of candidate prognostic genes.
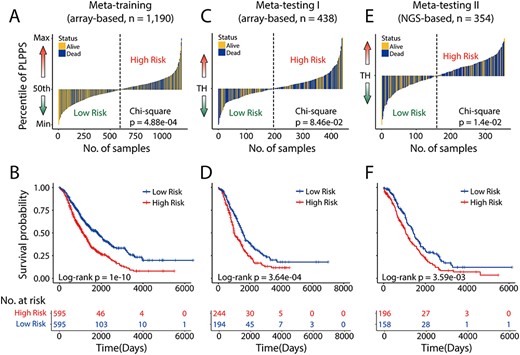
Development and external validation of the prognostic significance of the PLPPS. The score distribution and survival status of the patient ordered by increasing PLPPS risk score in (A) meta-training cohort (n = 1190), (C) meta-testing I cohort (n = 438) and (E) meta-testing II cohort (n = 354). Kaplan–Meier analysis of the PLPPS for overall survival in (B) meta-training cohort (n = 1190), (D) meta-testing I cohort (n = 438) and (F) meta-testing II cohort (n = 354). TH: threshold.
Statistical analysis
The difference of overall survival between subgroups was assessed using Kaplan–Meier estimates, and the statistical significance was assessed by the log-rank test. Univariate and multivariate Cox regression analysis was performed to measure the correlation between various factors and overall survival. Hazard ratios (HR) and 95% confidence intervals (CI) were calculated to assess the factor’s impact on prognosis. Comparative analysis of performance from diverse signatures was conducted according to HR, Harrell’s concordance index (C-index) statistic and area under the curve (AUC) of time-dependent receiver operating characteristic (ROC) curve at 3 years. All tests of statistical significance were two-sided. And all analyses were performed using custom R scripts and R/Bioconductor packages (https://www.bioconductor.org/).
Results
Consistency evaluation of published gene expression prognostic signatures
We first obtained and reproduced 14 published gene expression prognostic signatures from previous studies [13, 26] and measured the degree of overlap between each pair of prognostic gene sets using the index-based measure. As shown in Figure 2A, there is an extremely low level of Jaccard index (<0.02) for almost all 14 signatures. Indeed, four signatures (ernandez10, kang12, kernagis12 and sabatier11), which comprised less than 25 genes, have most Jaccard index of 0, indicating few or no overlaps among them. The remaining 10 signatures, which contain more than 60 genes, at most have a Jaccard index of 0.023 with other signatures (Figure 2A). These results suggested that these existing prognostic signatures for HGSOC varied in content, and there is almost no overlap between them, which makes it difficult to compare and to use in the clinically meaningful way.
Considering genes in these existing prognostic signatures derived from different platforms and statistical methods, we used a standard and consistent feature selection method to identify prognosis-related gene sets in each dataset, which is undergoing the same preprocessing strategy. Similarly, we also found that there are slightly more overlaps between each pair of above-identified prognosis-related gene sets than those between published signatures but still far from enough (Figure 2B). These findings indicated that prognostic gene signatures derived from multiple datasets have low reproducibility (have few or no overlaps with each other) due to diverse mRNA quantification platforms, various identification methods and even different laboratory conditions. As a result, it leads to difficulty in applying these prognostic gene expression signatures into clinical practice.
Further evaluation for functional association among these published gene expression prognostic signatures was performed by assessing the semantic and expression similarities among gene signatures. As shown in Figure 3A, although there were almost no overlaps between signatures in content, these signatures have significantly high expression correlation and semantic similarities (permutation test P < 0.05), indicating that there were similar biological mechanisms underlying these signatures, which may jointly participate in the same biological process and pathways.
Identification of mechanistically derived prognostic genes
Based on the above observation, we proposed a mechanistically derived computational framework to acquire comprehensive, precise and explicable prognostic genes. We first extracted the genes’ effect on prognosis in each cohort of the meta-training dataset using the univariate Cox regression analysis. A total of 17 257 genes were picked, and meta-analysis was conducted to integrate these genes’ HR values from multiple datasets to evaluate their impact on prognosis. After filtering the genes with a slight effect, 105 genes were designated as candidate prognosis-related genes.
To gain biological insights into candidate prognosis-related genes, functional enrichment analysis was performed and 43 biological processes were significantly enriched (Supplementary Table S1). Interestingly, the results of this enrichment analysis suggested that these candidate prognosis-related genes were mainly relevant to the immune-associated processes, such as immune response, response to cytosine and immune system process, as shown in Figure 3B. A total of 68 of 105 candidate prognosis-related genes were found to be involved in immune-enriched biological processes, thus were retained as final immune-derived prognostic gene markers, containing 43 risky genes with combined HR > 1, and 25 protective genes with combined HR < 1 (Supplementary Table S2).
Development of a patient-level personalized prognostic signature (PLPPS)
We then constructed a patient-level personalized prognostic signature (PLPPS) consisting of 68 immune-derived prognostic gene markers using an improved ssGSEA method, which could acquire the PLPPS score based on gene expression levels of individual sample and has beneficial impacts on clinical utility for its application as a personalized manner without the need to normalize data from various sources.
In the meta-training cohort, the PLPPS score of each patient was obtained and the median PLPPS score was used to split 1190 patients of the meta-training dataset into the high-risk group (n = 595) and low-risk group (n = 595). A chi-square test was conducted to compare the death event distribution between two risk groups and revealed that there is a significant enrichment of death event in the high-risk group (P = 4.88e-04) (Figure 4A), indicating the outstanding capability in risk stratification of HGSOC patients. Also, in terms of overall survival, Kaplan-Meier estimates of two risk groups exhibited a significant difference in overall survival (log-rank P = 1.0e-10) (Figure 4B). The median overall survival of patients in the low-risk group was longer than that of patients in the high-risk group (1830 days versus 1140 days).
External validation of the PLPPS on two large meta-testing datasets profiled by different technological platforms
The PLPPS was tested in 438 array-based samples from the meta-testing I cohort. When stratifying the patients according to the same cutoff of the meta-training cohort, 438 patients of meta-testing I cohort were classified into high-risk subgroup (n = 244) and low-risk subgroup (n = 194) with significantly different prognoses (log-rank P = 3.64e-04) (Figure 4D). As observed in the meta-training dataset, a higher PLPPS was correlated with significantly worse prognosis compared with lower PLPPS (Chi-square test P = 8.46e-02) (Figure 4C). Patients in the low-risk subgroup have a longer median survival time (1561 days) compared with high-risk subgroups (1004 days).
To test the cross-platform reproducibility of the PLPPS, the PLPPS was further applied to 354 samples of the meta-testing II cohort from the NGS-based platform. The PLPPS could stratify 354 patients into two risk subgroups using the same cutoff value derived from the meta-training dataset. As shown in Figure 4E, more deaths were observed for HGSOC patients with high PLPPS than for those with low PLPPS (Chi-square test P = 1.4e-02). The predicted high-risk group consistently had statistically significant shorter survival time (median 1058 days) compared with those in the low-risk group (median 1423 days) (log-rank P = 3.59e-03) as shown in Figure 4F.
Validation of the PLPPS as a superior and independent prognostic factor
We next performed univariate and multivariate Cox proportional hazards analysis to examine the prognostic value of the PLPPS with other clinical factors (FIGO stage and grade). In the univariate analysis, only the PLPPS was consistently significantly associated with overall survival in all three patient meta cohorts, whereas all other clinical covariates failed to show a consistent association with prognosis (Table 2). The high PLPPS was associated with poor prognosis and low PLPPS with better prognosis in the meta-training datasets and both meta-testing datasets (meta-training cohort, HR = 1.66, 95% CI = 1.42–1.95, P = 2.60e-10; meta-testing I cohort, HR = 1.54, 95% CI = 1.21–1.96, P = 4.00e-04; and meta-testing II cohort, HR = 1.47, 95% CI = 1.13–1.91, P = 3.80e-03). Furthermore, the PLPPS still remains to be the most significant prognostic factor in all three meta patient datasets after adjusting the clinical factors using multivariate analysis (high versus low PLPPS, HR = 1.97, 95% CI = 1.58–2.45, P = 1.50e-09 for the meta-training cohort; HR = 1.51; 95% CI = 1.19–1.93, P = 7.30e-04 for the meta-testing I cohort and HR = 1.5; 95% CI = 1.15–1.95, P = 2.50e-03 for the meta-testing II cohort) (Table 2).
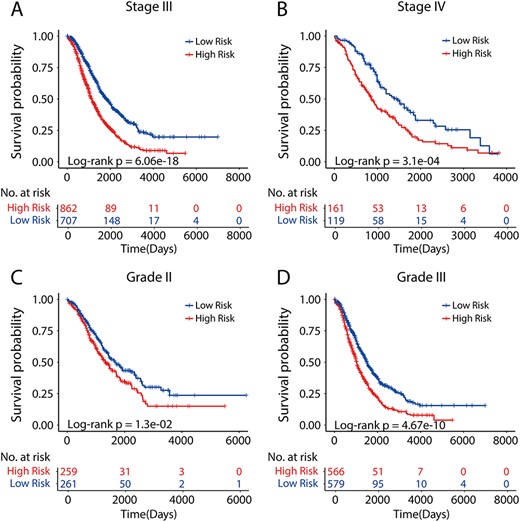
Prognostic performance of the PLPPS within clinically defined groups of patients. Patients in clinically defined groups were stratified by the PLPPS into high- and low-risk groups. Kaplan–Meier analysis of the PLPPS for overall survival in patients with stage III (A) and stage IV (B), grade 2 (C) and grade 3 (D).
Univariate and multivariate Cox regression analysis of overall survival in each patient cohort
| Variables | Univariate analysis | Multivariate analysis | ||||
|---|---|---|---|---|---|---|
| HR | 95% CI | P-value | HR | 95% CI | P-value | |
| Meta-training (array-based, n = 1190) | ||||||
| PLPPS (High versus Low) | 1.66 | 1.42–1.95 | 2.60E-10 | 1.97 | 1.58–2.45 | 1.50E-09 |
| Stage (IV versus III) | 1.46 | 1.19–1.81 | 4.00E-04 | 1.53 | 1.17–2.00 | 1.70E-03 |
| Grade (III versus II) | 1.16 | 0.96–1.41 | 1.30E-01 | 1.24 | 0.99–1.54 | 5.80E-02 |
| Meta-testing I (array-based, n = 438) | ||||||
| PLPPS score (High versus Low) | 1.54 | 1.21–1.96 | 4.00E-04 | 1.51 | 1.19–1.93 | 7.30E-04 |
| Stage (IV versus III) | 1.74 | 1.26–2.42 | 8.50E-04 | 1.7 | 1.22–2.35 | 1.60E-03 |
| Grade (III versus II) | 1.39 | 1.05–1.84 | 2.00E-02 | 1.4 | 1.06–1.85 | 1.80E-02 |
| Meta-testing II (NGS-based, n = 354) | ||||||
| PLPPS score (High versus Low) | 1.47 | 1.13–1.91 | 3.80E-03 | 1.5 | 1.15–1.95 | 2.50E-03 |
| Stage (IV versus III) | 0.87 | 0.59–1.27 | 4.70E-01 | 0.85 | 0.58–1.25 | 4.00E-01 |
| Grade (III versus II) | 1.17 | 0.80–1.72 | 4.00E-01 | 1.25 | 0.85–1.83 | 2.50E-01 |
Furthermore, given that stage and grade were also observed to be significantly related to overall survival in the meta-training cohort and meta-testing I cohort, stratification analysis was implemented to evaluate whether the PLPPS could stratify those patients in clinically defined groups. When considering all patients of stage III only, the PLPPS stratified them into two risk subgroups with significantly different prognosis (P = 6.06e-18, log-rank test) (Figure 5A). Similarly, the PLPPS still remained highly prognostic for patients with stage IV (P = 3.1e-04, log-rank test) (Figure 5B). When further restricted to patients with grade 2/3 HGSOC, the PLPPS performed very well and was able to distinguish patients with significantly different prognosis despite having the same grade (P = 1.3e-02 for grade 2 patients; and P = 4.67e-10 for grade 3 patients, log-rank test) (Figure 5C and D). Overall, these results demonstrated that the PLPPS was a superior prognostic factor for HGSOC patients and could estimate the overall survival independently of stage and grade.
Comparison of the PLPPS with other existing prognostic signatures
Finally, we compared the predictive ability of the PLPPS with 14 existing signatures for the prognosis of HGSOC patients. We first assessed the association between each signature and overall survival in each of the 16 datasets and obtained HR value using the univariate analysis. All HR values of each signature were incorporated into an overall estimation using meta-analysis. As shown in Figure 6A, although 12 of 15 signatures are significantly associated with overall survival, the PLPPS achieved the highest HR of 1.371 (95% CI = 1.291–1.456), which was 17.5% higher than the median HR value of 1.167 (range 0.972–1.34) of other existing prognostic signatures. Further, we also adopted the C-index to estimate the predictive performance of all 15 signatures for survival estimation and found that the PLPPS achieved the highest C-index of 0.604 (95% CI = 0.585–0.623), which was 9.4% higher than the median C-index value of 0.552 (range 0.495–0.592) of other existing prognostic signatures (Figure 6B). Finally, we also conducted a three-year ROC analysis for each signature in each of all 16 HGSOC datasets and obtained AUC values. All AUC values of each signature were incorporated into an overall estimation using meta-analysis. As shown in Figure 6C, the PLPPS achieved an AUC of 0.637 (95% CI = 0.61–0.664), which is 10.2% higher than other existing signatures with a median AUC value of 0.578 (range 0.48–0.62). Besides, the corresponding P-values by HR, C-index and AUC analysis were also less significant than PLPPS (Figure 6). Taken together, comparison results indicated that the PLPPS is comparable to or better than existing prognostic signatures for HGSOC patients and can give a more robust and personalized survival prediction.
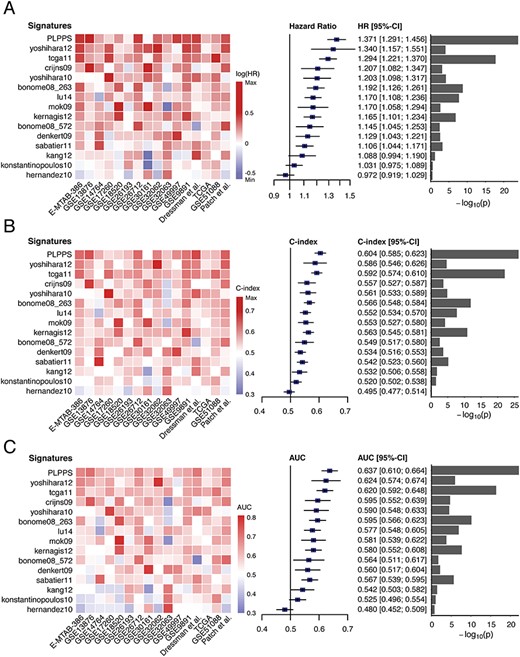
Assessment of prognostic performance of the PLPPS and published gene expression prognostic signatures. Heatmaps and forest plot of the HRs (A), C-index (B) and AUC (C) derived from meta-analysis across different datasets.
Discussion
An accurate prognosis assessment for HGSOC patients could aid in guiding clinical decision-making, including medical treatment selection and patient counseling [27]. Reliance on traditional clinical features alone in a complex clinical environment is challenging and unsatisfactory; thus, novel signatures that incorporate molecular features may need to be considered to complement the limitations of known clinical variables. In the past decades, numerous efforts had been made to improve risk stratification and had generated many gene expression prognostic signatures for HGSOC patients. Considering that these published signatures were developed in multiple studies using various methods and data sources which may lead to the diversity of gene lists of signatures, we collected a total of 1982 HGSOC patients from 16 HGSOC datasets with publicly available gene expression data and survival information, including 14 array-based datasets and 2 NGS-based datasets (Table 1). To obtain a global view of these prognostic signatures, we carried out a comparative meta-analysis for these prognostic signatures from gene and functional perspectives. Comparative results suggested that genes included in a signature are almost impossible to recurrent in other signatures, but these signatures revealed significantly high functional similarity. These observations indicated that the prognostic performances of these signatures are due largely to underlying molecular mechanisms involved in the prognosis, and many correlatives rather than causative genes were included in these signatures, thus leading to low gene reproducibility [12, 25, 28]. Based on the above observations, we conjectured that biological processes underlying carcinogenesis or hallmarks of cancer, a higher level, could provide a significant starting point to retrieve comprehensive, reliable and more explicable prognostic biomarkers for HGSOC patients.
Inspired by this hypothesis, in this study, we developed a patient-level computational framework from mechanistic and translational perspectives and revealed prognostic value and significant enrichment of immune-associated components in 1190 HGSOC patients of the meta-training cohort. Immune modulation is a well-known hallmark of cancer and played key roles during cancer initiation and progression [29]. Accumulated evidence has demonstrated that ovarian cancers are an immunogenic tumor, and various components of the immune system are relevant to prognosis, prediction of treatment response and various other pharmacodynamic parameters [30]. Potential involvement of identified prognostic genes in the immune system further highlights the significance of immune contexture in HGSOC prognosis and treatment. By selecting prognostic genes enriched in immune-related biological pathways, we produced a patient-level personalized gene signature (named PLPPS) composed of 68 immune genes with prognostic value utilizing the improved single-sample gene set enrichment method. As opposed to these existing signatures where samples were pre-collected for normalization in advance which is unsuitable for individualized clinical prognosis application [18, 19], the PLPPS generated an individual-level risk score for survival estimate using the pairwise comparison of enrichment score between protective and risk prognostic immune genes within a single sample which eliminated the need for the pre-collection of samples for data normalization.
To overcome the limitations of small sample size and technical biases inherent across different platforms, we carried out data merging, which combined the expression data of 1982 HGSOC patients from 16 HGSOC datasets into three meta cohorts based on their sample size and platforms before any analysis. We carefully evaluated the reproducibility of the PLPPS by transposing it from the meta-training cohort to two validation meta cohorts with microarray or RNA-Seq technologies. All validation cohorts demonstrated the strong prognostic performance of the PLPPS, indicating the cross-platform compatibility and feasibility of the PLPPS as a genomic tool for the individualized and single sample estimation of prognosis.
With further validation in terms of traditional clinical parameters, we performed univariate and multivariate Cox regression analysis on the individual clinical parameters with and without the PLPPS independently for each meta cohort. Consistently, the PLPPS was shown to be the better prognostic factor compared with clinical parameters in the univariate analysis and retained a significant independent association with prognosis after adjusting for clinical parameters in the multivariate analysis, not only in the meta-training cohort but also in two additional validation cohorts. Furthermore, the PLPPS may further stratify clinically defined groups of patients (e.g., stage III and IV, grade 2 and 3) into different risk subgroups with significantly different prognosis, suggesting that the PLPPS could complement the prognostic value of the TNM staging system. When the PLPPS was challenged against previously published gene signatures in benchmark comparisons, although most of the previously published gene signatures confirmed their value in survival prediction, the PLPPS demonstrated more effective and robust prognostic performance with the highest HR, C-index and AUC compared with other published gene signatures.
In conclusion, by using a patient-level computational framework from mechanistic and translational perspectives, the present study generated a personalized gene signature (named PLPPS) composed of 68 immune genes, which were rigorously validated in multiple cross-platform independent cohorts. With further validation in prospective clinical trials, we hope that the PLPPS might become a promising genomic tool to guide personalized management and decision-making of HGSOC in clinical practice.
Ethics approval and consent to participate
Not applicable.
Consent for publication
Not applicable.
Competing interests
The authors have declared no conflicts of interest.
Data availability
The detailed information of patient datasets used in this study is provided in Table 1. All data and R scripts used to generate the findings in this study have been deposited on GitHub (https://github.com/AlisaGU/PLPPS-pipeline).
Authors’ contributions
JS and MZ designed the study; MZ and HQZ developed the methodology; HQZ, SSG, SQB, CCY, ZCZ and PH performed data analysis. MZ and JS drafted the manuscript. All authors read and approved the final manuscript.
A patient-level computational framework was proposed to establish a personalized prognostic indicator in precision medicine.
The PLPPS comprised of 68 immune genes was generated in HGSOC as a case study and rigorously validated for prognostic risk stratification in multiple cross-platform independent cohorts.
The PLPPS was shown to be the better prognostic factor compared with clinical parameters in the univariate analysis and retained a significant independent association with prognosis after adjusting for clinical parameters in the multivariate analysis.
The PLPPS demonstrated more effective and robust prognostic performance than other published gene signatures in benchmark comparisons.
Acknowledgments
Not applicable.
Funding
This study was supported by the National Natural Science Foundation of China (Grant No. 61973240) and the Scientific Research Foundation for talents of Wenzhou Medical University (QTJ18029, QTJ18023, and QTJ18024). The funders had no roles in study design, data collection and analysis, decision to publish or preparation of the manuscript.
Hengqiang Zhao is a Ph.D. student at the School of Biomedical Engineering, Wenzhou Medical University, and the Peking Union Medical College Hospital, Peking Union Medical College and Chinese Academy of Medical Sciences. His research interests include bioinformatics and disease systems biology.
Shanshan Gu is a student at the School of Biomedical Engineering, Wenzhou Medical University. Her research interests include bioinformatics and translational medicine.
Siqi Bao is a graduate student at the School of Biomedical Engineering, Wenzhou Medical University. Her research interests include bioinformatics and translational medicine.
Congcong Yan is a graduate student at the School of Biomedical Engineering, Wenzhou Medical University. Her research interests include bioinformatics and disease systems biology.
Zicheng Zhang is a graduate student at the School of Biomedical Engineering, Wenzhou Medical University. His research interests include bioinformatics and immunoinformatics.
Ping Hou is a graduate student at the School of Biomedical Engineering, Wenzhou Medical University. Her research interests include bioinformatics and cancer epigenetics.
Meng Zhou is an associate professor at the School of Biomedical Engineering, Wenzhou Medical University. His research interests include bioinformatics and computational precision medicine.
Jie Sun is an associate professor at the School of Biomedical Engineering, Wenzhou Medical University. Her research interests include cancer bioinformatics and translational medicine.
Reference
Author notes
Hengqiang Zhao, Shanshan Gu contributed equally to this work.
