


Abstract
Effective drugs are urgently needed to overcome human complex diseases. However, the research and development of novel drug would take long time and cost much money. Traditional drug discovery follows the rule of one drug-one target, while some studies have demonstrated that drugs generally perform their task by affecting related pathway rather than targeting single target. Thus, the new strategy of drug discovery, namely pathway-based drug discovery, have been proposed. Obviously, identifying associations between drugs and pathways plays a key role in the development of pathway-based drug discovery. Revealing the drug-pathway associations by experiment methods would take much time and cost. Therefore, some computational models were established to predict potential drug-pathway associations. In this review, we first introduced the background of drug and the concept of drug-pathway associations. Then, some publicly accessible databases and web servers about drug-pathway associations were listed. Next, we summarized some state-of-the-art computational methods in the past years for inferring drug-pathway associations and divided these methods into three classes, namely Bayesian spare factor-based, matrix decomposition-based and other machine learning methods. In addition, we introduced several evaluation strategies to estimate the predictive performance of various computational models. In the end, we discussed the advantages and limitations of existing computational methods and provided some suggestions about the future directions of the data collection and the calculation models development.
Drug discovery
From 2009 to 2018, the US Food and Drug Administration (FDA) approved only 356 new drugs [1]. The research and development of drug is still time consuming and laborious. It was estimated that the average financial and time costs for large pharmaceutical companies to bring a new drug to market are approximately $1.8 billion and a decade [2, 3]. The high-cost drug development process lead to the high price of many drugs. For example, in the USA, the average price of a new anticancer drug usually exceeds $100,000 per course of treatment [4]. Many patients in developing country cannot afford the expensive cost of these drugs and the expensive cost may be the single most common reason for drug discontinuation [5]. On the one hand, great progress has been made in the science and technology of drug research and development over the past 70 years. For example, since the first genomic sequences was determined in the 1970s, the speed of DNA sequencing has increased by more than one billion times [6–8]. In the field of cancer treatment, DNA sequencing can identify oncogenes and tumor suppressor genes, which is benefit for the design of drug-targeted treatment [9]. Besides, during the 1980s and 1990s, combinatorial chemistry increased the number of drug-like molecules that chemist could synthesize each year by a factor of about 800 [10, 11]. On the other hand, the number of drugs approved by FDA per billion US dollars cost has been reduced by about half every nine years since 1950 [8]. Thus, it is very significant to improve the efficiency of drug discovery.
Drug-pathway associations
Traditional drug discovery generally follows the approach of one drug-one target [12]. However, the pathological process of complex disease usually involved extremely complex interactions between numerous functionally related biomolecules within certain disease-related pathways [13]. Besides, drugs usually work by affecting the related pathway rather than just targeting single target [14]. Actually, many biological experiments have demonstrated various associations between drugs and pathways [15–17]. For example, in previous study, a patient with medulloblastoma was treated by the drug of GDC-0449 and the experimental result demonstrated that GDC-0449 can inhibit hedgehog pathway and further make the tumor rapidly regress [18]. In addition, Wilhelm et al. [19] carried a series of out tumor xenograft experiments for mice. The experimental results demonstrated that the drug of BAY 43–9006 is a novel inhibitor of RAF kinases which function in RAF/MEK/ERK Pathway, and thus inhibits tumor cell proliferation and tumor angiogenesis [19]. Moreover, Speciale et al. [20] found that Cyanidin-3-Oglucoside could protect vascular system against various stressors through activating Nrf2 pathway.
Drug-pathway association means that the drug can affect the pathway by influencing the expression of genes in pathways through targeting one or more genes. Besides, drug-pathway associations could be divided into two classes, namely positive correlation and negative correlation, based on whether drugs activate or inhibit pathways through the mechanisms of increasing or reducing the expression of genes in pathways. Drug-pathway associations can provide more physiological or functional information for discovering the chemical compounds utilized to treat complex diseases [21]. Therefore, identifying drug-pathway associations is an important task to accelerate the drug discovery and development. Several databases collected some known drug-pathway associations discovered by biological experiments, such as Comparative Toxicogenomics Database (CTD) [22], CancerResource [23] and Kyoto Encyclopedia of Genes and Genomes (KEGG) Pathway [24]. However, the number of known drug-pathway associations are too less. Besides, finding drug-pathway associations by experimental methods is time consuming and laborious. As the development of experimental technologies of genomics, proteomics and metabolomics [25], the data of drug sensitivity profiles and high-throughput transcription are easy to get [26–28]. These data provide valuable information for discovering drug-pathway associations. Thus, establishing effective calculation methods to mining useful information for inferring potential drug-pathway associations is an important mission. Reliable inferred results would contribute to experimental validation and save labor as well as financial resources.
Databases and web servers
Databases or web servers about drug and pathway are essential for drug-pathway association prediction. Researchers can utilize these databases or web servers to collect drug and pathway-related information for computational model construction. We listed and introduced some important databases and web serves which may be useful for drug-pathway association prediction (See Table 1). Among them, Therapeutic Target Database (TTD) [29], CTD, CancerResource and KEGG Pathway include drug-pathway association information.
List of databases and web serves
| Database or web sever | Function | URL |
|---|---|---|
| DrugBank | Provide drug, drug interaction, drug action and drug-target information | http://www.drugbank.ca/ |
| CTD | Provide high-throughput predicted associations between chemicals and pathways | http://ctd.mdibl.org/ |
| CMap | Provide gene expression data of five human cancer cell lines both before and after the treatments of bioactive small molecules | https://portals.broadinstitute.org/cmap/ |
| CancerResource | Provide drug-related information and low-throughput validated drug-pathway associations | http://bioinformatics.charite.de/care |
| CellMiner | Provide gene expression data and drug sensitivity data of cancer cell lines | http://discover.nci.nih.gov/cellminer |
| CancerDR | Provide pharmacological profiling data of drugs across different cancer cell lines | http://crdd.osdd.net/raghava/cancerdr/ |
| ChemBank | Provide molecular descriptors and compound information | http://chembank.broadinstitute.org/ |
| ChEMBL | Provide the assessment of distribution, in vivo absorption, metabolism, toxicity and excretion properties information for great number of drug-like bioactive compounds | https://www.ebi.ac.uk/chembldb |
| TTD | Provide comprehensive information of the clinical trial drugs and drug-pathway associations | http://bidd.nus.edu.sg/group/ttd/ttd.asp |
| KEGG pathway | Provide some low-throughput validated drug-pathway associations | https://www.genome.jp/kegg/pathway.html |
| Pathway Commons | Provide the biological pathway data collected from multiple organism | http://www.pathwaycommons.org/ |
DrugBank
DrugBank is a comprehensive, freely available database including detailed drug, drug interaction, drug action and drug-target information about FDA-approved drugs [30]. This information could be used to calculate drug similarity or construct drug feature vector in the process of drug-pathway association prediction. Up to now, this database has been updated to DrugBank 5.0 version [30]. There are total 2385 approved (FDA, Health Canada, EMA, etc.) drugs.
CTD
CTD is a public database that provides curated interactions between chemicals, genes, phenotypes, environmental exposures and diseases [22]. It also contains a list of pathways that are statistically enriched among the genes that interact with an invested chemical. The files about chemical-pathway enriched associations can be downloaded from the website of http://ctdbase.org/downloads/#chempathwaysenriched. These associations between chemicals and pathways are high-throughput predicted by computing the significance of enrichment between pathways and the genes that interact with a chemical through the hypergeometric distribution. Researchers can employ these associations as validation information for drug-pathway association prediction models. However, the type and mechanism of chemical-pathway enriched associations are unknown due to the fact that they are only predicted associations.
Connectivity map (CMap)
(https://portals.broadinstitute.org/cmap/)
CMap is a project that provides a collection of genome-wide transcriptional expression data from five human cancer cell lines both before and after the treatments of bioactive small molecules [31]. There are 7056 Affymetrix microarrays, in which 6100 arrays are obtained from cell lines treated by small molecules and the rest are control samples. The microarray data can be obtained from http://www.broadinstitute.org/cmap/cel_file_chunks.jsp. The genes expression data both before and after small molecules’ treatments can be used to analyze associations between small molecule drugs and pathways. In fact, some previous study has employed this data to predict potential drug-pathway associations [32].
CancerResource
(http://bioinformatics.charite.de/care)
CancerResource is a freely available database without registration. It includes more than 2000 cancer cell lines and drug sensitivity data under the treatment with about 50,000 drugs as well as 91,000 drug-target interactions [23]. The drug related data would contribute to mining drug related information in the problem of drug-pathway association prediction. In addition, compounds and target genes are projected onto cancer-associated pathways to better understand how drug-target interactions are beneficial for cancer treatment. Thus, CancerResource contains some cancer related pathway-drug associations which are low-throughput validated. There are both positive correlation and negative correlation types in these associations. Actually, CancerResource has been used to validate predicted drug-pathway associations in previous study [33].
CellMiner
(http://discover.nci.nih.gov/cellminer)
CellMiner is the first online database resource which integrates the data of molecular profile based on 60 diverse human cancer cell lines (the NCI-60) [34]. The data contains RNA expression, DNA methylation, DNA fingerprinting, sequence mutation, as well as treatment response to more than 100,000 compounds. The gene expression data and drug sensitivity data of cancer cell lines in CellMiner can be utilized to predict potential drug-pathway associations [35].
Cancer drug resistance database (CancerDR)
(http://crdd.osdd.net/raghava/cancerdr/)
It is important to know which drug is effective for a particular cancer type. The database of CancerDR provides the pharmacological profiling data involving 952 cancer cell lines and 148 anti-cancer drugs in which the number of FDA approved drugs, clinical trials drugs and experimental drugs are 36, 48 and 64, respectively [36]. The pharmacological profiling data may be useful for inferring associations between drugs and cancer related pathways.
ChemBank
(http://chembank.broadinstitute.org/)
ChemBank is a public database including freely available data derived from small molecules and small-molecule screens [37]. The ChemBank database is made up of 95 tables divided into seven logical parts representing molecular descriptors, compound information, assay results, assay metadata, ontological association, biological finding and user information. During the data collection phase of drug-pathway association prediction, researchers can search small molecule drug-related information from the ChemBank database to calculate the similarity of small molecule drugs or characterize small molecule characteristics.
ChEMBL
(https://www.ebi.ac.uk/chembldb)
The open database of ChEMBL provides the assessment of distribution, in vivo absorption, metabolism, toxicity and excretion properties information for great number of drug-like bioactive compounds [38]. Currently, the database collects 5.4 million bioactivity measurements for more than 1 million compounds from the primary published literature. ChEMBL contains abundant information about drug-like bioactive compounds, which could provide the important guarantee for potential drug-pathway association prediction.
TTD
(http://bidd.nus.edu.sg/group/ttd/ttd.asp)
TTD is a useful database for facilitating the drug discovery [29]. The database provided comprehensive information of the clinical trial drugs and their targets based on extensive drug discovery efforts. Besides, TTD database contained known low-throughput validated drug-pathway associations which can be used for drug-pathway prediction. Among the drug-pathway associations, there are both positive correlation and negative correlation types.
KEGG Pathway
(https://www.genome.jp/kegg/pathway.html)
KEGG Pathway database is the main database in KEGG [24]. The database contains manually drawn KEGG reference pathway and organism-specific pathway maps. There were 496 manually drawn KEGG reference pathways, which were divided into six categories. Besides, each pathway has a brief summary of the biological processes shown in the pathway map and the drugs would be listed if the pathway has associated drugs. In this database, if pathway contains drug targets, this pathway is considered to be associated with the drug. Thus, KEGG pathway database is widely used in many calculation models [33, 35, 39] for drug-pathway association prediction since it can provide some low-throughput validated drug-pathway associations. Besides, there are both positive correlation and negative correlation types in these associations.
List of different types of computational methods
| Model type | Model names | Model feature |
|---|---|---|
| Bayesian spare factor-based models | iFad and FacPad | Drug-pathway association prediction problem was described by linear model and collapsed Gibbs sampling algorithm was employed for the Bayesian inference. |
| Matrix decomposition-based models | iPaD, L2,1-iPaD, L1L2,1-iPaD and IGMF | Both drug sensitivity and gene expression data were decomposed and drug-pathway association prediction problem was transformed as regularized optimization problem. |
| Other machine learning-based models | Drug-pathway association prediction via multiple feature fusion, RGRF, LSA-PU-KNN and Pathway-based LDA | Different kinds of data were integrated as features to represent drug and pathway and different classifiers were utilized to train prediction model based on training samples. |
Pathway Commons
(http://www.pathwaycommons.org/)
Pathway Commons is a web resource providing the biological pathway data collected from multiple organisms [40]. The data include transport and catalysis events, complex assembly, biochemical reactions and physical interactions involving DNA, RNA, proteins, small molecules and complexes. There were over 1400 pathways and 687,000 interactions. Researchers could search pathway related information from Pathway Commons during the data collection phase of drug-pathway association prediction.
Computational Models
Since the idea of one drug-one target limits the research and development of new drug, pathway-based strategy of drug discovery received the attention of researchers. On the one hand, seeking drug-pathway associations by biological experiments is time-consuming and laborious. On the other hand, biological experiments and next-generation sequencing have accumulated a mass of data, such as gene expression profiles, drug sensitivity profiles, drug-pathway associations and so on. Thus, some computational models were developed to infer potential drug-pathway associations based on biological data about drugs and pathways. In this section, we will introduce these prediction models.
A series of machine learning algorithms have been employed to identify potential associations between drugs and pathways. These algorithms can be further divided into Bayesian spare factor-based, matrix decomposition-based and other machine learning methods (See Table 2). In both Bayesian spare factor-based and matrix decomposition-based methods, the data of gene transcription profiles or drug sensitivity profiles of different human cell lines or both were utilized to infer drug-pathway associations. In Bayesian spare factor-based methods, association prediction problem was described by linear model, while matrix decomposition-based methods usually transformed the problem as regularized optimization models. Besides, in other machine learning based models, different kinds of data, such as drug chemical structure, pathway-related genes expression and known drug-pathway associations were integrated as features to represent drug and pathway. Then, different classifiers can be utilized to train prediction model based on training samples. In the following, we would introduce these three classes of machine learning-based methods for drug-pathway association prediction.
Bayesian spare factor-based models
iFad
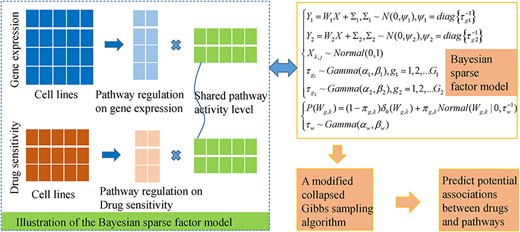
The flowchart of a Bayesian sparse factor analysis model of iFad to infer potential drug-pathway associations by analyzing the gene expression and drug sensitivity datasets measured under different human cancer cell lines.
FacPad
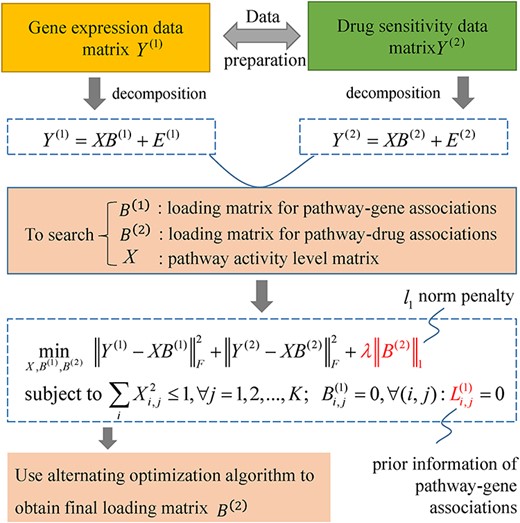
The flowchart of iPaD for inferring drug-pathway associations using the data of gene transcription and drug sensitivity profiles of human cell lines.
Matrix decomposition-based models
iPaD
L2,1-iPaD
L1L2,1-iPaD
IGMF
Other machine learning-based models
Drug-pathway association prediction via multiple feature fusion
Song et al. [45] predicted drug-pathway associations via multiple feature fusion (See Figure 3). In their study, the drug features are divided into drug chemical structure similarity features and molecular functional-groups features. Besides, the pathway features are divided into expression level features of pathway related genes, expression variation features of pathway related genes and pathway similarity features based on pathway-related genes. Moreover, three different machine learning methods including the Gaussian Interaction Profiles (GIP) kernels method, Bipartite Local Models method (BLM) and Graph-based Semi-Supervised Learning method (GBSSL) are utilized to infer drug-pathway associations, respectively. We introduced the details of these three algorithms as follows.
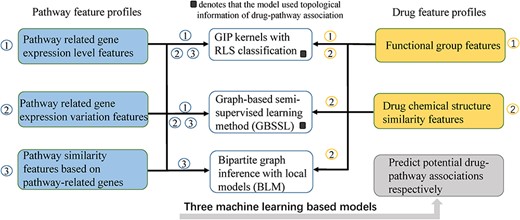
The flowchart of drug-pathway association prediction via multiple feature fusion.
GIP kernels with RLS classification
Graph-based semi-supervised learning method (GBSSL)
Finally, The final prediction result can be denoted by the matrix |${F}^{\ast }$| and |${F}^{\ast }={(I-\alpha S)}^{-1}Y$|.
Bipartite local models method (BLM)
BLM, utilized to infer drug-pathway associations [45], is a supervised method [47, 48]. Firstly, for each given drug, the local classifier of Support Vector Machine (SVM) was employed to predict drug-associated pathways. Then, for each pathway, SVM was also utilized to predict pathway-associated drugs. Finally, each drug-pathway pair obtained two prediction scores and the maximum was selected to denote the prediction score of this drug-pathway pair. In this model the drug chemical structure similarity matrix |${S}_d$| and the pathway similarity matrix |${S}_p$| based on pathway-related genes were used to denote drugs and pathways, respectively. Different from GIP kernels method and GBSSL, the topological information of drug-pathway association is not utilized as feature profile in this model.
Above three prediction models used different feature profiles to predict drug-pathway associations. One limitation of these methods is that all the pathways or drugs must have known associations.
RGRF
Song et al. [49] developed an improved Rotation Forest named RGRF (Relief and GBSSL-based Rotation Forest) to infer potential associations between compounds and pathways (See Figure 4). Rotation Forest algorithm is an ensemble learning method by integrating multiple independently trained classifiers based on decision tree. Rotation Forest algorithm mainly includes two parts. The first part is feature extraction. The feature set is randomly split into n subset and then the Principal Component Analysis (PCA) method is utilized to extract features for each subset. Then, the new features of n subsets are combined to establish new feature set. The second part is constructing classifiers. In Rotation Forest, the base classifier is decision tree. RGRF algorithm improved Rotation Forest in two points as follows. Firstly, Relief method [50], widely employed as a feature-weighting algorithm based on instance learning, was selected to replace PCA method as the projection filter. Secondly, considering semi-supervised method generally obtained better performance compared with supervised method when working on the dataset in which unlabeled samples are far more than labeled samples, they employed GBSSL instead of decision trees as the base classifier [51]. In present study, they integrated drug chemical structure similarity, drug mode of active similarity and genomic-based similarity of pathway as features to denote compound-pathway pairs. However, the information about pathways is not abundant yet.
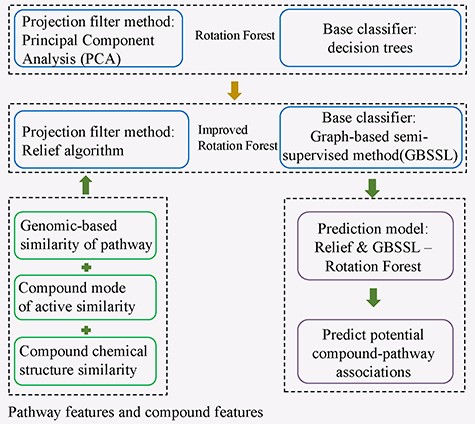
The flowchart of an improved Rotation Forest ensemble learning method of RGRF to infer potential associations between compounds and pathways.
LSA-PU-KNN
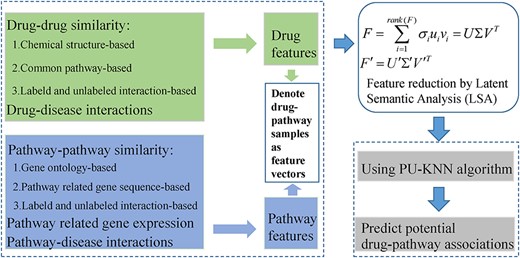
The flowchart of a disease-combined LSA-PU-KNN framework to predict potential drug-pathway associations.
Pathway-based LDA
Methods of algorithm evaluation
Effective calculation models would provide reliable predictive results for further experimental validation, which would accelerate the progress of identification of drug-pathway associations and further promote pathway-based drug research and development. Therefore, evaluating the predictive performance of different algorithms is necessary. In this section, we introduced several methods of algorithm evaluation.
Permutation Test
Recall enhancement
It is worth noting that the true positive associations mean that they are validated by known database or experimental literature. We expect that |$FE\_T{P}_k$| is lager and |$FE\_F{P}_k$| is small.
K-fold cross validation
Discussion and conclusion
The progress of drug research and development provides security for the treatment of human diseases. Many complex diseases have been overcome after discovering novel effective drugs. Different from new drug development, some researchers proposed the idea of drug repositioning. They expect to mine the novel applications of old drugs and realize the treatment for new disease using these old drugs, which can provide new treatment strategy for human diseases to some extent. However, there are many complex diseases especially cancer lacking of effective drugs and therapeutic schedule. Moreover, most of chemotherapy drugs have various side effects. Therefore, in order to overcome the trouble mentioned above, the research and development of novel drug is still necessary. However, progress in the drug development is relatively slow. Traditional drug discovery usually follows the strategy of one drug-one target. Recently, more and more scholars are paying attention to the importance of pathways in drug discovery since many studies have demonstrated the associations between drugs and pathways. The pathway-based drug discovery provides a new idea for the research and development of drug, but exploring the associations between drugs and pathways is time consuming and expensive by biological experiments. Actually, there are various type of data about drugs and pathway accumulated in the process of research of drugs and pathways, such as known drug-pathway associations, drug sensitivity profile, pathway related gene expression information and so on. Thus, effective computational methods are expected to predict new drug-pathway association using these accumulated data.
In this article, we first introduced the status of drugs and drug research and development. Then, we described the relationship between drug and pathway, because pathways play an important role in drug discovery. Next, we listed some databases and web servers about drugs and drug-pathway associations for the convenience of researchers. In addition, we described some state-of-the-art computational methods for drug-pathway association inferring and divided them into several classes, namely matrix decomposition-based methods, Bayesian sparse factor-based methods and other machine learning-based methods. Finally, we introduced several evaluation methods for estimating the predictive performance of prediction models. In the following, we will summarize the advantages and the limitations of these computational methods and provide an outlook about the future development of drug-pathway association prediction and identification.
Two Bayesian spare factor-based models for drug-pathway association prediction introduced in this review have a common idea that drug-pathway associations can be predicted by searching the latent factor. With this idea, two statistical frameworks were established and a modified collapsed Gibbs sampling algorithm was employed for the Bayesian inference. Some advantages contribute to their predictive performance. The first advantage of Bayesian spare factor-based model is that the model can analyze both single type of data and multiple types of data. Secondly, a Bayesian framework could integrate the prior pathway knowledge into the model, such as known gene-pathway associations and drug-pathway associations. Finally, Bayesian spare factor-based models explicitly consider the sparse nature of the drug-pathway associations. On the other hand, there are also some limitations in the Bayesian factor-based models. First, a larger number of parameters need to be estimated. Second, the Bayesian factor-based models require relatively good computational resource.
Four matrix decomposition-based methods introduced in this review jointly analyze drug sensitivity and gene expression data to infer drug-pathway associations. The first advantage of the matrix decomposition-based methods is that they could mine the shared latent factor of various kinds of biological data and further identify the potential associations between drugs and pathways. Thus, matrix decomposition-based method may be an appropriate choice with increasing high throughput data. Besides, they transformed the problem of matrix decomposition into an optimization problem and introduced different penalty term. The optimization problem can be solved by scalable bi-convex optimization algorithm, which greatly improve the computational efficiency of the model. Another advantage of these matrix decomposition-based methods is that there are only one or two parameters in the models. Thus, parameter selection is relatively easy. On the contrary, there are also some limitations in these matrix decomposition-based methods. First, the purpose of the several methods is to seek out the loading matrix for drug-pathway associations. If the element in the loading matrix is nonzero, the corresponding drug-pathway pair is considered as associated pair. Besides, the more important elements are considered to become non-zeros earlier than the less important ones when updating loading matrix by alternating optimization algorithm. However, the loading matrix could not reflect the associated probability of drug-pathway pairs. Second, there are only few differences among the existing matrix decomposition-based methods for drug-pathway association prediction. To be specific, the iPaD takes the L1-norm penalty on the regularization term, while the L2,1-iPaD uses the L2,1-norm penalty to replace of L1-norm penalty. Besides, the L1L2,1-iPaD utilizes the sum of L1-norm penalty and L2,1-norm penalty as the regularization term. Moreover, IGMF employs L1-norm penalty together with graph regularization. Finally, the several matrix decomposition-based models do not use the prior information about drug-pathway associations when they were used to predict potential drug-pathway associations based on the CCLE dataset, which may reduce the predictive accuracy to some extent. In the future, more and more drug-pathway associations will be discovered, so making full use the prior information of drug-pathway associations is important for prediction models.
As for other machine learning-based models, multiple feature data and known drug-pathway associations are used to train prediction model. Various types of data of drugs and pathways, such as drug chemical structure, drug functional groups, pathway related gene expression profile and so on, can be processed and integrated as features to represent drug-pathway samples as feature vectors. Thus, making full use of different kinds of data is an advantage of these machine learning-based models. Besides, effective feature reduction or selection methods, such as Relief and LSA methods mentioned above, would benefit for distinguishing associated drug-pathway pairs form unassociated pairs. Of course, there are also some limitations in these machine learning-based models. First, the parameters are hard to select. Second, prediction bias may be produced in these models since some drugs (or pathways) have more associated pathways (or drugs). Third, in the supervised machine learning model, for example BLM, both positive samples (associated drug-pathway pairs) and negative samples (unassociated drug-pathway pairs) are necessary to construct the training sample set. However, it is difficult to obtain negative samples since unassociated drug-pathway pairs are hard to collect. Actually, the real data about drug-pathway pairs consist of known associated drug-pathway pair and unlabeled drug-pathway pairs. In addition, the number of known associated pairs is far less than the number unlabeled pairs. Dealing with the class-imbalance samples, semi-supervised machine learning method, such as GBSSL, shows better performance than supervised method. Besides, semi-supervised methods don’t need negative samples. In addition, different machine learning algorithms have their own advantages and disadvantages and single classifier may not perform well. Therefore, we could take the idea of ensemble learning by integrating multiple types of classifiers to construct prediction model. In addition, it is important to select appropriate machine learning algorithm to establish classifier when facing different datasets.
Since pathway-based drug discovery would be a valuable strategy to design novel drugs for overcoming complex diseases, the researchers tried to utilize both experimental and computational methods to replenish the knowledge base about drugs, pathways and drug-pathway associations. As we know, biological experiment is convincing in revealing the mechanisms of drugs and pathways as well as drug-pathway associations. However, biological experiments take much time and cost. Thus, some computational methods were proposed to infer potential drug-pathway associations. However, the number of current computational methods is far from enough and more effective calculation models are expected. When using calculation method to predict drug-pathway associations, the data collection and processing is an important step. Nowadays, the data of drugs is relatively sufficient. However, the data of pathways is insufficient. Thus, some computational methods only use the pathway related gene expression data. From this perspective, more work should be devoted to collect useful data about pathways in the future. Besides, network based methods have been successfully utilized in many fields such as miRNA-disease association prediction [59–62], small molecule-miRNA association identification [63–66], drug-target interaction prediction [67, 68], long non-coding RNA-disease association prediction [58, 69, 70] and so on. Random walk or various propagation algorithms [71, 72] are employed in the problem of association prediction. With the development of experimental technology in the research of drugs and pathways, more and more data would be accumulated. Network-based method could make full use of different kinds of data to construct heterogeneous network and further efficiently predict potential associations, which would improve the predictive accuracy. Currently, there are hardly no network-based method proposed to identify drug-pathway associations. Therefore, it should arouse our attention to consider how to establish drug-pathway heterogeneous network and develop effective network based algorithms for drug-pathway association prediction in the future.
What’s more, the goal of calculation models is inferring reliable drug-pathway associations for further experimental validation. Thus, the predictive algorithms should be packaged into auxiliary tools for the convenience of biologists. We believe that combination of experimental and computational approaches would promote the development of drug-pathway association identification and pathway-based drug discovery. Drug-pathway association prediction plays an important role in the drug research and development. Besides, there is a close relationship between drug-pathway association prediction, drug-target interaction prediction and drug response prediction. Firstly, the drug-target interaction prediction and drug-pathway association prediction by computational methods could accelerate the progress of drug research and development which provides security for the treatment of human diseases, while drug response prediction could promote the development of precision therapy since it can predict drug response for different patients by analyzing individual genomic signatures or other features. Therefore, drug-pathway association prediction, drug-target interaction prediction and drug response prediction can all promote the advancement of human medical health. Secondly, drug-target interaction prediction is benefit for drug-pathway association prediction. Besides, both drug-target interaction prediction and drug-pathway association prediction are useful for drug response prediction. Actually, some other significant studies also contributed to the drug research and development. For example, adverse drug reactions (ADRs) lead to the failure of many drug candidates. Thus, investigating associations between pathways and ADRs is crucial and some methods had been proposed to explore ADR-pathway associations [73, 74]. Therefore, pathway-ADR association inferring can be a future direction for the pathway-based drug discovery. Besides, drug repositioning is also a hot topic in the field of drug research. In previous study [75], researchers constructed the hybrid network using gene-centric and drug-centric data under given pathological context, respectively. They utilized a calculation model of NetWalk to score drugs based on gene-centric data or do a reverse analysis to score genes and pathways. The scores can reflect the association between drug (gene or pathway) and the given pathological context. In this way, they could find the potential drugs as well as novel drug targets for different pathological contexts. Thus, how to use drug-pathway associations to solve the problem of drug reposition is also an important research direction in the future. Finally, drug combination is a promising strategy for overcoming drug resistance and treating complex diseases. In previous study, Chen et al. [76] developed a calculation method named as NLLSS for inferring potential synergistic drug combinations through integrating the information of drug chemical structures, known synergistic drug combinations as well as drug-target interactions. As mentioned in the drug-pathway association section, pathways play an important role in many complex diseases and closely associated with drugs. Therefore, it would be a future direction for synergistic drug combination prediction by introducing the information of drug-pathway associations.
The pathway-based drug discovery provides a new strategy for the research and development of drug.
Identifying drug-pathway associations is a key step in the pathway-based drug discovery.
We introduced some publicly accessible databases and web servers about drug and drug-pathway association.
Computational models have proposed to predict potential drug-pathway associations for further experimental validation, which can save much time and cost.
Computational models were divided into three classes, namely matrix decomposition-based, Bayesian sparse factor-based and other machine learning-based model.
We introduced several methods of algorithm evaluation to estimate the predictive performance of calculation models.
The advantages and limitations of computational models were discussed.
Funding
XC was supported by National Natural Science Foundation of China under Grant No. 61972399.
Chun-Chun Wang is a PhD student of School of Information and Control Engineering, China University of Mining and Technology. His research interests include bioinformatics, complex network algorithm, and machine learning.
Yan Zhao is a PhD student of School of Information and Control Engineering, China University of Mining and Technology. His research interests include bioinformatics, complex network algorithm, and machine learning.
Xing Chen, PhD, is a professor of School of Information and Control Engineering, China University of Mining and Technology. He is also the Founding Director of Institute of Bioinformatics, China University of Mining and Technology. His research interests include bioinformatics, complex network algorithm, and machine learning.
