


Abstract
Advances in sequencing technologies facilitate personalized disease-risk profiling and clinical diagnosis. In recent years, some great progress has been made in noninvasive diagnoses based on cell-free DNAs (cfDNAs). It exploits the fact that dead cells release DNA fragments into the circulation, and some DNA fragments carry information that indicates their tissues-of-origin (TOOs). Based on the signals used for identifying the TOOs of cfDNAs, the existing methods can be classified into three categories: cfDNA mutation-based methods, methylation pattern-based methods and cfDNA fragmentation pattern-based methods. In cfDNA mutation-based methods, the SNP information or the detected mutations in driven genes of certain diseases are employed to identify the TOOs of cfDNAs. Methylation pattern-based methods are developed to identify the TOOs of cfDNAs based on the tissue-specific methylation patterns. In cfDNA fragmentation pattern-based methods, cfDNA fragmentation patterns, such as nucleosome positioning or preferred end coordinates of cfDNAs, are used to predict the TOOs of cfDNAs. In this paper, the strategies and challenges in each category are reviewed. Furthermore, the representative applications based on the TOOs of cfDNAs, including noninvasive prenatal testing, noninvasive cancer screening, transplantation rejection monitoring and parasitic infection detection, are also reviewed. Moreover, the challenges and future work in identifying the TOOs of cfDNAs are discussed. Our research provides a comprehensive picture of the development and challenges in identifying the TOOs of cfDNAs, which may benefit bioinformatics researchers to develop new methods to improve the identification of the TOOs of cfDNAs.
Introduction
Cell-free DNAs (cfDNAs) released from dead cells exist in the circulating blood, urine, and other fluids of the body, and the lengths of most of these double-stranded DNA fragments are overwhelmingly shorter than 200 bp. After discovering the presence of cfDNAs for the first time in 1948 [1], researchers observed the elevated cfDNAs in the serum of systemic lupus erythematosus patients [2] and also found the concentration of cfDNAs in cancer patients is higher than that in healthy individuals [3]. Later on, cfDNAs in cancer patients were proven to contain tumor-derived DNAs [4], and soon tumor-specific DNA changes were discovered in cfDNAs [5–11]. These findings make it possible to detect cancers in a noninvasive way, and more and more technologies and methods have been developed to detect and monitor cancers based on plasma cfDNAs [12, 13]. During the same period, Lo et al. [14, 15] discovered fetal-derived cfDNAs in mothers’ bloodstream, which provides a basis for fetal cfDNA-based noninvasive prenatal diagnosis. The noninvasive prenatal tests have been applied to the clinical diagnosis of three fetal chromosome diseases and monogenic diseases [16, 17]. In recent years, cfDNAs have been applied to detect human parasitic infections [18, 19]. In transplantation, the transplanted tissue-derived DNA fractions in cfDNAs can indicate the extent of transplantation rejection [20–22]. The concentration of plasma cfDNAs is positively correlated to the rate of cell death and can indicate the outcomes in severe injury, sepsis and septic shock, aseptic inflammation, myocardial infarction and stroke [23]. Thus, both the concentration and composition of plasma cfDNAs have great potential for noninvasive diagnosis.
The composition of cfDNAs involves two aspects, the TOOs of cfDNAs and the corresponding proportions. It is different in individuals under different physiological states. In healthy individuals, plasma cfDNAs are believed to derive primarily from the dead hematopoietic cells, with minimal contributions from other tissues. However, in pathological states, the contributions of certain disease tissues are different from those in healthy states. How to accurately identify the TOOs of cfDNAs and predict the corresponding proportions is an essential problem in noninvasive diagnosis.
In recent years, to aid the cfDNA based noninvasive diagnoses, a set of methods have been proposed to identify the TOOs of cfDNAs. In this study, we classified those methods into three categories based on the used signals, which are cfDNA mutations, methylation patterns and cfDNA fragmentation patterns.
Distinct single-nucleotide polymorphisms (SNPs) or genetic mutations between a father and a mother, or between a donor and a recipient, were suitable markers for identifying fetus-derived cfDNAs or donor-derived cfDNAs. Recently, the mutations in driven genes of certain diseases also show lights in indicating the TOOs of cfDNAs. However, the power to indicate the TOOs of cfDNAs is dramatically decreased when the driven genes are shared by more than one disease.
DNA methylation can be a good indicator of the TOOs of cfDNAs since different tissues and cell types have different methylated patterns [24]. Moreover, it has been found that diseased tissues also have their own distinct DNA methylation profiles [25]. For example, cancer genomes undergo a progressive gain of CpG methylation in CpG-enriched promoters and a loss of CpG methylation in non-CpG island promoters [25]. Therefore, recently a set of computational methods have been developed to identify tissue-specific or disease-specific methylation markers and predict the composition of cfDNAs.
The cfDNA fragmentation is not a random process which may have correlation with nucleosomes [26] or tissue-preferred ends [27, 28]. The cfDNA fragmentation patterns of cfDNAs, including the nucleosome positioning of different cell types, tissue-preferred ends and the length distribution of cfDNA, may indicate their TOOs [29–31]. Therefore the cfDNA fragmentation patterns have been employed to predict the TOOs of cfDNAs.
In these methods, cfDNA mutations can be extracted from both targeted sequencing and whole genome sequencing data. cfDNA fragmentation patterns are mainly identified based on the whole genome sequencing data. Both the methylation profiling microarray and bisulfite sequencing technology can provide genome-wide DNA methylation profiles for cfDNA samples. In sequencing data analysis, quality control and data preprocessing are basic but important steps. Quality control usually tells you about the number of sequences, base call qualities, base composition, potential contaminants, duplication rate, etc. Another preprocessing step involves trimming the sequence ends and filtering the unwanted sequences. In BeadChips, the basic data preprocessing generally includes data filtering, normalization and removing batch effects. Data preprocessing is an important step, while this article does not cover the details of data reprocessing but focuses on the methods for identifying the TOOs of cfDNAs.
In this article, the cfDNA mutation-based methods, the methylation pattern-based methods and the cfDNA fragmentation pattern-based methods are reviewed. Then, the progress in noninvasive diagnostics based on the TOOs of cfDNAs, including noninvasive prenatal testing (NIPT), noninvasive cancer screening, transplantation rejection monitoring and parasitic infection detecting, is reviewed. Finally, the challenges and future works in identifying the TOOs of cfDNAs are discussed.
The cfDNA mutation-based methods
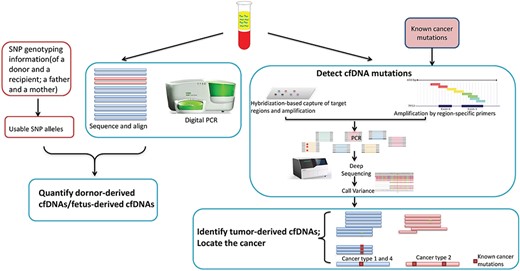
In cfDNA mutation-based methods, distinct SNPs or genetic mutations can indicate the TOOs of cfDNAs. The SNP genotyping information can be obtained by SNP arrays based on the whole-blood samples. Then, between a father and a mother, or between a recipient and a donor, usable SNP alleles which are homozygous in one person but heterozygous or differently homozygous in the other person can be used to identify fetus- and maternal-derived cfDNAs or donor- and recipient-derived cfDNAs and calculate the corresponding cfDNA fractions. Identifying disease-related gene mutations is a hot and important issue. Generally speaking, it involves several steps, including selecting proper samples, sequencing, extracting candidate causal mutations and assessing associations between mutations and diseases. There are many research and review papers on this issue [32–37]. A number of gene mutations have been called based on the sequencing data of disease patients and the general population [38, 39].
Once the distinct SNPs or causal mutations of a disease have been revealed, PCR-based techniques and sequencing-based methods are commonly used for detecting mutations in cfDNAs. PCR-based techniques become less practical with the increasing number of assessed targets, and the sensitivity and specificity of PCR-based techniques vary with the level of mutation-harbored cfDNAs in patients and the heterogeneity of mutations of diseases [13]. Sequencing-based methods [40–45] are quite popular, which can detect all possible mutations in genome-wide or regions of interest. However, there is a big challenge in sequencing-based methods to call mutations in cfDNAs when the frequencies of mutations in cfDNAs can be comparable to or lower than the sequence error rates of the existing platforms. Different strategies for error suppression have been proposed [42, 46–49], and one of the most promising strategies is to use molecular tags to label individual genomic DNA templates. Deep sequencing of these DNA molecules can generate many copies of reads originated from one original DNA molecule. Then the PCR- and sequencing-induced errors in each original DNA molecule can be detected and removed. Therefore, the detection of mutations with low frequencies can be improved.
Based on the available information of mutations and techniques to detect mutations, a number of methods have been proposed to identify the TOOs of cfDNAs based on cfDNA mutations. Table 1 summarizes some representative cfDNA mutation-based methods for different issues. The general steps of these methods are illustrated in Figure 1.
A summary of representative cfDNA mutation-based methods
| Method | Mutation information | Techniques | Methods to predict the TOOs of cfDNAs | Application |
|---|---|---|---|---|
| Snyder et al. [22] | SNP genotyping | Whole genome sequencing | Donor-derived cfDNAs were identified based on SNP genotyping information | Monitor the fractions of donor-derived cfDNAs over time |
| De Vlaminck et al. [50] | SNP genotyping | Whole genome sequencing | Donor-derived cfDNAs were identified based on SNP genotyping information. Infection-derived cfDNAs were identified by aligning the nonhost reads against a custom database of potential pathogens | Monitor the rejection and infection in lung transplant recipients |
| Zou et al. [52] | Human leukocyte antigen alleles | Targeted sequencing and digital PCR | Target human leukocyte antigen alleles specifically to detect donor-derived cfDNAs in lung transplant recipients | Monitor transplantation rejection in lung transplant recipients |
| Lun et al. [57] | A few genomic sites | Digital PCR | Digital RMD | Determine whether a cfDNA is fetus-derived or mother-derived with the background of maternal DNAs within loci where the mother is heterozygous |
| Lo et al. [58] | The haplotypes of one or both parents | Whole genome sequencing | The relative haplotype dosage (RHDO) | |
| Rabinowitz et al. [59] | None (independent of haplotypes of parents) | Whole genome sequencing | The genome-wide relative allele dosage (GRAD); a Bayesian algorithm to calculate the probability of each cfDNA that is derived from fetus the fragment length and called variants | |
| Gerrish et al. [60] | Somatic RB1 mutations | Targeted sequencing | A retinoblastoma screen testing that employs targeted sequencing on cfDNAs from the aqueous humor to detect somatic RB1 mutations | Detect somatic RB1 mutations on cfDNAs from the aqueous humor |
| Forshew et al. [40] | 5995 bases that cover selected regions of cancer-related genes, including TP53, EGFR, BRAF and KRAS | Targeted sequencing | A tagged-amplicon deep sequencing method | Identify low-level mutations in the plasma of patients with high-grade serous ovarian carcinomas |
| Phallen et al. [42] | 58 cancer-related genes encompassing 81 kb | Targeted sequencing | A targeted error correction sequencing method | Noninvasive detection of early-stage tumors, such as colorectal, breast, lung or ovarian cancer |
The general steps of estimating the TOOs of cfDNAs in cfDNA mutation-based methods.
In transplantation, the fraction of donor-derived cfDNAs is a good indicator of acute rejection [21]. Donor-derived cfDNAs are always identified based on the donor-specific SNPs. Snyder et al. [22] quantified the fractions of donor-derived cfDNAs and proposed a genome transplant dynamics approach to monitor the fractions of donor-derived cfDNAs over time. In lung transplantation, not only transplant rejection but also infections result in the increase of donor-derived cfDNA levels which affects the survival rate. De Vlaminck et al. [50] identified donor-derived cfDNAs and infection-derived cfDNAs in plasma to monitor the rejection and infection simultaneously. Donor-derived cfDNAs were identified based on SNP genotyping information. Infection-derived cfDNAs were identified by aligning the nonhost reads against a custom database of potential pathogens, including viruses, bacteria and fungi. Then an infectious load was calculated for each organism based on the ratio of its coverage relative to human genome coverage. Recently, without performing separate genotyping and whole genome sequencing on recipient cfDNAs, targeted sequencing and digital PCR of one or a set of alleles have been used to quantify donor-derived cfDNAs in transplant recipients [51–56]. For example, based on the mismatch of donor-recipient human leukocyte antigen, Zou et al. [52] developed a panel with probes, which specifically targets human leukocyte antigen alleles, to detect donor-derived cfDNAs in lung transplant recipients.
To screen single gene disorders of a fetus, challenges are posed in loci where the mother is heterozygous since it is hard to determine whether a cfDNA is fetus-derived or mother-derived with the background of maternal DNAs. Statistic methods were proposed to infer the mutational status of the fetus based on the allelic imbalance in cfDNA or incorporating the parental haplotype information. The digital relative mutation dosage (RMD) [57] is based on the allelic imbalance and restricted to ultra-accurate devices and a few genomic sites. The relative haplotype dosage [58] needs the haplotypes of one or both parents to overcome the required deep coverage in RMD. However, those methods cannot identify the fetus-derived cfDNAs at the molecular level. Recently, considering the difference between the fragment lengths of fetus-derived cfDNAs and mother-derived ones, Rabinowitz et al. [59] proposed a method, named the genome-wide relative allele dosage, which employs a sequential probability ratio test on loci where the mother is heterozygous, and then used a Bayesian algorithm to calculate the probability of each cfDNA that is derived from fetus by incorporating the information of each DNA fragment, such as the fragment length and called variants.
In noninvasive cancer screening, usually, assays are developed to screen one certain disease by detecting mutations in cfDNAs falling in related genes. For example, based on the known findings that mutations in the RB1 gene can cause retinoblastoma, Gerrish et al. [60] developed a retinoblastoma screen testing that employs targeted sequencing on cfDNAs from the aqueous humor to detect somatic RB1 mutations. Recently, assays have been developed to detect cfDNA mutations in several driven genes which are shared by more than one disease. Forshew et al. [40] developed an approach, named TAm-Seq, to detect mutations in 5995 bases that cover selected regions of cancer-related genes such as TP53, EGFR, BRAF and KRAS. TAm-Seq can amplify and sequence even single copies of tumor-derived cfDNAs in the targeted regions. Phallen et al. [42] proposed a method, TEC-Seq, to examine 58 cancer-related genes encompassing 81 kb, which are commonly mutated in colorectal, lung, ovarian, breast and other cancers. TEC-Seq can ultrasensitively evaluate the sequence changes in cfDNAs. Although significant differences can be observed between the detected mutations in patients and healthy individuals, the TOOs of tumor-derived cfDNAs and the location of a disease cannot be accurately identified based on the detected mutations. Challenges are arising in cancer genomics since some driven genes are shared by more than one cancer. Without comprehensive comparisons among driven genes of other diseases, cfDNAs harboring mutations in genes of interests cannot be confidently identified as derived from a certain disease tissue.
The methylation pattern-based methods
DNA methylation is a type of epigenetic modification, which is to add a covalent methyl group at cytosine residues, especially in CpG dinucleotides. It is one of the explanations accounting for the diversity of gene expression in different cells. Different tissues or cell types, including the normal and aberrant ones, have different DNA methylation patterns [24, 61]. Furthermore, altered DNA methylation has a very close relationship with diseases. For example, the abnormal promoter hypermethylation in tumor suppressor genes, such as MLH1, causes gene silencing and contributes causally to tumorigenesis [62]; the abnormal promoter hypomethylation in tumor genes, such as DPP6, MRPL36 and MEST, activates the gene expression and contributes to the infinite proliferation of cells [63].
The DNA methylation modifications on cytosine residues are not erased when cfDNAs are released from dead cells. Therefore, the tissue-specific methylation patterns can be used to indicate the TOOs of cfDNAs. Many efforts have been focusing on extracting tissue-specific methylation sites or regions based on both the public available DNA methylation data, such as The Cancer Genome Atlas (TCGA) [64, 65] and self-generated DNA methylation sequencing data. According to the tissue-specific methylation patterns, the methylation pattern-based methods can be divided into two groups, including the methylation level of genomic sites based methods and de novo region-based methods.
The methylation level of genomic sites based methods
Recently, several methylation panels have been developed to target a set of CpG sites, and computational strategies were adopted to locate the TOO of tumor growth based on the methylation of these CpG sites [66–68]. For cfDNAs, the methylation statuses of certain CpG sites can be quantified by combining the hybridization-based capture of target sites and sequencing.
Liu et al. [66] developed a pan-cancer methylation panel for detecting and classifying cancers by targeting 9223 CpG sites, which are extracted through the comparison among the methylation profiles of 32 types of cancer and normal tissues in TCGA [64, 65]. For each plasma cfDNA sample, a sample-specific methylation score is calculated as a sum of the weighted log-transformed p-values of CpG sites. Based on the mean (μ) and SD (σ) of sample-specific methylation scores of normal plasma samples in a training group, a threshold μ + 3σ is used to separate cancer samples from normal samples. When the sample-specific methylation score of a sample is above the threshold, it is classified as a cancer sample, and the cancer type is predicted further. A classification score is calculated for each cancer type based on the average methylation level (AML) of the signature CpG sites of the cancer type. Finally, a cancer type with the highest classification score is predicted as the TOO of the cancer.
Nunes et al. [67] developed a cfDNA methylation-based test to detect breast, colorectal and lung cancers simultaneously. Based on the promoter methylation levels of genes, a ‘PanCancer’ panel, including three genes (APC, FOXA1 and RASSF1A), was used to screen cancer, and then a ‘CancerType’ panel, including other three genes (SCGB3A1, SEPT9 and SOX17), was used to determine the cancer type.
To compare the difference between the TOOs of plasma cfDNAs in healthy individuals and patients, Moss et al. [69] constructed a comprehensive methylation atlas of 25 tissues and cell types based on the 450 K/850 K array data. Firstly, the top 100 uniquely hypermethylated CpG sites of each cell type and the top 100 uniquely hypomethylated ones were selected. Then, neighbor CpGs of the selected CpG sites in 50 bp were added into the atlas. Finally, the most differentially methylated CpG sites between the closest pair of cell types, which were identified by using an iterative process, were added into the atlas. Overall, ~8000 CpGs were included in the methylation atlas. For a cfDNA sample, the methylation levels of CpG sites in the atlas are represented by a linear combination of those of 25 tissues and cell types. Then the relative contributions of different cell types to the plasma cfDNAs were calculated by a deconvolution algorithm.
In CpG site-based methods, the methylation signal of each CpG site is an averaged signal, which covers up the methylation signals from the tiny fractions of tissue-derived cfDNAs. Furthermore, differentially methylated CpG sites selected through the comparison between the methylation data of disease samples and normal samples present different degrees of heterogeneity, which compromises the prediction accuracy in clinic diagnosis. Therefore, a more sensitive metric is needed to amplify the methylation signals from tissue-derived cfDNAs, and the different degrees on the heterogeneity of CpG sites should be taken into consideration when selecting CpGs and calculating methylation scores for classification.
De novo region-based methods
The methylation status of a single CpG site may be randomly identified when only a small fraction of molecules are available. Compared with single differentially methylated CpG sites, tissue-specific methylated regions, in which the methylation statuses of most adjacent CpG sites are similar, can tolerate a few CpG sites which present heterogeneity in different individuals and are more suitably used as methylation markers. Therefore, recently a set of computational methods have been developed to predict the TOOs of cfDNAs based on identifying disease-specific/tissue-specific methylated regions. In these methods, three steps are involved, including extracting potential methylation markers, identifying feature markers and inferring the TOOs of cfDNAs, as shown in Figure 2.
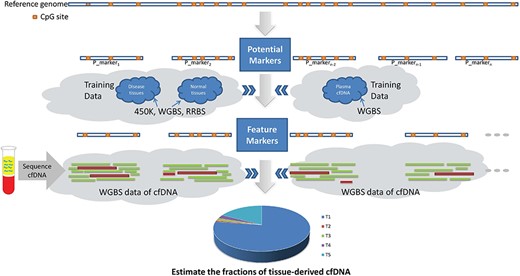
The general pipeline of methylation region-based methods.
In the region-based methods, regions with densely located CpG sites or highly co-methylated CpG sites are selected as potential methylation markers, which are expected to have similar methylation statuses between adjacent CpG sites.
Then, a metric is employed to measure the methylation signal of a potential marker in training data. In recent studies, metrics have been proposed from different insights, including the AML [70, 71], methylation discordancy [72], methylation haplotype diversity [73, 74] and methylation haplotype load (MHL) [75].
Based on the methylation signals of potential markers measured by a metric, a criterion is adopted to select feature markers, which are expected to have powerful discrimination ability. The range, mean and SD of methylation signals on multigroups are factors in designing the criterion for selecting feature markers. With different criteria and training data, different feature marker sets are identified, including sets with only tissue-specific markers, sets with only cancer-specific markers and sets with both tissue-specific markers and cancer-specific markers.
The methylation signal of cfDNAs in each feature marker is a mixture of methylation signals from hematopoietic cells and other tissues. Therefore, in many methods [70, 71, 75], the methylation signal of a feature marker is usually modeled by a linear combination of methylation signals in different tissues, or in normal plasma and diseased tissues from training data, and the parameters represent their corresponding proportional contributions. The parameters in the simultaneous equations are solved by the deconvolution or maximum-likelihood algorithms. Recently, to overcome the bias introduced by the deconvolution based methods and improve the prediction accuracy, a method based on the individual read level was proposed [60]. The state-of-the-art methods are compared and summarized in Table 2.
The comparison of methylation region-based methods
| Method | The type and the number of markers | Methylation level metrics | Methods to estimate the proportions of the TOOs in cfDNA | Prediction |
|---|---|---|---|---|
| Lehmann-Werman et al. [76] | Six tissue-specific methylation markers of the pancreatic β-cell, the oligodendrocyte, the brain cell and the exocrine pancreas cell (including INS, myelin basic protein, WM1, CG0978 (Brain1), REG1A, CUX2 locus) | Tissue-specific methylation pattern (signature CpG sites and four to nine adjacent CpG sites sharing the same methylation pattern) | The proportion of the certain tissue-derived DNA is estimated by the fraction of molecules that fall in the marker and contain the same tissue-specific methylation pattern multiplied by the concentration of cfDNA measured in each sample | Identify and quantify the pancreatic β-cell-derived cfDNA in type 1 diabetes patients, the oligodendrocyte-derived cfDNA in relapsing multiple sclerosis patients, the brain cell-derived cfDNA in patients after traumatic or ischemic brain damage and the exocrine pancreas cell-derived cfDNA in patients with pancreatic cancer or pancreatitis |
| Sun et al. [70] | 1013 type-I markers (tissue-specific methylation markers); 4807 type-II markers (regions have highly variable AMLs across the 13 tissue types) | AML | Deconvolution | Detection of cancer patients, patients who underwent transplantation and pregnant women and estimate of the proportions of the TOOs in cfDNA |
| Guo et al. [75] | 1365 tissue-specific markers for normal tissue classification; 2244 group-II markers for estimation of colon cancer-derived cfDNA proportion; 2782 markers for estimation of liver cancer-derived cfDNA proportion | MHL | Deconvolution | Cancer detection and estimate the proportion of cancer-derived cfDNA |
| Kang et al. [71] (CancerLocator) | 14 429 CpG clusters with MR index ≥0.25 | AML | Maximum-likelihood method | Cancer detection and estimate the proportion of cancer-derived cfDNA |
| Li et al. [72] (CancerDetector) | 3214 liver-cancer-specific markers | The class-specific likelihood of each cfDNA sequencing read | Maximum-likelihood method | Cancer detection and estimate of the proportion of liver cancer-derived cfDNA |
In the method proposed by Sun et al. [70], adjacent CpGs in CpG islands (CGIs) and CpG shores were supposed to have similar methylation statuses; therefore the nonoverlapping 500-bp units of CGIs and their 2 kb upstream and downstream were used as potential markers. Based on the mean (μ) and SD (σ) of AMLs of each potential marker in 13 normal tissues, two types of methylation markers (tissue-specific markers and markers with highly variable AMLs across the 13 tissue types) were identified. Then, they modeled the AML of each marker in a cfDNA sample by a linear combination of the AMLs of 13 (for cancer patients and patients underwent transplantation) or 14 tissues (for pregnant women) on the marker. The parameters in the linear combination model represent the proportions of cfDNAs contributed by tissues and were solved by quadratic programming. Then, the abnormal proportions of cfDNAs contributed by normal tissues are used as indicators for clinical diagnosis. In this method, the proportion of cfDNAs contributed by one tissue is considered as consistent in all simultaneous equations. However, due to the methylation alterations and the varying sequencing coverage on markers, the proportions of cfDNAs contributed by a tissue on different markers may be not identical.
Lehmann-Werman et al. [76] thought that it was unlikely that multiple adjacent CpG sites in the same molecule were accidentally methylated or demethylated simultaneously. Thus they were devoted to extracting tissue-specific methylation markers which were constituted by a number of adjacent CpG sites sharing the same tissue-specific methylation patterns. Firstly, they identified tissue-specific signature CpG sites based on 450 K methylation data of 35 tissues from public datasets. Then they extracted DNAs from different human tissues and PCR-amplified and sequenced the DNA fragments which contain the signature CpG sites. Finally, tissue-specific methylation markers were identified which were constituted by signature CpG sites and four to nine adjacent CpG sites sharing the same tissue-specific methylation patterns. They extracted tissue-specific markers for four types of cells, including the pancreatic β-cells, the oligodendrocytes, the brain cells and the exocrine pancreas cells. For each tissue-specific marker, the fraction of molecules that fall in the marker and contain the same tissue-specific methylation pattern are multiplied by the concentration of cfDNAs measured in each sample to estimate the proportion of certain tissue-derived DNAs circulating in the blood of each patient. In that method, the fraction of tissue-derived cfDNAs may be underestimated, since only the molecules containing the same tissue-specific methylation pattern are counted without considering intra-individual differences.
To guarantee that the methylation statuses of CpG sites in a potential marker are similar, Guo et al. [75] extended the r2 metric of genetic linkage disequilibrium to quantify the degree of co-methylation of two adjacent CpG sites based on their methylation statuses in different methylation haplotypes converted from reads. Then, potential methylation markers, named methylation haplotype blocks (MHBs), were constituted by co-methylation CpG sites, in which the value r2 of any two adjacent CpG sites is not less than 0.5. A novel metric, MHL was proposed to measure the co-methylation level of methylation haplotypes in each MHB. Based on MHL, two types of feature markers were defined, including cancer-specific MHBs and tissue-specific MHBs. The tumor-derived DNA fraction in plasma samples was estimated by deconvolution of the MHLs of cancer-specific MHBs. A strategy of counting tissue-specific MHBs was used to predict the tissue or organ of tumor growth. However, the prediction accuracy of this method is limited due to many factors. The metric r2 of genetic linkage disequilibrium is not suitable to evaluate the co-methylation of two CpG sites, since it cannot work on homozygous sites and prefers strong correlative patterns without distinguishing co-methylation patterns (e.g. r2 = 1 for both CC/TT patterns and CT/TC patterns). Tissue-specific MHBs were identified based on a group-specific index (GSI). However, the definition of GSI is not practicable since the range of MHL value is bounded between 0 and 1 and GSI is negative in most cases and is infinite when MHLmax = 1. The small number of cancer-specific MHBs and tissue-specific MHBs also limits the prediction accuracy. The authors found that the prediction accuracy can be improved by integrating the cancer-specific MHBs and tissue-specific MHBs of a tissue.
In both CancerLocator [71] and CancerDetector [72], the adjacent CpG sites in 450 K DNA methylation array with distance no more than 200 bp were clustered, and CpG clusters containing at least three CpG sites were considered as potential markers. In CancerLocator [71], an MR index was calculated for each potential marker, which is defined as the methylation range between the maximum AML and the minimum AML in six classes, including samples from five organs with solid tumor (450 K data) and healthy plasma samples (WGBS data). Potential markers with MR ≥ 0.25 were considered as feature markers. In CancerLocator, a given patient was assumed to have at most one type of cancer, and then the AML of each feature marker was modeled by a linear combination of the AMLs of a normal plasma sample and a solid tumor tissue t. The log maximum-likelihood method was applied to estimate the parameter values, including the cfDNA tumor burden θ and the source tumor type t, and a score was calculated based on the estimated parameters to predict whether the patient has a tumor of type t. CancerLocator can locate the tumor and estimate the fraction of tumor-derived cfDNAs simultaneously based on a set of feature markers. However, it performs not well when the fraction of tumor-derived cfDNAs is low.
To improve the detection sensitivity for early screening and low sequencing coverage data, Li et al. [72] focused on amplifying the aberrant cfDNA methylation signals on individual sequencing read levels. They classified the reads falling in the regions of markers into either the tumor-derived cfDNA class or the normal-plasma derived cfDNA class based on the joint methylation statuses of multiple adjacent CpG sites on an individual sequencing read with a probabilistic approach. In CancerDetector [72], the potential markers underwent two runs of filters based on methylation differences, including retaining the markers which are specific to liver cancer by comparing the methylation levels of matched tumor and normal tissues and further filtering markers which cannot be used for distinguishing tumor samples from normal plasma samples. The cutoff of the methylation differences is set as 0.2 in the two runs of filters. Different from the deconvolution methods [70, 71, 75], CancerDetector can estimate a tumor-derived cfDNA fraction θ from each marker. The final tumor-derived fraction θ in cfDNAs was estimated by a maximum-likelihood method and iteratively updated by removing ‘confounding’ markers, whose individually estimated tumor fractions are far larger than the most recently updated global tumor-derived fraction θ.
Li et al. [72] simulated 96 plasma cfDNA samples with a variety of tumor fractions and different sequencing coverages and compared the predicted blood tumor fractions of CancerDetector and CancerLocator on those datasets. The experiments showed that CancerDetector gains higher sensitivity than CancerLocator on simulated plasma cfDNA samples. CancerDetector can report a valid prediction when the true tumor fraction is ≥1% with a 2× sequencing coverage.
In the above methylation pattern-based methods, the prediction sensitivity is affected by the quantity and quality of feature markers and the metric used to measure the methylation signals of markers in samples. The average metrics, such as AML and MHL, compromise the prediction sensitivity when the fraction of tumor-derived cfDNAs is low. Moreover, to be applied to clinical diagnosis, systematic methods are needed for determining a cutoff of tumor-derived cfDNA fraction which is used to separate cancer samples from normal samples. The factors, such as the sensitivity of methylation metric, and the overestimation and underestimation with different sequencing coverages and tumor fractions, should be considered. These will be discussed in the section of Challenges and future works.
In addition, the bisulfite conversion rate and the coverage and depth of bisulfite sequencing data also have a great influence on prediction accuracy. The bisulfite conversion rate and bias vary with different library preparation methods [77]. The downstream analysis is definitely benefited by choosing a good library preparation method that can improve the conversion rate and work on the low initial amount of cfDNAs.
The cfDNA fragmentation pattern-based methods
The nucleosome is the primary unit for the spatial organization of DNAs in the nucleus, which reflects the secondary structure of the genome and indicates the gene expression of cells. The main peak of cfDNA lengths is about 150 bp, which matches the length of DNAs occupied by a nucleosome. Other length peaks are about integer times of 150 bp. Teif et al. [30] used deep sequencing to map nucleosome positions in three primary human cell types and in vitro and found that a small fraction of nucleosomes is reproducibly positioned and has cell type-specific spacing in vivo. By comparing the nucleosome occupancies of mouse embryonic stem cells and their neural progenitor and embryonic fibroblast, Valouev et al. [31] found that nucleosome positions play an important role in cell differentiation. By investigating the association between gene expression and nucleosome spacing patterns of cfDNA, Synder et al. [26] demonstrated that the chromatin features reflected by the fragmentation patterns of cfDNAs can infer their TOOs.
In the previous studies of Chan et al. [27] and Sun et al. [28] they defined the cfDNA end positions as preferred ends of cfDNAs which were statistically significantly overrepresented in a sample and with frequencies higher than those predicted by a Poisson probability function if the cfDNA fragmentation was completely random. There is an inner connection between nucleosome spacing patterns and preferred ends of cfDNAs since nucleosomes are preferentially protected from the digestion and cfDNAs are the undigested DNA fragments. Thus, if there exist tissue-specific nucleosome spacing patterns, there also exist tissue-specific preferred ends of cfDNAs. Recently, some researchers have tried to infer the TOOs of cfDNAs based on cfDNA fragmentation patterns, including nucleosome spacing, tissue-preferred ends and the size distribution. The general pipeline of these cfDNA fragmentation pattern-based methods is illustrated in Figure 3. The state-of-the-art methods based on cfDNA fragmentation patterns are compared and summarized in Table 3.
The comparison of cfDNA fragmentation pattern-based methods
| Method | The cfDNA fragmentation patterns | Fragmentation pattern metrics | Methods to predict the TOOs of cfDNAs | Methods to estimate the corresponding fractions |
|---|---|---|---|---|
| Synder et al. [26] | Nucleosome spacing | A WPS used to infer | The TOOs of cfDNAs were predicted based on the correlations of the intensity of FFT signal on WPS values of nucleosomes in the first 10 kb of gene bodies against 76 expression datasets for human cell lines and primary tissues | None |
| Jiang et al. [78] | Tissue-/cancer-derived cfDNA preferred ends | The tissue-/cancer-derived cfDNA preferred ends were identified by comparing with the expectation of a Poisson distribution | The abundances of cfDNAs with tissue/cancer-derived preferred end coordinates suggest the TOOs of cfDNAs | None. Correlations between the abundances of cfDNAs with liver-associated/tumor preferred ends and the tissue-/tumor-derived cfDNA fractions were analyzed |
| Sun et al. [79] | Nucleosome spacing around the tissue-specific open chromatin regions | An OCF value | Positive OCF values indicate the corresponding tissues contributed DNA into the plasma | None. Correlations between OCF values and the corresponding tissue-derived fractions were analyzed |
| Liu et al. [80] | Co-fragmentation patterns of cfDNA (defined as the highly correlated fragment lengths between two regions) | The correlation between each two 50-kb bins | The TOOs of cfDNAs were identified by modeling the inferred compartments as linear combinations of corresponding reference compartments of each tissue/cell type inferred from Hi-C, H3K4me1 or WGBS data | Deconvolution |
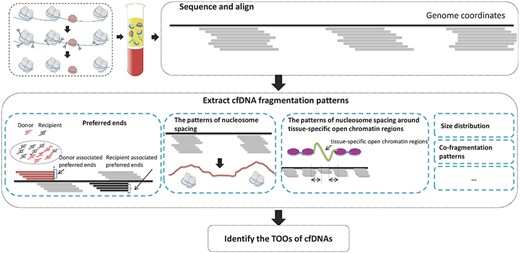
The general pipeline of cfDNA fragmentation pattern-based methods.
Synder et al. [26] hypothesized that nucleosome spacing patterns of cfDNAs might contain evidence of their TOOs. To prove the hypothesis, they performed deep sequencing on cfDNAs from healthy individuals and patients with cancer. A windowed protection score (WPS) and a heuristic peak-calling algorithm were proposed to infer the positions of nucleosomes, based on the knowledge that nucleosomes are preferentially protected from the digestion. The high WPS values indicate strong protection of DNA regions from the digestion; low values indicate that DNA regions are unprotected. Regions with elevated WPS values were identified as nucleosomes. Then fast Fourier transform (FFT) was performed on WPS values of nucleosomes in the first 10 kb of gene bodies. According to the correlations of the intensity of FFT signal against 76 gene expression datasets of human cell lines and primary tissues, they found out that the most highly negatively correlated cell lines are hematopoietic lineages in three healthy samples, while many of the most highly ranked cell lines or tissues in plasma samples from five individuals with Stage IV cancers represent non-hematopoietic lineages. Therefore, they concluded that the patterns of nucleosome spacing in plasma samples under different physiological conditions or disease processes can be used to infer the TOOs of cfDNAs. However, the number of plasma samples (from three healthy individuals and five cancer patients) involved in this study is quite small, and the influence of different sequencing coverages on inferring the positions of nucleosomes is not analyzed. Furthermore, more efforts are needed to extract tissue-specific nucleosome spacing patterns.
Jiang et al. [78] considered that the cfDNA fragmentation is a nonrandom process and assumed that the profiles of cfDNA preferred ends originated from different organs and cell types might be different. In their previous studies [27, 28], preferred ends were defined as the cfDNA end positions which were statistically significantly overrepresented in a sample and with frequencies higher than those predicted by a Poisson probability function if the cfDNA fragmentation was completely random. Based on this definition, they identified the fetal tissues’ preferred ends and the maternal tissues’ preferred ends in the plasma of pregnant women. In this work [78], to demonstrate that tissue or tumor-associated cfDNA preferred ends may also exist, a plasma sample of a liver transplantation recipient was used to identify liver-derived cfDNA preferred ends, and plasma samples from an hepatocellular carcinoma cancer (HCC) patient and a chronic hepatitis B virus (HBV) patient were used to identify HCC-derived cfDNA preferred ends. The plasma samples were deeply PCR-free sequenced (>200×).
To identify liver-derived cfDNA preferred ends, firstly, the recipient-specific and donor-specific cfDNA molecules were identified based on the recipient-specific alleles and donor-specific alleles. Then among the donor-specific cfDNA molecules, the donor-associated preferred end coordinates were identified by comparing with the expectation of a Poisson distribution. The donor-associated preferred end coordinates were considered as liver-derived cfDNA preferred ends. The recipient-associated preferred end coordinates were also identified and considered as derived from the recipient’s hematopoietic system. To identify the HCC-derived cfDNA preferred ends, first of all, statistically significantly overrepresented end coordinates in the plasma samples of the HCC patient and the chronic HBV patient were identified separately. The statistically significantly overrepresented end coordinates that were not shared by cfDNAs of the HCC and chronic HBV patients were considered as the tumor-associated and nontumor-associated preferred end coordinates, respectively. They found that the sizes of cfDNAs with liver-derived preferred ends were shorter than those with the recipient-associated preferred ends, and the sizes of cfDNA molecules with the tumor-associated preferred ends were shorter than those with the nontumor-associated preferred ends. The identified tissue or tumor preferred end coordinates were also tested in other plasma samples with low sequencing coverage to see if these preferred end coordinates can be observed. Then the correlation between the abundances of cfDNAs with liver-associated/tumor preferred end coordinates and the tissue/tumor-derived cfDNA fractions in these samples were analyzed.
In that study, the liver- or HCC-associated preferred ends were identified from a single individual or a pair of the HCC patient and the chronic HBV patient. When applying these preferred end coordinates to other plasma samples, according to the results reported by Jiang et al. [78], we can find that the ratios of tumor-associated to nontumor-associated preferred ends in plasma samples of healthy subjects, chronic HBV carriers, patients with liver cirrhosis and HCC patients are not significantly different. Furthermore, the identified liver- or HCC-associated preferred end coordinates may be quite individual-specific, because the observation of these preferred end coordinates does not indicate that they also are liver- or HCC-associated preferred ends in other samples. Although the idea is quite innovative, more work needs to be done before applying to clinical diagnosis.
Recently, Sun et al. [79] used tissue-specific open chromatin regions to explore the tissue-specific cfDNA fragmentation patterns. Based on the common open chromatin regions of T cells and the liver (which are the main contributors for plasma cfDNAs), they observed characteristic fragmentation patterns of cfDNAs in these regions, which are reflected by sequencing coverage imbalance and differentially phased fragment end signals. Those fragmentation patterns can also be interpreted as a nucleosome-depleted region in the center and the presence of neighboring well-phased nucleosomes. Therefore, they hypothesized that the cfDNA fragmentation patterns around the tissue-specific open chromatin regions can infer the TOOs of cfDNAs. So if a tissue contributes DNA into the plasma, the cfDNA fragmentation patterns can be observed in the corresponding tissue-specific open chromatin regions. An orientation-aware cfDNA fragmentation (OCF) value was proposed to quantify the cfDNA fragmentation patterns around the open chromatin regions of a certain tissue [79]. OCF value was calculated based on the differences of upstream and downstream ends in 20 bp windows, which are 60 bp apart from the centers of the tissue-specific open chromatin regions in upstream and downstream directions. The OCF value should be positive if the corresponding tissue contributed DNA into the plasma; otherwise it should be zero or negative. OCF values were calculated for individuals in different groups on certain tissues. In healthy subjects, positive OCF values were observed on T cells and the liver, and those near or below zero were observed on other tissues. For prenatal individuals, liver transplantation and HCC patients, lung cancer patients or colorectal cancer (CRC) patients, elevated OCF values were observed on the placenta, liver, lungs or small intestines, respectively. Furthermore, positive correlations were observed between OCF values and the corresponding tissue-derived fractions in cfDNAs.
Liu et al. [80] proposed a method, named ‘FREE-C™’, to infer chromatin organization based on the co-fragmentation pattern of cfDNAs, which is defined as the highly correlated fragment lengths between two regions. Firstly, based on the whole genome sequencing data of a plasma cfDNA sample or multi-plasma cfDNA samples, a correlation matrix was constructed for each pair of 500-kb bins across the genome. Then, a principal component analysis was applied to the correlation matrix, and chromatin compartments were inferred and represented by the sign and magnitude of the first eigenvector. They considered that if a tissue contributes DNA into the plasma, the different chromatin compartments of the tissue can be reflected in the inferred chromatin compartments. Therefore, the chromatin compartments inferred by FREE-C™ were represented by linear combinations of those of 18 tissues/cell types inferred from 65 datasets (Hi-C, H3K4me1 or WGBS data). Then, the TOOs of cfDNAs were identified, and the tissue-derived cfDNA fractions were estimated by applying quadratic programming on the linear combinations.
It is novel to infer the TOOs of cfDNAs based on the patterns of nucleosome spacing, the tissue-specific preferred ends or the length distribution of cfDNAs. However, this type of method is at its very beginning. The individual differences in tissue-specific nucleosome spacing patterns and tissue-specific preferred ends of cfDNAs should be evaluated, and more samples should be involved to identify tissue-specific nucleosome spacing patterns and tissue-specific preferred ends of cfDNAs. Furthermore, the influence of different sequencing coverages on extracting cfDNA fragmentation patterns should be assessed. Moreover, it is quite important to quantify the cfDNA fragmentation patterns when applying the cfDNA fragmentation pattern-based methods to clinical diagnosis.
Noninvasive diagnostics based on the TOOs of cfDNAs
The plasma collects cfDNAs released from dead cells in different tissues or all organisms in the body, and the TOOs of cfDNAs can provide abundant information for diagnosing diseases in a noninvasive way. Up till now, the TOOs of cfDNAs have been applied to four areas, as shown in Figure 4. In the plasma of pregnant women, about 10% of cfDNAs are fetal-derived cfDNAs, which makes the NIPT possible. In the plasma of cancer patients, tumor-derived cfDNAs can also be observed, which has been employed for the noninvasive cancer screening. In the plasma of transplant patients, the cfDNAs derived from dead cells in the transplanted tissue enable doctors to monitor transplantation rejection. The dead cells of parasites in human bodies also release DNAs into human plasma. Therefore identifying the cfDNAs derived from parasites has been applied to detect human parasitic infections.
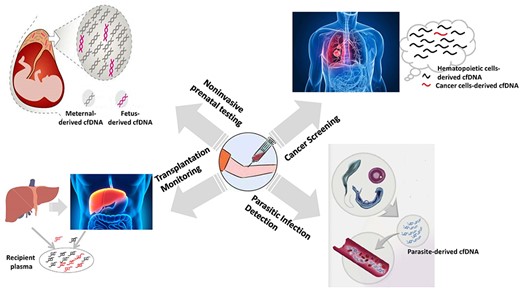
The cfDNA-based noninvasive diagnosis applications.
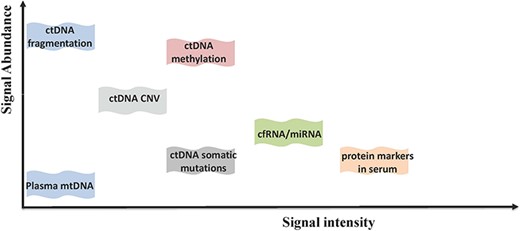
Comparison of different types of markers in the diagnosis and prognosis of HCC in terms of signal abundance and signal intensity.
Noninvasive prenatal testing
After Lo et al. [14, 15] found the presence of fetal-derived cfDNA in maternal plasma and serum, a series of methods [57, 58, 81–87] for NIPT were developed successively, including screening –fetal chromosomal aneuploidy [16, 17, 81, 82, 84, 88–90] and monogenic diseases [57, 58, 83, 85, 86]. In screening fetal chromosomal aneuploidy, the theory is that the over- or under-proportion of cfDNAs from a chromosome may indicate an aneuploid chromosome. In screening monogenic diseases, the key task is to investigate the mutational status of the fetus despite the background of maternal DNAs in maternal plasma.
Noninvasive fetal chromosomal aneuploidy detection
The rapid development of sequencing technology makes quantitatively measuring the cfDNA derived from each chromosome become more convenient. Two pioneer reports about the fetal chromosomal aneuploidy detection based on maternal plasma were proposed in 2008. Chiu et al. [81] proposed a systematic method to detect fetal chromosomal aneuploidy by massively parallel genomic sequencing of cfDNAs in maternal plasma. Firstly, the sequenced cfDNAs in maternal plasma were aligned to the human reference genome, and then the percentage contribution of unique reads mapped to each chromosome was calculated, which is defined as the percentage of unique mapped reads on each chromosome to all unique sequences generated for the sample. For the percentage contribution of unique reads mapped to each chromosome of a test sample, a Z-score was calculated based on the mean and deviation of those in a reference dataset (maternal plasma samples of euploid pregnancies). The high Z-score of the chromosome of interest indicates that the fetus has the chromosomal aneuploidy of this chromosome. The method was tested on 14 maternal plasma samples with trisomy 21 fetuses and 14 with euploid fetuses, which were correctly classified.
In the same year, Fan et al. [84] also proposed a method to detect fetal chromosomal aneuploidy based on sequencing. For a plasma sample, they counted the number of reads falling within a sliding window of 50 kb across each chromosome, and the median count on each chromosome was selected and normalized by the median of the median counts of autosomes, which was referred as the sequence tag density of the chromosome. Then, for a chromosome of interest, its median of the sequence tag densities in normal maternal plasma samples of euploid pregnancies was selected as a benchmark value for comparison, and the relative difference of a test sample on this chromosome was calculated by dividing this benchmark value from its sequence tag density of the chromosome. That method was applied to 9 maternal plasma samples with trisomy 21 fetuses, 2 with trisomy 18 fetuses, 1 with trisomy 13 fetuses and 18 with normal and aneuploid pregnancies, and it successfully identified all these cases.
The performance of NIPT for screening trisomies 18 and 13 is worse than trisomy 21. Based on their previous Z-score method proposed in [81], to improve the detection accuracy for trisomies 18 and 13, Chen et al. [88] increased the number of aligned reads for each sample by using a non-repeat-masked reference human genome and used a GC-corrected read count to calculate the Z-score of a chromosome.
Later on, the cfDNA testing was firstly applied to clinical practices in Hong Kong, and many large-scale testings [91–95] were carried out to evaluate the performance of NIPT for screening trisomies. In these studies, the researchers found that the performance of NIPT for screening trisomy 21 was superior to that of all other traditional screening methods. However, the performance of NIPT for screening trisomies 18 and 13 and sex chromosome aneuploidies was not as good as that of screening trisomy 21. Therefore, NIPT for screening trisomies was advised to be used as a screening method rather than a diagnostic test.
Besides using the proportion of cfDNAs derived from a chromosome, the methylation signals of cfDNAs are also employed for detecting fetal chromosomal aneuploidy [96, 97]. Papageorgiou et al. [97] proposed a fetal-specific DNA methylation ratio-based approach to detect trisomy 21. They firstly selected a set of fetal-specific methylated regions of chromosome 21 and then used MeDiP and real-time qPCR to enrich and capture the fetal-specific methylated cfDNAs. A fetal-specific DNA methylation ratio is calculated for each fetal-specific differentially methylated region (DMR) of a testing sample, defined as the ratio of the sample’s normalized methylation level to the median value of normal samples. The fetal-specific DNA methylation ratios of the set of DMRs were combined to detect trisomy 21.
NIPT of monogenic diseases
In recent years, NIPT has been expanded to single gene disorders, such as cystic fibrosis, β-thalassemia [57], congenital adrenal hyperplasia [85], hemophilia [83], etc. Lun et al. [57] proposed a digital RMD approach which can be used to measure the maternally inherited mutations in fetal origin cfDNAs despite the background maternal DNA in maternal plasma. RMD has been employed widely in follow-up studies for NIPT of monogenic diseases. The same research group [58] proposed a method to assemble the fetal genome based on the fetal origin cfDNAs in maternal plasma with the guide of the paternal genotype and the maternal haplotype and scan the fetal genome to investigate the mutational status of the fetus. They applied this method to identify whether the fetus has inherited β-thalassemia from both parents who carry mutations for the blood disease β-thalassemia.
To identify whether the fetus has inherited congenital adrenal hyperplasia, which is an autosomal recessive disorder and arises from mutations in the CYP21A2 gene, New et al. [85] used targeted sequencing of the CYP21A2 region in plasma DNA and genomic DNA samples from parents. Then the maternal haplotype and the parental haplotype of the CYP21A2 region were constructed by their own specific heterozygous sites. The maternal and parental haplotypes inherited by the fetus were deduced based on the targeted sequencing of plasma cfDNAs and the RMD method. Therefore, the maternal- and parental-derived mutations inherited by the fetus were measured.
Noninvasive cancer screening
Besides the noninvasive prenatal diagnosis, researchers have found that the majority of somatic mutations in solid tumor samples can also be detected in cfDNAs [98, 99]. Therefore, screening cancers based on cfDNAs, especially without phenomenon or at relatively early stages, becomes more and more attractive. Furthermore, the development of cancers can be monitored through the composition changes of cfDNAs.
Early screening
Early detection of cancer can reduce deaths and increase the survival rate. Chan et al. [100] screened participants who did not have symptoms of nasopharyngeal carcinoma based on cfDNAs. The pathogenesis of nasopharyngeal carcinoma is closely associated with Epstein-Barr virus (EBV), and circulating cancer-derived EBV cfDNAs in plasma has been established as a tumor marker for nasopharyngeal carcinoma. They analyzed circulating EBV cfDNAs in plasma by targeting PCR of the BamHI-W fragment of the EBV genome. In a total of 20 174 participants, EBV cfDNAs were persistently detectable in plasma of 309 participants. Among these 309 participants, 34 participants were confirmed to have nasopharyngeal carcinoma, and the proportion of stage I/II in 34 cases is 70.6%. The sensitivity and specificity of EBV cfDNAs in plasma samples in screening for nasopharyngeal carcinoma were 97.1% and 98.6%, respectively. The false-positive rate was about 1.36%, while the false-negative rate was about 0.005% (only one screen-negative participant has nasopharyngeal carcinoma within 1 year after screening). EBV cfDNAs in plasma samples are proven to be useful to screen for early nasopharyngeal carcinoma in asymptomatic persons. Since patients in the test usually have symptoms of solid tumors, and there is no follow-up, the ability of assays to detect cancers in early stages cannot be accessed accurately. Through reanalyzing published data on cfDNA sequencing, Freenome Inc. [101] assessed the required input volume of blood, sequencing depth and the cost for mutation-based early cancer detection. They demonstrated that early detection may be infeasible based on detecting tumor-derived mutations in cfDNA alone, while integrating signals from different omics may improve the performance of early cancer screening. Recently, Liang et al. [102] built a diagnostic prediction model based on nine methylation markers of lung cancers to detect early-stage lung cancer and differentiate lung cancers from benign lesions. By using machine learning algorithms on the plasma and tissue methylation patterns, Grail Inc. [103, 104] has developed a targeted methylation assay for detecting multi-cancers at the early stage and locating cancers, while further validation is ongoing. Wan et al. [105] working in Freenome Inc. employed a machine learning method to detect early-stage CRC based on features extracted from the number of cfDNA reads falling in regions of protein-coding genes and estimated tumor fractions by using IchorCNA [106]. For plasma samples from 546 CRC patients (80% stage I/II) and 271 non-cancer controls, they achieved a mean the area under the curve (AUC) of 0.92 with a mean sensitivity of 85% at the specificity of 85% in the 5-fold cross-validation.
Locate the TOO of tumor growth
Recently, Cohen et al. [107] developed a panel, named CancerSEEK, to detect and predict the TOOs of cancers by combining protein biomarkers with genetic biomarkers. Through evaluating levels of eight circulating proteins and mutations from 2001 genomic positions of 16 genes in cfDNAs, CancerSEEK can detect eight common cancer types, including ovary, liver, stomach, pancreas, esophagus, colorectum, lung or breast cancers. It was applied to 1005 patients with non-metastatic, clinically detected cancers and 812 healthy individuals. The median value of sensitivity is about 70% among the eight cancer types, ranging from 33 to 98% for the detection of eight cancer types. The specificity of CancerSEEK was about 99%.
Cancer-specific methylation patterns have been used to screen various cancer types in plasma samples. Wu et al. [108] developed a CRC diagnostic assay for targeted methylation sequencing of 1062 markers in cfDNAs, where the methylation markers were extracted from 70 pairs of tumor-normal matched tissue samples. Then a malignancy classification model was trained by the targeted DNA methylation sequencing data of 118 plasma samples. Their assay was demonstrated to be very sensitive for the early-stage CRC detection, with a sensitivity of 76.5 and 95% for stages I and II CRC, respectively, and a specificity of 84.5 and 78.3% for healthy subjects and benign complications, respectively. Liu et al. [66] developed an assay for targeting 9223 CpG sites extracted from TCGA. The classification accuracy of the pan-methylation assay was evaluated on plasma cfDNA samples from 78 patients with advanced CRC, non-small-cell lung cancer (NSCLC), breast cancer or melanoma. The average accuracy irrespective of cancer type is about 83.8%, and the average accuracy of correct cancer type is about 66.7% among 68 plasma samples collected from the patients off-therapy. The assay achieved the highest classification accuracy for CRC (88.5%), and the lowest one for NSCLC (50%). Based on the promoter methylation levels of genes, Nunes et al. [67] developed a cfDNA methylation-based test to detect breast, colorectal or lung cancers simultaneously. A ‘PanCancer’ panel containing three genes (APC, FOXA1, RASSF1A) was used to screen cancer with an accuracy of 72.8%. Further, a ‘CancerType’ panel including another three genes (SCGB3A1, SEPT9 and SOX17) was used to determine the cancer type with an average accuracy of 66.26%. Those methods achieve better diagnosis accuracies on CRC than other cancers since CRC is a well-studied cancer that presents less heterogeneity. Vymetalkova et al. [109] reviewed the use of cfDNA in CRC diagnoses, therapy improvement and prognosis.
Monitoring temporal mutations in metastatic cancers
For relapsed and metastatic cancers, the cancer genomes are evolved, and it is important to monitor the new mutations temporally for a new therapy decision. Estrogen receptor-positive breast cancer is a metastatic cancer. Chung et al. [110] carried a hybrid capture-based genomic profiling on cfDNAs from 254 female patients with estrogen receptor-positive breast cancer to study the clinical implementation of genomic profiling of tumor-derived cfDNAs. Sixty-two breast cancer-related genes were sequenced to a median unique coverage depth of 7503×. They found that the majority of genomic mutations in matched tissue samples from breast cancer were also detected in tumor-derived cfDNAs, while many mutations present only in tumor-derived cfDNAs that may not be detected in a single tumor biopsy. It indicates that clonal heterogeneity can be captured in tumor-derived cfDNAs. Therefore, cfDNAs may also provide an alternative approach to detect and monitor metastatic cancers.
Noninvasive transplantation monitoring
At the very beginning, to investigate the relative contributions of hematopoietic and non-hematopoietic cells to cfDNAs, sex-mismatched heart, liver and renal transplantation models (female recipients of male donors) were used [111, 112]. Later, they found that the fraction of cfDNAs derived from chromosome Y can represent the fraction of donor-derived cfDNAs. To assess the acute rejection in renal transplantations, Moreira et al. [20] quantified the total cfDNAs and the donor-derived cfDNAs by real-time quantitative PCR for the HBB gene and the TSPY1 gene, respectively, in both plasma and urine. Macher et al. [113] quantified the donor-derived cfDNAs by using real-time quantitative PCR of the SRY gene to monitor the health of the transplanted liver. Based on the sex-mismatched renal transplantation patients, Sigdel et al. [114] used urinary donor-derived cfDNAs to investigate the apoptotic injury load of the donor organ.
Based on the genotype information of the donor and the recipient, the donor-derived cfDNAs can be identified by a sex-independent strategy [22, 115]. In the analysis of plasma cfDNAs in heart transplant recipients, Snyder et al. [22] quantified the fractions of donor-derived DNAs by the donor-specific SNPs and sequencing technology and observed that the levels of donor-derived cfDNAs were significantly increased when there were acute cellular rejections diagnosed by endomyocardial biopsies. Later, through a prospective cohort study of comparing the performance of donor-derived cfDNAs and endomyocardial biopsy to measure the allograft rejection, they demonstrated that the fractions of donor-derived cfDNAs can be used for diagnosing acute rejection after heart transplantation [21].
Without the need to separate the donor and recipient genotyping, the donor-derived cfDNAs can be quantified by digital PCR based on a set of informative SNPs [53–56]. To assess the graft damage after liver transplantation, Schütz et al. [54] used droplet digital PCR for a small set of SNP loci, which were homologous genotypes in the patient’s blood cell but heterozygous genotypes in the patient’s plasma, to quantify the donor-derived cfDNAs. By using digital PCR to quantify the donor-derived cfDNAs in renal transplantation patients, Lee et al. [53] found that urine contains more copies of donor-derived cfDNAs than plasma, but they could not observe any significant difference in the amount of donor-derived cfDNAs between patients with different clinical conditions due to the high variability in the number of urinary cfDNAs.
Parasitic infection detection
Not only do dead cells of human bodies release DNA fragments into the circulation, but also the parasites release their DNA fragments into the host’s circulation. Thus, parasite-derived cfDNAs have been used for diagnosing parasitic infections, in which there is difficulty in obtaining samples, particularly when the parasites reside in tissues. The recent cfDNA-based parasite detection has been applied to diagnosing several parasitic infections [116]. Baraquin et al. [117] employed quantitative PCR and droplet digital PCR to detect Echinococcus multilocularis-derived cfDNAs in patients with alveolar echinococcosis (AE). Among 31 serum samples of patients with AE, they detected low levels of E. multilocularis-derived cfDNAs in about 25% of samples. Wan et al. [118] used targeted sequencing of repeat regions in Echinococcus genome to detect Echinococcus-derived cfDNAs in plasma of echinococcosis patients. When applied to patient plasma, they achieved a AUC of 0.862 with a detection sensitivity of 62.5% and specificity of 100%. Wichmann et al. [18] used real-time PCR to detect Schistosoma-derived cfDNAs in human plasma. In these studies, the core of cfDNA-based parasite detection methods is to detect parasite-specific sequences, such as repeats, RNA genes or parasites-specific genes. Selecting parasites-specific sequences as target sequences to be amplified should consider many factors, such as the specificity and appearance probabilities of the sequences. Then, the amplification methods should be selected according to cfDNA samples (blood, saliva, urine, stool, sputum, etc.), since the diagnostic accuracy varies with the used samples and amplification methods.
Not only parasites but pathogens also can be identified based on the pathogen-derived cfDNAs in plasma, when the genomes of potential pathogens are available. However, to employ the parasite-derived/pathogen-derived cfDNAs in aiding diagnosis, the detection sensitivity and accuracy should be improved. Moreover, it is in urgent need to develop methods for predicting the tissue locations of parasites based on cfDNAs.
Challenges and future works
Identifying the TOOs of cfDNAs provides a very promising way for noninvasively diagnosing diseases and monitoring their development. In this review, three categories of methods to identify the TOOs of cfDNAs are reviewed. As shown in Table 4, different features of these methods are compared based on three noninvasive diagnoses. The signal intensity for indicating the TOOs of cfDNAs is defined as the differences between two groups (e.g. normal class vs. cancer patient; fetus vs. mother; donor versus recipient) on markers. The more distinct signals of markers in one group, the stronger the signal intensity for indicating the TOOs of cfDNAs is. For NIPT and transplantation monitoring, cfDNA mutation-based methods can be used on low coverage sequencing data because of the abundant distinct SNPs and the strong signal intensity of SNPs. For screening cancers, since the number of gene mutations is limited and the gene mutations are generally shared by different cancer types, it is difficult to identify the TOOs of cfDNAs accurately by using cfDNA mutation-based methods. In those noninvasive diagnoses, to call reliable mutations in cfDNAs, a matched cfDNA-white blood cell sequencing should be required to exclude false positives from white blood cells, since the source of a large proportion of cfDNA mutations is from clonal hematopoiesis mutations [119]. For three noninvasive diagnoses, abundant tissue-/cancer-specific methylation makers have been extracted. The performance of methylation pattern-based methods indicates that methylation makers have a strong signal intensity for indicating the TOOs of cfDNAs and can be used to estimate the tissue-derived fractions of cfDNAs. In cfDNA fragmentation pattern-based methods, abundant cfDNA fragmentation patterns, such as tissue-specific nucleosome spacing patterns and tissue-specific preferred ends of cfDNAs, were extracted for three noninvasive diagnoses based on a small number of samples. The results show that these cfDNA fragmentation patterns have limited power to indicate the TOOs of cfDNAs and estimate the corresponding fractions in other samples. Thus, continuous effort is needed to extract cfDNA fragmentation patterns with a strong signal intensity and improve the estimation of tissue-derived cfDNA fractions. In this review, most of these methods are proposed to detect and predict the TOOs of cancers. They are different in the detection sensitivity and accuracy due to the different performances on identifying the TOOs of cfDNAs. Therefore, improving the identification of the TOOs of cfDNAs is a basic but important thing in noninvasive diagnostics.
The comparison of three categories of methods
| Noninvasive prenatal testing | Noninvasive transplantation monitoring | Noninvasive cancer screening | |
|---|---|---|---|
| cfDNA mutation-based method | |||
| Markers | Distinct SNPs between father and mother; distinct SNPs between fetus and mother | Distinct SNPs between donor and recipient | Mutations in driven genes |
| Number of markers | Abundant | Abundant | Very small |
| Signal intensity for indicating the TOOs of cfDNAs | Strong | Strong | weak |
| Can be used to estimate the corresponding fractions | Yes | Yes | No |
| Methylation pattern-based methods | |||
| Markers | Fetus-specific methylation patterns | Transplant tissue-specific methylation patterns | Cancer-specific methylation pattern; tissue-specific methylation patterns |
| Number of markers | Abundant | Abundant | Abundant |
| Signal intensity for indicating the TOOs of cfDNAs | Strong | Strong | Strong |
| Can be used to estimate the corresponding fractions | Yes | Yes | Yes |
| cfDNA fragmentation pattern-based methods | |||
| Markers | Fetus- associated and mother-associated preferred ends | Donor-associated and recipient-associated preferred ends | Tumor-associated and nontumor-associated preferred ends |
| Number of markers | Abundant | Abundant | Abundant |
| Signal intensity for indicating the TOOs of cfDNAs | Possibly strong (need to be proved further) | Possibly strong (need to be proved further) | Possibly strong (need to be proved further) |
| Can be used to estimate the corresponding fractions | Possibly yes (need to be proved further) | Possibly yes (need to be proved further) | Possibly yes (need to be proved further) |
The prediction performance (in terms of AUC) of different types of markers on early screening of liver cancer
| ctDNA fragmentation | ctDNA methylation | ctDNA somatic mutations | cfRNA/miRNA | Protein markers in serum | |
|---|---|---|---|---|---|
| ctDNA fragmentation | AUC = 0.93 (Jiang et al. [121]) | \ | \ | \ | \ |
| ctDNA methylation | \ | AUC = 0.94 (Xu et al. [123]) AUC = 0.88 (Cai et al. [122]) | \ | \ | \ |
| ctDNA somatic mutations | \ | \ | \ | \ | \ |
| cfRNA/miRNA | \ | \ | \ | AUC = 0.87 (Tan et al. [125]) | \ |
| Protein markers in serum | \ | \ | AUC = 0.93 (Qu et al. [124]) | \ | AUC = 0.85 (Han et al. [126]) |
Improve the quality and quantity of markers
The identification of the TOOs of cfDNAs is benefited by improving the quality and quantity of markers. In panels designed for detecting cfDNA mutations or measuring methylation levels of loci of interest, only the loci in a panel are under examination. False negatives may be possibly introduced by the small size of the panel and the genetic and locus heterogeneity. The methylation region-based methods provide a flexible way to identify abundant markers. In those methods, different numbers and qualities of feature markers are identified. A small number of feature markers may compromise the prediction sensitivity on low coverage sequencing data and extremely low fractions of tissue-/tumor-derived cfDNAs. A large number of feature markers can decrease the chance of off-target, but at the same time noise is inevitably brought in, calculating the tissue-derived cfDNA fractions and predicting the TOOs of diseased tissues, since different feature markers have different properties and qualities, in terms of region lengths, the numbers of CpG sites, methylation differences and heterogeneity. Therefore, to improve the quality and quantity of methylation markers, DMRs can be identified in different scenarios, for example, DMRs based on tissue samples, DMRs based on tissue and plasma samples and DMRs based on plasma samples.
Although the cfDNA fragmentation pattern-based methods are at the very beginning stage, they have great potential to provide abundant markers. Therefore, more efforts should be made to identify tissue-specific nucleosome spacing patterns or tissue-specific preferred ends of cfDNAs.
Combining the markers identified based on three types of signals, including cfDNA mutations, methylation patterns and fragmentation patterns, could improve the identification of the TOOs of cfDNAs. However, the quality of markers should be evaluated and classified, and different categories of markers should have different weights in calculating the tissue-derived cfDNA fractions and locating the disease tissues.
Develop methods to amplify the tissue-specific signals of cfDNAs
In plasma samples, except for hematopoietic cells, the amounts of cfDNAs derived from other tissues are extremely low, so do the tissue-specific signals of cfDNAs. In cfDNA mutation-based methods, the detection of mutations with low frequencies in patients’ cfDNAs can be improved by error suppression and amplified by deep sequencing. In methylation pattern-based methods, the averaged metrics (such as AML, methylation discordancy [72], methylation haplotype diversity [73, 74] and MHL [75]) used to measure the methylation levels of markers fail to amplify the methylation signals from the tiny fractions of tissue-derived cfDNAs or incorrectly measure the methylation signals in low coverage bisulfite sequencing data. Then, the sensitivity for identifying the TOOs of cfDNAs is compromised. To amplify the aberrant cfDNA methylation signals, Li et al. [72] employed the joint methylation statuses of multiple adjacent CpG sites on an individual sequencing read and used a probabilistic approach to classify reads into two classes. This strategy makes it sensitive to low fractions of tissue-/tumor-derived cfDNAs and low sequencing coverage data. Therefore, it is challenging but urgent to propose sensitive ways to amplify the tissue-specific signals falling in the regions of markers.
Transfer the estimated tissue-derived molecule fractions into a clinical diagnostic decision
Estimating the fraction of tissue-/tumor-derived cfDNAs makes it possible to monitor the development of diseases. The donor-derived cfDNA fraction can be used as an alarming level for monitoring the rejection and therapeutic response to anti-rejection therapy. The tumor-derived cfDNA fraction can suggest whether he/she has cancer. Furthermore, the estimated tissue-derived cfDNA fractions make it possible to identify the TOOs of diseased tissues. In the early screening of cancers, predicting the tissue that cancer locates can provide guidance for targeted treatments. In parasite diagnosis, identifying the tissues that the parasite locates can provide clinical suggestions for surgery. Therefore, the estimated tissue-derived cfDNA fractions can be transferred into a clinical diagnostic decision. However, different fractions are estimated by different methods, due to the different quality, specificity and heterogeneity of markers. The more accurate the estimated tissue-derived cfDNA fractions are, the more reliable a clinical diagnostic decision is.
In the estimation of tissue-derived cfDNA fractions, the overestimation and underestimation with different sequencing coverages should be considered. The fractions can be more accurately estimated by excluding cfDNA mutations from white blood cells and improving the quality of markers, including identifying and removing the individual specific markers and the confounding markers when the blood and tissue methylation data of the same patient is available. In addition, when time-serial plasma samples are available, time-serial cfDNA analysis can help developing methods for selecting markers and improving the estimation of tissue-derived fractions of cfDNAs.
In transplantation, a cutoff threshold of donor-derived cfDNA fractions is needed to be applied to clinical diagnose. However, the cutoff threshold which can be used as an alarming level for monitoring the rejection and therapeutic response to anti-rejection therapy is varying in different transplanted organ types [120]. Similarly, in screening cancers, organ-specific baseline levels to separate cancer samples from normal samples should be determined by considering the time-dependent model, the mass of the transplanted organ, etc. Therefore, based on the well-estimated tissue-derived cfDNA fractions and a set of training datasets, continuous efforts are needed to build different prediction models for different diseases to transfer the estimated tissue-derived cfDNA fractions into a clinical diagnostic decision.
Combine the markers from different omics
In the plasma, besides cfDNAs, cfRNAs, miRNAs and proteins also can be detected. Markers from different omics have different signal abundances and signal intensities. The signal abundance is defined as the number of a type of maker. For example, in CRC, there are 3–6 driven gene mutations, and 33–66 passenger gene mutations, while there are ~2000 loci with DNA methylation alterations. The signal intensity of a type of marker is defined as the range of signal differences between two groups (e.g. normal class versus cancer patients) on markers. In the research of the diagnosis and prognosis of HCC, different noninvasive methods have been proposed based on tumor-derived cfDNA (ctDNA) fragmentation [78, 79, 121], ctDNA methylation [122, 123], ctDNA CNV and mutations [124], cfRNA/miRNA (non-coding RNA) [125], plasma mitochondria DNA (mtDNA) [121] and protein markers in serum [124, 126]. In studying the size profiles and abundances of plasma cfDNAs, the concentration of plasma mtDNAs was used as an indicator to classify HCC patients from healthy subjects [121]. Comparing the signal abundance and signal intensity in those studies, as illustrated in Figure 5, different types of molecule makers have different features in signal abundance and signal intensity. The fragmentation patterns of ctDNA can provide abundant signals but with low signal intensity. The ctDNA methylation markers have a good abundance and medium signal intensity. The number of protein markers is quite less than other types of markers, but the signal intensity of protein markers is the strongest. From this comparison, we also can find that ctDNA CNV and mutations are less abundant than ctDNA methylations and have a medium signal intensity. Furthermore, the prediction performance of these types of markers on early screening of liver cancer is compared, as shown in Table 5. It can be found out that ctDNA methylation markers can achieve a higher AUC [123] than other single types of markers (e.g. cfRNA/miRNA, proteins). Moreover, we can observe that the prediction performance can be improved by combing different types of markers, such as ctDNA somatic mutation markers combined with protein markers [126].
In different development stages of a disease, different types of markers have different signal abundances and signal intensities. Combining the markers from different omics can improve detection sensitivity. For example, in noninvasive cancer screening, DNA fragments with alteration in cancer genomics in terms of methylation and mutation, and other molecules with alteration in cancer cells, could be selected as markers and combined to increase the sensitivity and specificity for diagnosing and locating cancer [127]. In combining the markers from different omics, the contribution of each type of markers in the diagnosis and prognosis should be carefully evaluated, and different combination strategies should be designed for different diseases or different stages of a disease.
In conclusion, the cfDNA mutation-based methods can work well for identifying the fetus-derived cfDNAs and donor-derived cfDNAs but have limited power to identify the cfDNAs derived from a certain disease. The methylation pattern-based methods are very promising and have great potential in noninvasive diagnostics. A persistent effort is needed to extract more high-quality tissue/disease-specific methylation markers with the increasing samples. The cfDNA fragmentation patterns provide new insight for predicting the TOOs, and systematic methods are appealing to be developed for identifying the tissue-specific cfDNA fragmentation patterns. To enable these methods for the clinical diagnosis, the detection sensitivity and prediction accuracy should be improved in several ways, including improving the quality of markers, combining high-quality markers from multi-omics and improving the quality and quantity of samples.
Dead cells release DNA fragments into the plasma, and some DNA fragments carry information indicating their tissues-of-origin.
Three types of signals can be employed to identify the tissues-of-origin of cfDNAs, including cfDNA mutations, methylation patterns and fragmentation patterns.
Methylation markers have a better abundance and medium signal intensity than the other two types of signals for indicating the tissues-of-origin of cfDNAs.
Identifying the tissues-of-origin of cfDNAs provides a very promising way for noninvasively diagnosing diseases and monitoring their development, such as noninvasive prenatal testing, noninvasive cancer screening, transplantation rejection monitoring and parasitic infection detecting.
Improving the quality and quantity of markers can improve the performance of identifying the tissues-of-origin of cfDNAs; combining markers from different omics can enhance the detection sensitivity and prediction accuracy of noninvasive diagnostics.
Xiaoqing Peng is an associate professor in the Center for Medical Genetics & Hunan Key Laboratory of Medical Genetics, School of Life Sciences, Central South University, Changsha, China; Institute of Molecular Precision Medicine, Xiangya Hospital, Key Laboratory of Molecular Precision Medicine of Hunan Province, Central South University, Changsha, China. Her research interest focuses on epigenetics and proteomics.
Hong-Dong Li is an associate professor in the School of Computer Science and Engineering and Hunan Provincial Key Lab on Bioinformatics at Central South University, Changsha, China. His current research interest focuses on functional genomics and systems biology.
Fang-Xiang Wu is a professor in the Department of Mechanical Engineering and the Division of Biomedical Engineering at the University of Saskatchewan, Saskatoon, Canada. His current research interests include Bioinformatics and Systems biology.
Jianxin Wang is a professor in the School of Computer Science and Engineering and Hunan Provincial Key Lab on Bioinformatics at Central South University, Changsha, China. His researches are performed within the fields of computational genomics and proteomics.
Funding
National Natural Science Foundation of China (Nos. 61702555 and U1909208); the National Key R&D Program of China (No. 2018YFC0910504); 111 Project (No. B18059); Hunan Provincial Science and Technology Program (2018WK4001).
Conflict of interest
The authors have declared no conflict of interest.
