


Abstract
Predicting the sensitivity of tumors to specific anti-cancer treatments is a challenge of paramount importance for precision medicine. Machine learning(ML) algorithms can be trained on high-throughput screening data to develop models that are able to predict the response of cancer cell lines and patients to novel drugs or drug combinations. Deep learning (DL) refers to a distinct class of ML algorithms that have achieved top-level performance in a variety of fields, including drug discovery. These types of models have unique characteristics that may make them more suitable for the complex task of modeling drug response based on both biological and chemical data, but the application of DL to drug response prediction has been unexplored until very recently. The few studies that have been published have shown promising results, and the use of DL for drug response prediction is beginning to attract greater interest from researchers in the field. In this article, we critically review recently published studies that have employed DL methods to predict drug response in cancer cell lines. We also provide a brief description of DL and the main types of architectures that have been used in these studies. Additionally, we present a selection of publicly available drug screening data resources that can be used to develop drug response prediction models. Finally, we also address the limitations of these approaches and provide a discussion on possible paths for further improvement. Contact: [email protected]
Computational methods are essential to make sense of the several large drug screening data sets made available to the public in recent years.
The 1st studies that have used DL to predict the effects of single drugs or drug combinations on cancer cell lines have shown promising results, with the majority outperforming traditional ML models.
The future success of DL in this field will depend not only on the improvement of the generalization capacity of the models but also their interpretability and their ability to translate to the clinic.
1 Introduction
Precision medicine represents a challenge for this century, with the search for personalized cancer treatments being one of the most prominent endeavors in the field. The hope with precision medicine is that by profiling tumors at the molecular level it will be possible to design treatments specifically adapted to the characteristics of a particular molecular subgroup of tumors or even individual patients, improving treatment outcomes. The success of precision medicine relies, therefore, on effectively translating the combination of clinical data with genomics and other ‘omics’ data into prognostic and predictive biomarkers.
Besides the characterization of tumors at the molecular level, another relevant task for precision oncology is to generate drug response profiles, spanning a wide range of drugs and cancer subtypes. In recent years, data from several large-scale drug screening initiatives [1–4] have been made publicly available, helping to further the field of precision oncology. These projects have screened known and candidate anti-cancer drugs against cancer cell lines, which have been extensively characterized at the molecular level. The data from these initiatives have already enabled the identification of putative drug response biomarkers using computational methods (elastic net regression) [1, 5] and the development of predictive models, such as elastic net and random forest (RF) models to predict drug sensitivity [6].
Indeed, computational methods are crucial to make sense of these large drug screening data sets. Although high-throughput screening is a common 1st step in drug discovery, experimentally screening all possible candidate drugs or drug combinations is not feasible, for both practical and financial reasons [7, 8]. Therefore, the development of computational strategies to predict drug response is essential to limit the search space and guide the discovery process, reducing the experimental effort required. Since performing screening assays in cell cultures is currently the only alternative enabling high-throughput drug screening, computational methods are also needed to translate the knowledge obtained from cell line-based screens to drug response profiles of specific patients.
A variety of computational methods for drug response prediction and the discovery of drug response biomarkers have already been reported in the literature, including machine learning (ML)-based approaches such as support vector machines (SVMs) [9], Bayesian multitask multiple kernel learning [10, 11], RFs [6, 12–14] and neural network [15] models. Nevertheless, there is still much room for improvement of these computational models in terms of predictive performance and model generalizability [16].
A particular subclass of ML algorithms referred to collectively as deep learning (DL) might be well suited to the prediction of drug response based on pharmacological and cell line omics data. Since DL methods can handle large volumes of high-dimensional and noisy data, they may be able to capture the nonlinear and complex relationships typical of biological data better than other types of ML algorithms. Furthermore, DL has already been successfully applied to a wide range of other drug discovery-related tasks. For most of these tasks, the predictive performance of DL-based models is at least on par with other ML approaches, if not better [17]. For instance, DL has been shown to outperform traditional ML approaches in the prediction of compound activity [18–20], compound toxicity [21] and other compound properties [22]. Nevertheless, the application of DL to drug response prediction problems has been under-explored until very recently.
In this article, we review the state-of-the-art of DL-based drug response prediction methods. First, we introduce the concept of deep learning and describe the main types of DL architectures (Table 1 defines some of the technical terms that will be used throughout the manuscript). We then present a selection of publicly available drug screening data resources that can be used to develop drug response prediction models. Next, we briefly describe and comment on the DL models for drug response prediction that have been reported in the literature. We address both the strengths and limitations of these models and discuss suggestions for further improvement. The insights gleaned from these studies will undoubtedly be useful in guiding the future development of computational methods for the rational design of effective anti-cancer treatments.
Terminology box
| Term | Definition |
|---|---|
| Activation function | A function that each unit in a neural network applies to the weighted sum of its inputs to calculate its output value [23] |
| Attention mechanism | A method from the field of machine translation that identifies which parts of an input sequence are relevant to the output [24] |
| Backpropagation | An algorithm that propagates the prediction error of a neural network backwards, from the output layer to the input layer so that the gradients with respect to the weights of each unit can be computed [23] |
| Drug response biomarker | A biological characteristic that is predictive of the response of a tumor to a given treatment [25] |
| Classification | A supervised learning task where the output variable is categorical |
| Cross-validation | A model validation technique where data are divided into several subsets (folds) that are successively held out from the training set and used to estimate model performance |
| Data augmentation | Increasing the number of training data points |
| Discriminative model | Learns the conditional probability of the output given the inputs [26] |
| Dose-response relationship | The relationship between the observed effect (response) of a drug and its concentration (dose) [27] |
| Dropout | A technique that ‘drops’ some neurons from a neural network in each iteration to reduce overfitting [28] |
| Drug sensitivity | The susceptibility of a cell line/tumor to a drug |
| Drug synergy | A phenomenon where the response to a combination is enhanced, going beyond the effect that would be expected based on the responses to each individual drug [29] |
| End-to-end learning | A learning approach where feature learning/extraction and outcome prediction are automatically performed by a single neural network instead of requiring multiple steps |
| Ensemble learning | Methods that combine the predictions of multiple ML models (base models), forming a single model |
| Feature selection | A method to reduce model complexity by only considering smaller subsets of the original variables. |
| Generative model | Generative models learn the joint probability distribution of input and output variables being able to generate new inputs for a given distribution [26] |
| High-throughput screening | In the context of this paper, high-throughput screening refers to experiments where many candidate drugs are screened at varying concentrations across a panel of cancer cell lines and response to the drug is measured [1] |
| Hyperparameter | A model parameter that is not learned during training and must be set beforehand |
| Loss function | A function that measures the penalty associated with prediction errors [30] |
| Machine learning | A subfield of artificial intelligence that refers to algorithms that can learn information directly from data and make accurate predictions using a model that is inferred from input data alone [31] |
| Molecular descriptors | Experimentally determined or theoretical properties of compounds summarized in numerical form [32] |
| Molecular fingerprints | A representation of the structure in the form of numerical vectors (e.g. binary fingerprints represent the presence of absence of certain chemical substructures within a molecule) [32] |
| Molecular graph | A representation of the structure of a compound in the form of a graph, where nodes represent atoms and edges represent bonds [33] |
| Multimodal learning | Using models that can relate and learn from data from different modalities (i.e. different input data types) [34] |
| Omics data | Fields of study in biology that focus on characterizing particular biological entities and interactions. Genomics studies genomes of organisms, transcriptomics the set of RNA transcripts, epigenomics the epigenetic modifications, proteomics the proteins of an organism and metabolomics the concentration of compounds |
| One-hot encoding | Converting categorical variables into a numerical (binary) form |
| Overfitting | Overfitting occurs when a model fits the training data well but is unable to generalize to unseen data |
| Regression | A supervised learning task where the output variable is continuous |
| Representation learning | The process through which relevant features are learned automatically from the input data |
| Semi-supervised learning | A type of ML task where an estimator is trained on both labeled and unlabeled data to learn a function mapping input variables to output variables. |
| SMILES strings | A representation of compound structures in the form of ASCII strings |
| Supervised learning | A type of ML task where an estimator is trained on labeled data (a data set that contains a set of input features and the corresponding output values) to predict the output for unseen samples of input data |
| (Model) Training (fitting) | The process through which the parameters of a model (in DL, the weights in a neural networks) are estimated |
| Transfer learning | An ML method where a model developed for one prediction task (a pre-trained network) is reused as the starting point for a similar task [35] |
| Unsupervised learning | A type of ML where the goal is for the algorithm to find structure in unlabeled data |
2 Deep learning
DL refers to a distinct class of ML algorithms based on artificial neural networks (NNs), which, as the name suggests, are inspired by their biological counterparts. Artificial NNs consist of several connected layers, each containing multiple units, also called neurons. A shallow NN is composed of an input layer, a single hidden layer and an output layer, while deep neural networks (DNN) are typically composed of multiple processing layers [23]. This characteristic allows these models to learn complex nonlinear functions. Furthermore, unlike most traditional ML methods, DL approaches typically do not require extensive feature selection before training, since they have the ability to learn higher-order representations directly from raw input data [36].
In the hidden or output layers, each unit receives its inputs from the preceding layer. The connections between nodes in adjacent layers, called edges, each have an associated weight, reflecting the relative importance of a given input. Each unit applies an activation function to the weighted sum of its inputs to calculate its output value [23]. This forward propagation of information is continued until the final output values (last layer) are predicted.
Training an NN is an optimization problem, where the goal is to minimize the difference between the predicted output values and the real values, that is, to minimize the error defined by a suitable loss function. Once an input example has been forward propagated until the output layer, the predicted and real output values are compared, and the error is determined using the defined loss function. To train the network, the gradient of the loss function can be calculated, and then the backpropagation algorithm can be applied so that the error is propagated backwards, from the output layer to the input layer [23]. In this manner, the gradients with respect to the weights can be computed. The weights can then be adjusted using gradient methods, such as stochastic gradient descent (SGD) or variants such as the Adam algorithm [37]. Therefore, learning is achieved by iteratively modifying the weights.
There is a wide variety of DL architectures, some of which are illustrated in Figure 1. In the following paragraphs, we will describe the main types DL models that have been applied to the problem of drug response prediction.
![DL architectures that have been used in drug response prediction models. (A) A fully connected feedforward DNN. (B) An RNN and the corresponding computational graph unfolded in time (t-1, t and t+1 denote different time steps); adapted from [23]. (C) A DBN; adapted from [38]. (D) A CNN. (E) An AE. (F) A VAE; μ and σ are vectors of parameters defining the distributions of the latent variables.](https://oup.silverchair-cdn.com/oup/backfile/Content_public/Journal/bib/22/1/10.1093_bib_bbz171/2/m_bbz171f1.jpeg?Expires=1750208846&Signature=1T4Y~SDJrg9D9Mmb9zN53Ph56J~Ak-MWheWTDE1~8~PoSA6ZNIf5sj-gGUjbU~xNCxsTH-OuWKEcb-1fN4yvZffwRYUGawmRn0-DBmm6nUm3VCqRgs1lL8AUzlRInNTj~Dxmig6qYKqo6D-RLql76rLYOUyF43QB49eM6R3uVp-LClaRyo0MV1vSPNoWZflS5k2DZJ13qr9dGUKYExWCuhVzdI5GqrN5mZ-YIISt~m2uUP0OmuT3ltPj~jfc890zRY2Xu-1qjxZWxo9Dybgv07-lk0xB~I8n~GwkLrZCsOCSW6dawU8eoFdTVz8QCSgQC2lyiUhoxYk-W2UTiJchjQ__&Key-Pair-Id=APKAIE5G5CRDK6RD3PGA)
DL architectures that have been used in drug response prediction models. (A) A fully connected feedforward DNN. (B) An RNN and the corresponding computational graph unfolded in time (t-1, t and t+1 denote different time steps); adapted from [23]. (C) A DBN; adapted from [38]. (D) A CNN. (E) An AE. (F) A VAE; μ and σ are vectors of parameters defining the distributions of the latent variables.
The simplest DL models are fully connected DNNs (Figure 1a). They are similar to the previously described shallow (single hidden layer) artificial NNs but have a greater number of hidden layers. These networks are feedforward networks, which means that they constitute an acyclic graph in which information flows in only one direction, from input nodes to output nodes [35]. DNNs have already been used to estimate drug response in cancer cell lines [39]. More complex models composed of multiple subnetworks (described in Section 5) also usually use a DNN as the final subnetwork that predicts drug response.
Convolutional neural networks (CNN) (Figure 1d) represent another type of feedforward DL model [40]. As the name implies, these NNs apply convolutions in some of their layers, usually in the initial layers of the network. Other common operations in CNNs include pooling and normalization, while the final layers of these networks are usually fully connected layers to allow for supervised classification or regression. Unlike DNNs, CNNs have sparse or local connectivity, which means that units in one layer are only directly connected to certain units in the previous layer [23]. This characteristic helps to preserve the local structure of the data [41]. CNNs also have comparatively fewer parameters to learn as the weights are shared, making them easier to train [23]. Two-dimensional CNNs are particularly well suited to handle input data in the form of a grid (multidimensional arrays), such as images [23], and they can be used for drug response prediction if the input data is represented in the required format (e.g. using compound images as input [42]). One-dimensional CNNs are more appropriate for data in the form of sequences, such as compound Simplified Molecular-Input Line-Entry System (SMILES) strings.
Recurrent neural networks (RNNs) (Figure 1b) are a distinct class of NNs characterized by the existence of cycles in the networks, typically formed due to edges that connect adjacent time steps (recurrent edges) [43]. Nodes with incoming recurrent connections can receive as input not only the current data point but also the values of hidden units from previous time steps. This makes RNNs suitable to model data that are sequential in nature, such as natural language or time series. An RNN can be unfolded in time and represented as deep feedforward networks with the same weights being shared among layers [23]. In drug response prediction models, feature encoders with recurrent layers can be used to learn representations from SMILES strings, for example [44].
Unsupervised DL methods also exist. Autoencoders (AEs) are typically used for dimensionality reduction and feature representation learning before using other ML or DL methods for prediction (Figure 1e). An AE is a NN that learns to reconstruct its inputs [45]. By restricting the number of units in the hidden layers of the network and creating a bottleneck, the AE can learn a low-dimensional latent representation of the original input data, called a ‘code’. A basic AE is therefore composed of two parts: an encoder, which produces the code; and a decoder, which attempts to reconstruct the input from the code [46]. Deep AEs are formed by stacking several AEs. AEs can be used to encode both compounds and omics data, and these learned representations can be fed into a predictive model to estimate drug response [47–49].
There are other variants of AEs, such as variational autoencoders (VAEs) [50], for instance (Figure 1f). A VAE is a generative model based on approximate inference. A VAE models the underlying probability distribution of the latent representations of the inputs. Like other AEs, VAEs are also composed of two networks. The encoder network learns a Gaussian distribution of the possible values of the latent representation from which a given sample could have been generated, while the decoder learns the distribution of the possible values of a sample that could be produced given a certain latent representation [50].
A less common type of DL model is the deep belief network (DBN) [51] (Figure 1c). A DBN is a generative model that consists of several layers of latent variables. The connections between the 1st two layers are undirected, while the connections between the remaining layers are all directed. DBNs can be considered stacks of restricted Boltzmann machines (RBMs) [52], which are composed of a visible layer and a hidden layer, with undirected connections between the two layers and without connections between units in the same layer. They can thus be trained layer by layer [51]. With the addition of a discriminative fine-tuning step at the end, DBNs can also be transformed into discriminative models [51]. DBN models have already been used to predict the response of cancer cell lines to drug combinations [53].
DL models can be implemented using one of the many open source DL libraries that are available. Some of the most popular DL libraries are Python-based, including PyTorch [54] and the TensorFlow [55] Python application programming interface (API). Keras [56] is a higher-level DL API written in Python that facilitates the use of other lower-level libraries such as TensorFlow. Most of the models described in this review were implemented using one of these Python libraries. Another Python library that may be of interest to researchers in this field is DeepChem [57], a DL framework built on top of TensorFlow that offers implementations of chemistry-specific DL architectures and featurization techniques.
3 Data resources
The high-throughput screening of compounds is a common step in the drug discovery process. Its purpose is to determine which compounds or combinations of compounds will potentially result in effective treatments. In recent years, several large-scale anti-cancer drug screens have been undertaken, the results of which have been made available through public repositories. Projects such as Genomics of Drug Sensitivity in Cancer (GDSC) [2], Cancer Cell Line Encyclopedia (CCLE) [1], Cancer Therapeutics Response Portal (CTRP) [3, 4] and NCI-60 [58] provide access to drug sensitivity profiles for a wide variety of cancer cell lines. An extended list of single-drug screening data sets is provided in Table 2. Large pan-cancer drug combination screening data sets have also been made available to the public (Table 2). These data sets can serve as the basis for the development of DL-based drug response prediction models.
In addition to the dose-response data gathered from the high-throughput screening experiments, some of these databases also provide access to omics data characterizing the cancer cell lines that the compounds were screened against. The cancer cell lines used in the National Cancer Institute 60 Human Cancer Cell Line Screen (NCI-60), CCLE and GDSC screening panels, for example, have all been extensively characterized at the molecular level. All three projects provide genomic, transcriptomic and epigenomic data characterizing the cell lines, and proteomics [60, 66] and metabolomics [61] data are available for the NCI-60 and CCLE cell lines. If there is a considerable overlap between cell lines, then the omics data available from these databases can also be useful to extend other screening data sets that only include pharmacological dose-response data, such as the CTRPv2 data set, for example.
Data sets from single-drug pan-cancer screening studies
| Data set | Website | # Compounds | # Cell lines | PHARM | MUT | CNV | mRNA EXP | miRNA EXP | METHYL | PROT | METAB |
|---|---|---|---|---|---|---|---|---|---|---|---|
| NCI-60[58] | https://dtp.cancer.gov/discovery_development/nci-60/ | ˜50 000 | 60 | x | x | x | x | x | x | x | x |
| GlaxoSmithKline [59] | 19 | 311 | x | ||||||||
| CCLE [1, 60, 61] | https://portals.broadinstitute.org/ccle | 24 | 479* | x | x | x | x | x | x | x | x |
| GDSC1 [2] | https://www.cancerrxgene.org/ | 320 | 988 | x | x | x | x | x | |||
| GDSC2 [2] | https://www.cancerrxgene.org/ | 175 | 810 | x | x | x | x | x | |||
| CTRPv1 [3] | https://portals.broadinstitute.org/ctrp.v1/ | 354 | 242 | x | |||||||
| CTRPv2 [4] | https://portals.broadinstitute.org/ctrp/ | 481 | 860 | x | |||||||
| gCSI [62] | http://research-pub.gene.com/gCSI-cellline-data/ | 16 | 410 | x | x | x | x | ||||
| FIMM [63] | 52 | 50 | x |
*1457 characterized cell lines in total PHARM, Pharmaceutical data; MUT, mutation data; CNV, copy number variation data; mRNA EXP, mRNA expression data; miRNA EXP, microRNA expression data; METHYL, methylation data; PROT, proteomics data; METAB, metabolomics data
The CCLE, GDSC and NCI-60 projects only offer baseline cell line data, that is, data obtained before treatment. The Connectivity Map (CMap) [67, 68] and the Library of Integrated Network-Based Cellular Signatures (LINCS) [69, 70] projects are resources that provide data on the transcriptional responses of cancer cells after treatment with small molecules. Another project recently analyzed the response of cells to treatment with small molecules at the proteomic and epigenomic levels [71]. These cellular response signatures can complement the data from other drug screening initiatives and may be a very valuable source of information when building drug response prediction models.
Smaller-scale and more specific (single cancer) drug screening data sets that were not included in Table 2 or Table 3 may cover other cell lines or compounds that were not contemplated by the larger screening initiatives. These data sets may be used to fine-tune models trained on larger pan-cancer data sets, making them more specific to certain tumor types.
Ideally, the data sets used to train drug response prediction models would come from patient cohorts, as cancer cell lines may not be representative of their tumors of origin [72, 73]. Although high-throughput screening has already been attempted using patient-derived xenografts [74] and organoids [75], the vast majority of anti-cancer drug response data sets are currently from cell line-based screening experiments. As a result, DL models are usually trained on the more abundant cell line-based screening data. Nevertheless, patient-derived data can be particularly useful to validate and refine drug response prediction models trained on in vitro data, improving their clinical applicability. For example, patient-level data can be incorporated into DL models of cellular drug response by using the molecular data characterizing patient tumors in a pre-training step, as proposed in a recent study [49]. Large-scale patient-level omics data sets can be obtained from resources such as the Genomic Data Commons (GDC) Portal [76] and the International Cancer Genome Consortium (ICGC) [77].
Data sets from large-scale pan-cancer drug combination screening studies.
| Data set | Website | # Compounds | # Combinations | # Cell lines | PHARM | MUT | CNV | mRNA EXP | miRNA EXP | METHYL | PROT | METAB |
|---|---|---|---|---|---|---|---|---|---|---|---|---|
| Merck Compound Screen [64] | 38 | 583 | 39 | x | ||||||||
| NCI-ALMANAC [65] | https://dtp.cancer.gov/ncialmanac | 104 | 5232 | 60 | x | x | x | x | x | x | x | x |
| AstraZeneca-Sanger DREAM [8] | https://www.synapse.org/∖#!Synapse:syn4231880 | 118 | 910 | 85 | x |
PHARM, Pharmaceutical data; MUT, mutation data; CNV, copy number variation data; mRNA EXP, mRNA expression data; miRNA EXP, microRNA expression data; METHYL, methylation data; PROT, proteomics data; METAB, metabolomics data
Prior knowledge from additional data sources can complement and enrich the data from these publicly available drug screening data sets. Further information on the compounds screened in these experiments can be retrieved from PubChem [78], ChEMBL [79] or DrugBank [80], for instance. Information on drug targets and the pathways underlying drug response can be acquired from public databases, such as search tool for interactions of chemicals (STITCH) [81] and the Guide to Pharmacology [82].
External data sources can also be useful when exploring cell line omics data. The Catalogue Of Somatic Mutations In Cancer (COSMIC) database [83] is an important source of information on somatic mutations in cancer. Project Achilles [84], now a part of Cancer Dependency Map (DepMap) [85], is a project that aims to provide information on gene essentiality for cancer cell lines that have been extensively characterized at the molecular level. The Pharmacogenomics Knowledgebase (PharmGKB) [86] provides information regarding the influence of genetic variation on drug response. Besides these, many other sources of prior biological knowledge can be leveraged to enrich the drug response data sets and create more biologically informed models.
The Dialogue on Reverse Engineering Assessment and Methods (DREAM) challenges initiative is a community effort aimed at developing new computational approaches to address important biological and human health questions. In recent years, the DREAM community has proposed several challenges, which can be useful sources of drug response data. In 2012, the community launched the National Cancer Institute (NCI)-DREAM Drug Sensitivity [10] and Drug Synergy [7] Challenges. The Drug Sensitivity challenge was aimed at building models to predict and rank the sensitivity of breast cancer cell lines to individual compounds, while the goal of the Drug Synergy challenge [7] was to predict the effect of drug combinations on a diffuse large B-cell lymphoma cell line. In September 2015, the DREAM community launched the AstraZeneca-Sanger Drug Combination Prediction challenge [8] to gather more insight on the factors underlying drug synergy and to accelerate the development of methods to predict drug combination effects. Challenge participants had access to a drug combination screening data set provided by AstraZeneca which has now been published [8].
Other similar, but not cancer-specific, DREAM challenges can also be important sources of data that can complement the large anti-cancer drug screening data sets. For instance, the NIEHS-NCATS-UNC DREAM Toxicogenetics Challenge [87], which was aimed at predicting the cytotoxicity of compounds in humans, provides access to data that can be used to determine the toxic effects of anti-cancer drugs on patients.
4 Implementing deep learning workflows for drug response prediction
Most drug response prediction workflows follow the same general steps, which are shown in Figure 2. These include the following:
Selecting a DL framework to implement the model.
Defining the prediction problem (drug sensitivity versus drug synergy prediction).
Selecting the data set(s) used to train the model (see Tables 2 and 3 for lists of data sets for each type of problem).
Defining which data types will be used as inputs (Figure 3 provides an overview of the most common types of input data and output variables used in these models, as well as some of the most common preprocessing steps).
Deciding how multiple data types will be handled. Users must decide whether they will concatenate all features irrespective of data type or if they will use a multimodal strategy with separate feature-encoding subnetworks for each data type.
Defining the model architecture. Input data type will determine the types of DL architectures that can be used for each network, as well as the preprocessing methods that need to be applied. For example, RNN-based architectures will require input data that is sequential in nature, such as SMILES strings.
Preprocessing and selecting appropriate data representations.
Training the model and tuning hyperparameters. Hyperparameter optimization can be achieved through manual tuning, by performing a search across all or a subset of possible combinations of user-specified values or by using other optimization techniques.
Evaluating model performance. Researchers need to select appropriate scoring metrics, define how the screening data set will be split into training and validation/test sets and select any external data sets that will be used to validate the model.
Interpreting and explaining model predictions. Many of the model explanation methods mentioned in Section 8 have been implemented as Python packages and can be easily incorporated into the workflow. Other post hoc analyses of the predictions can also be performed, as described in many of the studies reviewed here.
![Input and output data types commonly used when building DL-based drug response prediction models. Compound structures are usually represented as SMILES strings in drug screening data sets. SMILES can be fed directly into DL models that learn embeddings, or they can be used to calculate molecular descriptors or molecular fingerprints. SMILES strings can also be one-hot encoded, transformed into the corresponding molecular graphs, which can then be used as input to graph convolutional networks, or converted into an image of the compound, which can be used as input to regular convolutional neural networks. Cell line input features are usually somatic mutations, copy number variations and gene expression data, although other omics data (epigenomics, proteomics etc.) can also be incorporated into the models. Somatic mutations are usually binarized (presence/absence of an alteration). Copy number variations can be summarized as binary features, as scores (e.g. G-scores [88]), or in some other form. Gene expression features are usually continuous features, which have undergone some form of normalization. Target information, when used, is usually used to derive features that reflect the pathways a particular target is associated with. The outputs of drug response prediction models are values describing the dose–response relationships. For single drugs, this is usually half maximal inhibitory concentration ($IC^{50}$), 50% growth inhibition $(GI^{50})$ or area under the dose–response curve (AUC). For drug combinations, the output variable is usually a score that quantifies drug combination effects based on a given reference model, such as the Loewe additivity [89] or Bliss independence [90] models.](https://oup.silverchair-cdn.com/oup/backfile/Content_public/Journal/bib/22/1/10.1093_bib_bbz171/2/m_bbz171f2.jpeg?Expires=1750208846&Signature=DJ0RFKAsS0RixT-aer4Hhyn7mMH19YI~EVtRoqPXVbOV19amhLuGhgRIYq9SEqTaNVeE8~bEyMVX~rs4u~nute2wbW2nqLmciIiB0h5lUsNqO~tuN71fJu~nYRvTCUnM7cwSKSzpVCfm12CLFfs0FUeaGZ86gUOoonPgf5vXr0DchpEK8QSc5KRhKJUW2vMyO0RJ0V-qBWJ6q8rskw~2RbirVRQsdC7NCcEzzFOJEc19H5kvZ52l10e0NG-BmXBYFn-A01WRps4h0pNYcJVQMvL1ZNoHAOds-xmxrdnr~NnRJAMlIusRxH6HKncBmCXtCFQPNYv~HX0WkFH7ieROnw__&Key-Pair-Id=APKAIE5G5CRDK6RD3PGA)
Input and output data types commonly used when building DL-based drug response prediction models. Compound structures are usually represented as SMILES strings in drug screening data sets. SMILES can be fed directly into DL models that learn embeddings, or they can be used to calculate molecular descriptors or molecular fingerprints. SMILES strings can also be one-hot encoded, transformed into the corresponding molecular graphs, which can then be used as input to graph convolutional networks, or converted into an image of the compound, which can be used as input to regular convolutional neural networks. Cell line input features are usually somatic mutations, copy number variations and gene expression data, although other omics data (epigenomics, proteomics etc.) can also be incorporated into the models. Somatic mutations are usually binarized (presence/absence of an alteration). Copy number variations can be summarized as binary features, as scores (e.g. G-scores [88]), or in some other form. Gene expression features are usually continuous features, which have undergone some form of normalization. Target information, when used, is usually used to derive features that reflect the pathways a particular target is associated with. The outputs of drug response prediction models are values describing the dose–response relationships. For single drugs, this is usually half maximal inhibitory concentration (|$IC^{50}$|), 50% growth inhibition |$(GI^{50})$| or area under the dose–response curve (AUC). For drug combinations, the output variable is usually a score that quantifies drug combination effects based on a given reference model, such as the Loewe additivity [89] or Bliss independence [90] models.
The usual steps in a DL-based drug response prediction workflow. A drug screening dataset is obtained from GDSC, CCLE or other resources. Complementary data and prior knowledge from other databases can also be collected at this stage. The data are then preprocessed according to data type. This results in a set of drug features and multiple omics features characterizing the cell lines. Afterwards, these distinct sets of features are either merged into a single training set or fed into separate encoding subnetworks. The model is then fit on the training set. Model hyperparameters can be optimized during the training stage. Different model validation techniques are used to evaluate model performance and select the best model. After training, the model can be used to predict drug response for new samples.
To illustrate these steps, we present a hypothetical drug response prediction workflow for the problem of drug sensitivity prediction. The 1st steps could be selecting the GDSC data set for model training and deciding to use gene expression data and one-hot encoded SMILES strings as input data. We could opt to use a multimodal model with a subnetwork for gene expression composed of fully connected layers and an encoding subnetwork for compounds that is a 1D CNN, both linked to a final prediction DNN. Such a network could be implemented using the Keras Python package. Hyperparameter optimization could be performed using grid search with cross-validation. After training the model, a model interpretability tool such as the shap Python package could be used to explain the model and determine feature importance. Model performance could be evaluated using the leave-drug-out and leave-cell-line out approaches, and the model could be further validated on the CCLE data set. Considering that the problem is a regression task, we would use regression-specific scoring metrics such as |$R^2$| to measure model performance.
The workflow would be very similar for a hypothetical drug synergy prediction problem. The main differences would be the screening data sets used for training and external validation, the output variable (measuring drug combination effects instead of drug sensitivity) and the model architecture would have to be adapted to allow for more than one drug. Since the hypothetical NN described in the previous example is modular and already includes a compound-encoding subnetwork, it could simply be extended by, for example, adding a subnetwork for the 2nd compound that could share weights with the 1st compound subnetwork.
5 Drug response prediction models
Until recently, DL had seldom been applied to pharmacogenomics problems such as drug response prediction, but interest in DL approaches has greatly increased in the past few years. In this section, we first introduce readers to the main steps involved in DL-based workflows for drug response prediction, and then we briefly review the DL models for drug response prediction that have been published so far. For the most part, we did not consider preprints that have not been peer-reviewed yet. Table 4 summarizes the 1st few studies that have included DL in some form in their drug response prediction workflows. Tables 5 and 6 summarize the performance scores achieved by DL-based drug response prediction models for single drugs and drug combinations, respectively, as reported by the original studies.
Published studies that have used DL for drug response prediction
| Study | Model | Training data sets | Input data types | Prediction task |
|---|---|---|---|---|
| Ding et al. [47] | Deep AEs + elastic nets/SVMs | GDSC | MUT, CNV, mRNA EXP | Drug sensitivity |
| Dr.VAE [91] | VAE + logistic regression | Cmap & CTRPv2 | mRNA EXP (before & after treatment) | Joint modeling of drug sensitivity & drug perturbation signatures |
| DeepDSC [48] | Stacked AE + DNN | CCLE & GDSC | mRNA EXP, FP | Drug sensitivity |
| DeepDR [49] | DNN with separate feature-encoding subnetworks for each data type (encoders pre-trained on patient data) | GDC & CCLE & GDSC | MUT, mRNA EXP | Drug sensitivity |
| PaccMann [44] | DL models with a gene expression encoder with an attention mechanism and a compound encoder (bRNN, SCNN, SA, CA or MCA) | GDSC | mRNA EXP, SMILES | Drug sensitivity |
| MOLI [92] | DNN with separate feature-encoding subnetworks for each data type | GDSC | MUT, CNV, mRNA EXP | Drug sensitivity |
| tCNNS [93] | 1D CNN, with separate encoders for drugs and genomic data | GDSC | MUT, CNV, SMILES | Drug sensitivity |
| KekuleScope [42] | CNN models pre-trained on ImageNet | ChEMBL | Compound images (Kekulé structures) | Drug sensitivity |
| Matlock et al. [94] | Heterogeneous ensembles that include DNNs | CCLE, GDSC, or synthetic data | mRNA EXP and/or DSCRPTR, target information | Drug sensitivity |
| ELDAP [95] | Heterogeneous ensembles that include DNNs | CCLE, GDSC, LINCS | mRNA EXP, drug activity and cell line sensitivity signatures derived from drug-induced gene expression profiles | Drug sensitivity |
| CDRScan [96] | Ensemble of 5 CNNs | COSMIC, GDSC | MUT, FP & DSCRPTR | Drug sensitivity |
| DeepSynergy [39] | DNN | GDSC & Merck Compound Screen | mRNA EXP, FP & other compound features | Drug synergy |
| Xia et al. [97] | DNN with separate feature-encoding subnetworks for each data type | NCI-ALMANAC & NCI-60 | mRNA EXP, PROT, miRNA EXP, DSCRPTR | Drug synergy |
| Chen et al. [53] | DBN | AstraZeneca-Sanger DREAM & GDSC | mRNA EXP, ontology fingerprints | Drug synergy |
| ‘DMIS new model’ [8] | DL model with four different feature-encoding modules | AstraZeneca-Sanger DREAM & GDSC | MUT, target, drug & cell line-related features | Drug synergy |
MUT, mutation data; CNV, copy number variation data; mRNA EXP, mRNA expression data; miRNA EXP, microRNA expression data; PROT, proteomics data; SMILES, Simplified Molecular-Input Line-Entry System strings; FP, molecular fingerprints; DSCRPTR, molecular descriptors; bRNN, bidirectional recurrent neural network; SCNN, stacked convolutional neural network; SA, self-attention; CA, contextual attention; MCA, multichannel convolutional attentive
Performance scores for some of the drug response prediction models for single compounds referred to in this review
| Model | Screening data set | Validation scheme | MSE | RMSE | |$R^2$| | r | |$\textit{r}_s$| | AUROC | AUPRC | TPR | TNR |
|---|---|---|---|---|---|---|---|---|---|---|---|
| Ding et al. [47] (per-drug results) | GDSC | 25-fold CV | 1.96 | 0.82 | 0.82 | ||||||
| Ding et al. [47] (per-cell line results) | GDSC | 25-fold CV | 0.80 | 0.82 | |||||||
| Ding et al. [47] | CCLE | External test set | 0.67 | ||||||||
| Dr. VAE (per-drug models) | CTRPv2 | 100 train-validation-test splits (20 x 5-fold CV) | 0.706 | 0.718 | |||||||
| DeepDSC [48] | CCLE | 10-fold CV | 0.23 | 0.78 | |||||||
| DeepDSC [48] | GDSC | 10-fold CV | 0.52 | 0.78 | |||||||
| DeepDSC [48] | CCLE | Leave-one-tissue-out | 0.28 | 0.73 | |||||||
| DeepDSC [48] | GDSC | Leave-one-tissue-out | 0.64 | 0.66 | |||||||
| DeepDSC [48] | CCLE | Leave-one-drug-out | 0.61 | 0.05 | |||||||
| DeepDSC [48] | GDSC | Leave-one-drug-out | 1.24 | 0.04 | |||||||
| DeepDR [49] | GDSC | 100 train-validation-test splits | 1.96 (median) | ||||||||
| PaccMann [44] (bRNN) | GDSC | 25-fold CV (only different cell lines & drugs in test fold) | 0.118 | ||||||||
| PaccMann [44] (SCNN) | GDSC | 25-fold CV (only different cell lines & drugs in test fold) | 0.133 | ||||||||
| PaccMann [44] (SA) | GDSC | 25-fold CV (only different cell lines & drugs in test fold) | 0.112 | ||||||||
| PaccMann [44] (CA) | GDSC | 25-fold CV (only different cell lines & drugs in test fold) | 0.110 | ||||||||
| PaccMann [44] (MCA) | GDSC | 25-fold CV (only different cell lines & drugs in test fold) | 0.120 | ||||||||
| tCNNS [93] | GDSC | 50 train-validation-test splits (80%/10%/10%) (different interaction pairs in each set) | 0.027 | 0.826 | 0.909 | ||||||
| tCNNS [93] | GDSC | Leave-one-tissue-out | 0.039 | 0.665 | 0.818 | ||||||
| CDRScan [96] | GDSC | train-test split (95%/5%) | 1.069 | 0.843 | 0.98 | ||||||
| CDRScan [96] | GDSC | 5-fold CV | 0.847 |
MSE, mean squared error; RMSE, root mean squared error; MAE, mean absolute error; |$R^2$|, coefficient of determination; r, Pearson correlation coefficient; |$\textit{r}_s$|, Spearman’s rank correlation coefficient; AUROC, area under the receiver operating characteristic curve; AUPRC, area under the precision-recall curve; TPR, true positive rate/recall/sensitivity; TNR, true negative rate/specificity; CV, cross-validation; bRNN, bidirectional recurrent neural network; SCNN, stacked convolutional neural network; SA, self-attention; CA, contextual attention; MCA, multichannel convolutional attentive
Performance scores for some of the drug response prediction models for drug combinations referred to in this review
| Model | Drug response data set | Validation scheme | MSE | RMSE | MAE | |$R^2$| | r | |$\textit{r}_s$| | AUROC | AUPRC | TPR | TNR | ACC | BACC | PREC | Κ | F1 |
|---|---|---|---|---|---|---|---|---|---|---|---|---|---|---|---|---|---|
| DeepSynergy [39] | Merck Compound Screen | 5-fold stratified nested CV (leave-combinations-out) | 255.49 | 15.91 | 0.73 | 0.90 | 0.59 | 0.57 | 0.95 | 0.92 | 0.76 | 0.56 | 0.51 | ||||
| DeepSynergy [39] | Merck Compound Screen | Leave-drugs-out | 435.92 | 19.90 | 0.48 | ||||||||||||
| DeepSynergy [39] | Merck Compound Screen | Leave-cell-lines-out | 405.40 | 18.74 | 0.57 | ||||||||||||
| Xia et al. [97] | NCI-ALMANAC | 5-fold stratified CV | 0.0158 | 0.0833 | 0.9440 | 0.972 | 0.965 | ||||||||||
| Chen et al. [53] | AstraZeneca-Sanger DREAM challenge | Leave-one-out | 0.602 | 0.715 | 0.654 |
MSE, mean squared error; RMSE, root mean squared error; MAE, mean absolute error; |$R^2$|, coefficient of determination; r, Pearson correlation coefficient; |$\textit{r}_s$|, Spearman’s rank correlation coefficient; AUROC, area under the receiver operating characteristic curve; AUPRC, area under the precision-recall curve; TPR, true positive rate/recall/sensitivity; TNR, true negative rate/specificity; ACC, accuracy; BACC, balanced accuracy; PREC, precision; Κ, Cohen’s kappa; F1, F1 score; CV, cross-validation
5.1 Predicting single-drug sensitivity
Unlike many traditional ML algorithms, DL can be used not only to predict the outcome of single-drug or combination anti-cancer treatments but also to directly learn internal, lower-dimensional representations of the input data. This reduces the need for the explicit calculation of molecular features or extensive feature selection prior to training, as the features that are most predictive of drug response are automatically learned during the training process.
Some research groups have investigated the use of AEs for unsupervised feature learning and dimensionality reduction as a 1st step in the drug response prediction workflow. Ding et al. [47] recently showed that deep AEs are able to capture relevant information on the state of tumor cells prior to treatment. In this study, deep AEs were used to derive compressed representations from input data consisting of somatic mutations, copy number variations (CNVs) and gene expression data. The learned features were subsequently used to train elastic net classifiers to predict drug sensitivity in cancer cell lines. The encoded representations improved model performance, especially for drugs that were not well modeled when using either the original features or a selection of known genomic markers of drug sensitivity as input.The high sensitivity [true positive rate (TPR)] and specificity [true negative rate (TNR)] scores (5) show that the model was able to correctly identify drug sensitivity/non-sensitivity, but the modest area under the receiver operating characteristic curve (AUROC) score achieved on an external test set suggests that the model had more difficulty generalizing to data from a different screen experiment.
Dr.VAE [91] is a semi-supervised approach that simultaneously trains a generative model of drug-induced changes in gene expression and a predictor that estimates drug response. As the name suggests, the method uses a VAE to create latent representations of the pre-treatment gene expression profiles. This latent representation is used to predict a latent representation of the corresponding post-treatment gene expression profile. Both latent representations are then fed into a logistic regression classifier to predict drug response. Dr. VAE was compared to other ML methods that were not trained on the same latent representations and was shown to have achieved superior cross-validated AUROC scores. The joint modeling of drug perturbation signatures was key to improve the predictive performance of the drug response classifier.
Other research groups have used DL in a more end-to-end manner to predict drug response. Many of these models take advantage of the modular nature of DL networks when integrating multiple data types. Instead of concatenating different feature types into a single training data set, distinct subnetworks for each type of data are constructed, and then the learned representations are fed into a final prediction subnetwork.
The DeepDSC model [48] uses DL methods both for dimensionality reduction and to predict drug sensitivity. It first employs a stacked deep AE to encode gene expression data characterizing the cancer cell lines as compressed representations. The encoded features were merged with pre-computed molecular fingerprints and then fed into a fully connected predictive network. DeepDSC was trained and evaluated on both GDSC and CCLE. For both data sets, they found that model performance decreased drastically when using the leaving drugs out of the training set, showing that the model is not generalizing well to compounds it has never seen before, despite having achieved relatively high |$R^2$| scores when a 10-fold cross-validation scheme was used.
The modular nature of the models also allows for transfer learning, by reusing parts of networks that have been pre-trained on other data sets. DeepDR [49] is a DL model that predicts drug sensitivity based on the mutation and expression profiles of cancer cell lines or tumors. It consists of three subnetworks, the 1st two of which are a mutation encoder and a gene expression encoder, both pre-trained using data retrieved from the GDC database. The final subnetwork integrates the previous two and predicts half maximal inhibitory concentration (|$IC^{50}$|) values. The model was fully trained on cell line data from CCLE and GDSC and then used to predict drug response in cancer patients. The DeepDR model outperformed linear regression models, SVMs and DNNs without pre-training, having achieved lower mean squared error (MSE) scores (around an 80% improvement over linear regression and SVM models). Furthermore, by analyzing the genomic profiles of GDC patients predicted to be highly sensitive or resistant to a given drug, the authors showed that DeepDR was able to uncover the mechanisms underlying the response of cancer patients to well-known anti-cancer drugs and was also capable of discovering potential therapeutic indications for novel compounds.
PaccMann [44], presented at the NIPS 2018 ‘Machine Learning for Molecules and Materials’ workshop, is another end-to-end DL method for drug sensitivity prediction. It uses baseline gene expression data and SMILES representations of compounds to predict |$IC^{50}$|. SMILES enumeration [98], which takes advantage of the fact that several different SMILES strings can represent a given compound, was employed as a data augmentation strategy. The PaccMann model is composed of a gene expression encoder, a compound encoder and a prediction subnetwork, which takes as input the encoded features. The gene expression encoder includes an attention mechanism, a method borrowed from the machine translation field, which assigns higher weights to the most informative input features. For the compound encoder, the authors evaluated five different methods, having concluded that the encoders that include an attention mechanism performed best. The validation results for each of these models are shown in Table 5.
MOLI [92] is another DL model for drug response prediction that uses distinct encoding subnetworks for each data type. Three separate encoders learn representations for somatic mutations, CNVs and gene expression data, and a final subnetwork uses the concatenated features to classify the response of cancer cells to a given drug. MOLI was trained on cancer cell line data from GDSC and validated on data from patient derived xenografts and patient samples (GDC). When training the network, the authors adopted a unique combined loss function consisting of a binary cross-entropy loss and a triplet loss, which helped to improve model performance. The authors also observed that using multiple omics data was preferable to single omics data and that integrating the different data types after representation learning led to better performance when compared to approaches that merge different feature types before training. MOLI models were originally drug-specific, but the authors found that training on a data set consisting of multiple drugs with the same target improved model performance.
The tCNNS model [93] also consists of separate encoding subnetworks—one that receives one-hot encoded representations of compound SMILES and another for genomic features. The two encoders are linked to a final prediction subnetwork. Both encoding subnetworks are 1D convolutional networks instead of the DNNs used in the previously described models. tCNNS performed well when predicting drug sensitivity for unknown drug-cell line pairs, having achieved high |$R^2$| and Pearson correlation scores (Table 5) that were better than the previously reported models that it was compared to. However, the authors noted that the model performed much worse when making predictions for unknown drugs achieving |$R^2$| and Pearson correlation values close to zero. This is similar to what has been observed for other models [48], and it is a problem that should be more carefully assessed in future studies.
KekuleScope [42] is a unique end-to-end method for drug response prediction. It uses transfer learning by employing CNNs that have been pre-trained on the unrelated ImageNet data set [99]. These pre-trained CNNs were minimally modified and then trained on images of compounds (Kekulé structures) to predict drug sensitivity for eight cell line-specific cytotoxicity data sets from ChEMBL. KekuleScope was able to achieve similar performance to DNNs and RFs trained using Morgan fingerprints as input. The authors found that data augmentation by using modified versions of the compound images greatly improved the predictive performance of the models. The authors also observed that performance increased when the CNNs and the RF fingerprint-based model were joined in simple averaging ensemble. They suggest that this is an indication that the pre-trained CNNs were able to extract compound features containing information that is distinct from that encoded in Morgan fingerprints.
Combining multiple, complementary ML models is a strategy that has been shown to improve the predictive performance of drug response prediction models [10], even if only slightly [8]. Additionally, it increases model robustness [10]. Some recent drug response studies have included DL-based models in ensembles.
Matlock et al. [94] evaluated a variety of ensembles that were trained to predict drug sensitivity, some of which included DNNs. The authors found that an ensemble of five different base models, including a DL model trained on gene expression data, achieved the best performance overall.
Another heterogeneous ensemble, called ELDAP [95], is composed of four different base models, including a multitask DNN with two hidden layers. Apart from the ELDAP ensemble, this study also evaluated the performance of single models and ensembles composed of a single base learner. The results of this assessment showed that ensembles of multitask NNs were able to achieve significantly lower MSE values than single NN models on both the GDSC and CCLE data sets.
CDRscan is an ensemble entirely composed of DL base learners [96]. It consists of five CNNs, four of which adopt a ‘dual convergence architecture’. In the dual convergence models, a series of convolutions are performed on each input data type (mutations and molecular fingerprints) separately. The two sets of convoluted features are then merged and convolution is applied again before predicting the |$IC^{50}$| values for cell line-drug pairs from the GDSC. CDRscan achieved high predictive performance, showing a considerable improvement in terms of |$R^2$| when compared to RF and SVM models (21% and 50% improvement, respectively). The authors found that base models that adopted the dual convergence architecture performed better. They also noted that two of the base models performed better than the ensemble, which suggests that individual DL models might sometimes be sufficient. However, they argue that the ensemble approach improves the robustness and generalizability of the model.
5.2 Predicting drug combination effects
After an initial period of responsiveness, the efficacy of drug-based anti-cancer therapies is often reduced due to the existence of intrinsic or acquired tumor drug resistance mechanisms [100]. A common strategy to overcome drug resistance is the administration of two or more drugs in combination. Drug synergy, the enhancement of combination effects beyond expected, is a highly desirable outcome, as it may increase treatment efficacy without requiring an increase in drug dosage [29]. Once again, computational methods could greatly reduce the experimental effort required, but predicting drug combination effects is an even more complex problem than the prediction of sensitivity to single drugs.
A recent study [39] was the first in the literature to propose the use of DL to predict drug combination effects. The model, named DeepSynergy, is a DNN that uses drug response data, chemical features and gene expression data to predict a drug synergy score. The model was trained using pharmacological data from the Merck Compound Screen [64] and omics data from GDSC [6]. The DNN achieved relatively high performance scores. Wilcoxon signed rank-sum tests confirmed that DeepSynergy performed significantly better than the gradient boosting, RFs, SVMs and elastic net models it was compared to, in terms of several different scoring metrics. It was able to achieve an MSE that was 7.2% lower than the 2nd-best method (gradient boosting) and a 5.8% improvement in terms of Pearson correlation. Nevertheless, the authors noted that DeepSynergy, as well as all of the other evaluated methods, had difficulties predicting drug synergy when presented with data from previously unseen cell lines or compounds [39]. DeepSynergy was also evaluated as a classifier, and results for a variety of scoring metrics were reported. While the high AUROC score seems to be an indication of good predictive performance, other metrics show that this might be overly optimistic. This makes clear that assessing multiple scoring metrics is necessary to fully evaluate the performance of a model.
Another promising DL model for the prediction of drug combination effects was proposed by Xia et al. [97]. The model was trained on data from the large National Cancer Institute-A Large Matrix of Anti-Neoplastic Agent Combinations (NCI-ALMANAC) [65] data set. Similarly to many of the previously described drug sensitivity models, this model consists of separate feature encoding subnetworks for each type of input data (drug descriptors, gene expression, microRNA and proteomics data) and a final prediction subnetwork that estimates growth inhibition. All of the weights and layers in the drug descriptor subnetwork are shared between the two drugs in a given drug combination, allowing data from single-drug experiments to also be used as input. The model was able to achieve |$R^2$|, Pearson correlation and Spearman correlation values that were quite high (see Table 6) when compared to models built for other drug discovery-related prediction tasks. Furthermore, the model was able to correctly identify the majority of the most promising drug combinations. Unfortunately, the model was only evaluated through 5-fold cross-validation. It would have been interesting to see if the model could maintain its high predictive performance when applied to previously unseen drugs or cell lines. A performance comparison to other state-of-the-art methods trained on the same data set is also missing.
The supplementary information provided alongside the recently published AstraZeneca-Sanger Drug Combination DREAM challenge paper [8] also briefly mentions the use of a multimodal DL model to predict drug combination effects. The post-challenge model developed by the DMIS team included four subnetworks that separately encode mutations, target proteins, chemical and pharmacological features, and other cell-line related features, and a final prediction network that predicts a continuous synergy score. When evaluated on an external data set, the model outperformed the original model developed by the team and other top-ranking challenge submissions evaluated on the same test set.
Chen et al. [53] used a completely different DL architecture, DBNs, to classify the effects of drug combination experiments as synergistic or non-synergistic. The study used baseline gene expression data and drug target information from the AstraZeneca-Sanger Drug Combination DREAM challenge [8]. Unlike many of the previously mentioned studies, drug target information played a essential role, having been used to derive ontology fingerprints [101] for the target genes and information on the pathways targeted by each drug. The authors claim that their approach outperformed other ML models submitted to the DREAM challenge, having achieved higher precision, recall and F1 scores. We note, however, that the DBN model was evaluated using the leave-one-out approach, while the challenge submissions were evaluated on an external data set to which the participants did not have access.
5.3 The potential for drug repurposing
Drug repurposing refers to the act of discovering new therapeutic indications for existing drugs that were originally intended for other purposes [102]. The main advantage of this strategy is that these compounds have already been well studied in terms of their pharmacokinetic and safety profiles, which can help accelerate drug development. Several DL models for in silico drug repurposing have already been reported in the literature [103–105].
Besides predicting how cells respond to novel drugs, the drug response models described in this review can also be used for drug repurposing. The large screening initiatives mentioned in Section 3 have screened both experimental compounds and drugs that have already been approved. Therefore, if a high-performing model trained on one of these large screening data sets predicts that a given cell type is sensitive to a drug that was not approved for that particular cancer type, it may be an indication of the repurposing potential of that particular drug. Furthermore, databases of approved drugs can be ‘screened’ in silico, using the drug sensitivity models to predict how cancer cell lines would respond to these compounds. The authors of CDRScan [96] studied the drug repurposing potential of their model by using it to predict the response of 787 cancer cell lines to over a thousand approved drugs from the DrugBank database [80]. CDRScan predicted that 23 known anti-cancer drugs were also active against at least one other cancer type besides their approved indications. It was also able to uncover potential anti-cancer indications for 27 non-oncological drugs [96]. A similar approach could be employed to determine the drug repurposing potential of other DL-based drug sensitivity prediction models.
6 Model evaluation
When evaluating the performance of a drug response prediction model, the choice of an adequate validation strategy is essential to ensure that the model is able to generalize well to new drugs and cell lines. Many of the models surveyed in this review used some form of cross-validation to evaluate model performance and generalizability, but not all of them guarantee that the validation set only includes previously unseen cell lines and drugs/drug combinations (see Tables 5 and 6). Preuer et al. [39] found that their DeepSynergy model performed poorly when predicting drug response for test cases with drugs or cell lines that were distinct from those seen during the training phase. This highlights the importance of using more rigorous validation schemes, such as ‘leave-drug-out’ or ‘leave-cell-line-out’ (Figure 4).
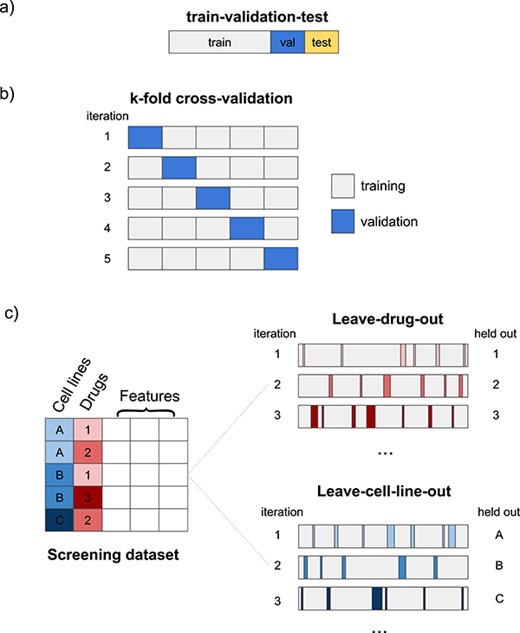
Different model validation schemes. (A) A data set can be split once or multiple times into training, validation and test sets. (B) In k-fold cross-validation, a data set is split into k different folds, and in each iteration a different fold is used as the validation set. In these cases, the held out validation sets consist of randomly selected drug-cell line interaction pairs. (C) The leave-cell-line-out and leave-drug-out validation methods hold out one or more specific cell lines or drugs when training and use them as the validation set.
When using a ‘leave-drug-out’ cross-validation scheme, one or more compounds are held out from the training set. This is repeated until all of the drugs have been held out once. The results of this type of validation more accurately reflect how a model would behave when presented with a new compound.
The ‘leave-cell-line-out’ validation strategy leaves out cell lines from the training set, while a ‘leave-tissue-out’ validation scheme leaves out all cell lines of a particular tissue type. Leaving specific cell lines or tissue out from training is important to assess whether the model is just learning to identify the cell line or the tissue type based on the omics features and associating it with a certain response [47]. A useful drug response prediction model is one that is able to uncover tumor-specific associations between omics features and response, reflecting the heterogeneity of responses [6] that is often seen even among tumors of the same type.
Many of the studies also used external data sets from different screening initiatives with some degree of overlap with the training data set to further validate the models. Since different data sets may have been generated using different screening methodologies, this overlap can be particularly useful to assess the robustness of the models with respect to different experimental conditions. A model can be considered robust if it is able make similar predictions for the same interaction pairs in different data sets and if the same candidate drug response biomarkers are identified irrespective of the experimental setup.
Another specific validation step reported in some of the studies is evaluating if a model is able to identify gene–drug associations that are have already been well studied in the literature. This step helps to confirm the clinical usefulness of the response biomarkers identified by the model.
The choice of adequate scoring metrics to evaluate and compare different drug response prediction models is also crucial. Some commonly used metrics such as MSE/root MSE (RMSE) are data set-specific and may not be the best for comparing between models trained on different data sets, for instance. Problem-tailored scoring metrics such as the weighted scoring metrics proposed in past DREAM challenges [8, 10] may provide a more accurate idea of the predictive performance and generalization capacity of the models. In any case, the use of multiple scoring metrics is recommended, as different scoring metrics may offer different insights.
Most of the reviewed studies also compared their proposed DL models to traditional ML models. However, the hyperparameter space for the ML models is usually not as extensively explored and the models may be trained using slightly different input data, as feature selection techniques may need to be employed. Furthermore, some studies do not directly compare the proposed models to the state-of-the-art ML-based drug response prediction models. This may lead to optimistic results showing that DL models perform better, when in fact the DL models are not being compared to the best possible traditional ML alternatives.
Now that several DL-based drug response models have been published, it would also be interesting to compare them with one another. However, as can be seen in Tables 5 and 6, different studies use different scoring metrics and validation strategies, with little overlap between studies. This highlights the importance of defining a benchmarking strategy for the community, so that performance can be easily compared across methods.
7 Improving model performance
Although these initial studies have demonstrated that DL drug response models are usually able to outperform traditional ML models, there is still room for improvement. For instance, although several DL models have already achieved |$R^2$| scores greater than 0.80 (see Tables 5 and 6) when predicting drug response for unknown drug-cell line pairs, drug response prediction models in general still struggle to generalize well to novel cell lines and drugs.
Diverse neural network architectures have been used to build drug response prediction models, from simple DNNs, to CNNs or natural language processing (NLP)-inspired approaches. One of the main advantages of using DL to predict drug response is that DL models can learn to learn higher-order representations directly from input data. Many of these models have already taken advantage of this unique characteristic of DL models. However, none have tested the use of graph convolutions [33, 106]. Graph convolutional networks are able to learn representations of compound structures represented as molecular graphs and have been used in various other drug discovery prediction tasks [107]. Besides graph convolutions, other DL methods to learn continuous representations of compounds, such as the NLP-inspired Seq2seq fingerprint [108] for example, have yet to be explored.
As demonstrated in some of the studies reviewed in this article, DL can also be used to learn representations of cell line omics data. The development of suitable DL methods for feature extraction from these types of data should continue to be investigated.
It is important to note, however, that it is still unclear if features learned directly from raw input data always perform better than manually engineered features. Two recent studies [109, 110] have reached different conclusions when comparing the performance of learned representations of compounds and pre-computed molecular descriptors and fingerprints. Another study found that learned representations of compounds do not perform well when the training data set is small or highly imbalanced [107]. Furthermore, manually engineered features may be more interpretable.
In addition, previous drug response prediction studies [8, 10] have observed that the type of ML algorithm used does not have a considerable effect on the predictive performance of the models, as opposed to the way the input data is processed and integrated into the model.
Most of the models referred to in this review still use prior biological knowledge such as pathway data to filter out less relevant features and to refine the models. Some preprocessing and filtering of the input data sets is still necessary due to the fact that these drug response data sets are multidimensional and very noisy, especially the omics data sets characterizing the cell lines. The success of DL models in this field will probably depend on the successful combination of learned representations of the original data and carefully selected manually engineered features.
Drug response prediction models are usually trained on heterogeneous data sets, comprising both pharmacological data and various types of omics data. Integrating multiple input data types is a complex task. Each feature type must be preprocessed differently before being fed into the network, and variable types and value ranges may greatly differ between different data types. The problem of biological data integration has been addressed in more detail in another review [111]. Several DL drug response models [44, 49, 92, 93, 96, 97] have adopted a multimodal learning approach, in which separate subnetworks with distinct architectures are used to model different input data types. In the future, most, if not all, DL-based drug response models will probably follow a similar multimodal, modular approach.
Besides the choice of network architecture, assessing which combinations of different data types are the most predictive is essential. Gene expression data is by far the most commonly used input data type for drug response models. Several studies have found that gene expression is indeed the most informative data type [6, 10], but a recent DL-based study found that drug descriptors were more predictive than cell line features [97]. One study also found that, in a tissue-specific setting, genomic features were more predictive of drug response than gene expression [6]. Furthermore, certain types of data may be more readily available in a clinical setting than others, and it is important to also take this into consideration when selecting the input data types for these models.
There are many sources of data that could be valuable when building drug response prediction models, but leveraging these data may not always be feasible. For instance, the lack of target information for compounds may limit the use of pathway data. Integrating additional data may also be difficult due to the lack of sufficient overlap between different resources. Tan et al. [95] observed that the lack of overlap (in terms of compounds) between LINCS and the drug screening data sets from GDSC and CCLE was a limiting factor. Semi-supervised learning can be used to overcome this problem in some cases [91].
Since DL models are complex and have many learnable parameters, they have a tendency to overfit. Due to this, DL models perform better when trained on large amounts of data [17, 41, 112]. The scarcity of sufficiently large anti-cancer drug screening data sets has limited the use of DL for drug response prediction. However, it is important to note that the need for large, high-quality drug screening data sets is common to all types of ML-based drug response prediction models [16] and not just DL models. Larger and more diverse training sets are therefore necessary to be able to obtain drug response models that can generalize well to a wider range of drugs and cell lines than is currently possible.
Integrating several drug screening data sets could be a way to create data sets with a greater amount of samples representing a wider variety of drugs and cell lines. However, this may not be a simple task. Data from different screening initiatives may have been obtained using different experimental methods and under different conditions, and the way drug response is quantified may be different. It may also be necessary to standardize gene and compound identifiers to guarantee that they are uniform across the different data sets. Furthermore, some authors have expressed concerns regarding the inconsistency between different drug screening data sets [113, 114], although others are more optimistic [62, 115, 116].
An alternative way to increase the size of the training set may be to employ data augmentation techniques, such as the SMILES enumeration technique [98]. DL methods such as generative adversarial networks (GANs) [117] could also be used for data augmentation purposes by generating artificial data based on the original training set [118].
Transfer learning can also help mitigate the effects of small training data sets. Pre-training compound encoder subnetworks using larger, more general compound data sets may help to create more robust compound encoders. Omics feature encoders can also be pre-trained in a similar manner. In addition, using patient-level data to pre-train parts of the networks can aid in the extraction of clinically relevant features. This type of approach might help overcome the differences between the cell type contexts in cell lines and patients that prevent translatability to the clinic. Nevertheless, it is still unclear if DL models will be able to fully resolve this issue.
The majority of the models described in this review are not cell line or drug-specific models, but integrate drug response data from a variety of compounds screened against of variety of cancer cell lines representing different types of tumors. Training pan-drug and pan-cancer drug response prediction models is necessary because the amount of data available for certain cancer cell lines or drugs that are underrepresented in the available screening data sets may be insufficient to train robust DL models for these cases. It may also help the model to learn more general features, increasing model generalizability. These general models can be subsequently fine-tuned using smaller, more specific data sets (limited to a specific tumor type or a certain class of drugs), enabling the creation of models that are more specific and clinically useful.
Finally, as the complexity of DL drug response prediction models increases, the financial and environmental costs associated with building these models will also increase substantially [119, 120]. In the future, balancing model performance and clinical applicability with these additional factors will become increasingly important.
8 Model interpretability
One of the main characteristics of DL models that has limited their application to biological and health-related problems in general is their lack of interpretability [17, 41, 112], although some of the traditional ML models commonly used in pharmaceutical research also have this problem [17], and the quality of the input data itself can also affect the biological interpretability of model predictions [16]. While the ability to extract relevant features directly from raw data may be considered an advantage of using DL, the abstract learned representations may be very difficult for humans to interpret.
DL models are generally considered ‘black boxes’, but the ability to easily to interpret the results of a drug response model is essential for its acceptance and application in the pharmaceutical industry or in the clinic. Ensuring that these models are interpretable would improve our understanding of the factors underlying drug sensitivity/resistance or drug synergy, rather than merely predicting drug response. Only a few of the studies mentioned in this review addressed the issue of interpretability, but if DL-based drug response models are to be relevant, techniques to make these types of models more interpretable must continue to be explored.
A step in this direction is to build models trained on different combinations of input data to find out which data types are the most predictive, as described in the work of Xia et al. [97], for example. However, although this provides an idea of which data sets might be the most informative, it still does not reveal how specific features influence prediction.
Determining which input features contributed most to a certain prediction would help to uncover potential drug response biomarkers or allow the identification of structural features of drugs that are associated with improved drug response. Discovering new biomarkers of drug response is particularly important for precision medicine, as its main purpose is to help to stratify patients for treatment [6]. Furthermore, putative biomarkers identified in cell lines and confirmed in patients could be a way to translate the insights gained from cell line models to the clinic. Confirming that a well-known biomarker-drug association is still observed when a given model trained on cell lines predicts drug responses for patients (e.g. greater sensitivity predicted for patients with a known biomarker than those without) would also be an additional confirmation of the translatability of the model.
The field of ‘explainable artifical intelligence’ is a very active one, and numerous strategies to increase the explainability of DL models have been proposed. Including one of these methods into the drug response prediction workflow may help to identify the most predictive features. We refer readers to a recent article on model interpretability for a more comprehensive review on the topic [121].
Some of these strategies determine feature importance by perturbing specific input units and evaluating the effects on the outputs. Local Interpretable Model-agnostic Explanations (LIME), for instance, uses an additional ML model to learn important features based on the predictions of DL models [122]. Another perturbation-based method applies dropout, a technique that ignores certain units in a network during training, to the input layer to rank input features [123]. Another class of model interpretability methods are backpropagation-based approaches, which propagate importance backwards through the network using gradients [124]. Examples include the Integrated Gradients method [125] and DeepLIFT [124].
Shapley additive explanations (SHAP) [126] unifies several popular model explanation methods, including LIME and DeepLIFT, and Shapley value estimation methods from the field of game theory under a single framework. It approximates Shapley values [127] to determine the contribution of each feature to a given prediction [126].
Incorporating attention mechanisms within the network itself is a more direct way of making a DL model more explainable. Attention mechanisms assign weights to the input features during training. In PaccMann [44], learned attention weights allowed the identification of the specific genes or the specific atoms and bonds within a molecule that were most predictive of drug response.
Methods to increase the interpretability of DL models can also be borrowed from other subfields of artificial intelligence. For example, given input examples and background knowledge, inductive logic programming (ILP) models learn logic programs [128], which are much more humanly interpretable than NNs. Combining ILP and DL [129] may therefore produce models that are more easily understood.
The increased complexity of DL models can lead to greater predictive performance, but it is also what makes these models very difficult to explain. Due to this trade-off between accuracy and interpretability, better-performing, complex models will probably always be more difficult to explain than simpler models, even if the previously suggested methods to improve interpretability are employed. Some authors argue that designing models that are inherently interpretable should be preferred over attempting to explain ‘black box’ DL models a posteriori [130]. However, recent efforts in the field of explainable artificial intelligence, such as self-explaining neural networks [131], have shown that it may be possible to build DL models that are interpretable by design.
9 Conclusion
In this article, we reviewed some of the 1st studies that have employed DL to predict the effects of single drugs and drug combinations on cancer cell lines. The results of these initial studies are promising, demonstrating that DL-based models are able to perform as well as, or even better than, traditional ML-based models on drug response prediction tasks. Nevertheless, there is still room for improvement, and the future success of DL in this field will depend on the improvement of both the generalizability and the interpretability of these models.
Many of the studies reviewed here highlight the potential clinical applicability of the DL-based drug response models they report on, but direct application to patients in a clinical setting is still far from being a reality. Few of these studies have been able to demonstrate how cell line models could actually translate to patients. Due to the lack of interpretability of the models and the fact that most were trained on cell line data only, the current results do not substantiate these claims. Furthermore, we must also consider that the variety of omics data types characterizing cancer cell lines may not be readily available when it comes to patients, as obtaining samples from tumors or performing certain analyses may not always be possible.
Although they are still far from being clinically applicable, these models help us get closer to achieving the goal of precision medicine in the clinic. The results of these studies will be useful to direct future efforts toward the development of computational methods for the rational design of novel effective anti-cancer treatments.
Delora Baptista is a PhD student in Biomedical Engineering at the University of Minho.
Pedro G. Ferreira is an Assistant Professor at the University of Porto, an ‘Investigador FCT’ at IPATIMUP and part of the Expression Regulation in Cancer group at i3S and an External Research Collaborator at INESC TEC.
Miguel Rocha is an Associate Professor with Habilitation at the Department of Informatics and a Senior Researcher of the Centre of Biological Engineering at the University of Minho.
Acknowledgments
We thank Dr. Julio Saez-Rodriguez (Heidelberg University) for comments on the manuscript.
Funding
Portuguese Foundation for Science and Technology (FCT) under the scope of the strategic funding of (UID/BIO/04469/2019) unit and SFRH/BD/130913/2017 to D.B; BioTecNorte operation (NORTE-01-0145-FEDER-000004) funded by the European Regional Development Fund under the scope of Norte2020—Programa Operacional Regional do Norte.
References
