


Abstract
As an important task in protein structure and function studies, protein fold recognition has attracted more and more attention. The existing computational predictors in this field treat this task as a multi-classification problem, ignoring the relationship among proteins in the dataset. However, previous studies showed that their relationship is critical for protein homology analysis. In this study, the protein fold recognition is treated as an information retrieval task. The Learning to Rank model (LTR) was employed to retrieve the query protein against the template proteins to find the template proteins in the same fold with the query protein in a supervised manner. The triadic closure principle (TCP) was performed on the ranking list generated by the LTR to improve its accuracy by considering the relationship among the query protein and the template proteins in the ranking list. Finally, a predictor called Fold-LTR-TCP was proposed. The rigorous test on the LE benchmark dataset showed that the Fold-LTR-TCP predictor achieved an accuracy of 73.2%, outperforming all the other competing methods.
Introduction
The protein folds reflect the different patterns of protein structures, including the 3D structures of protein molecules and the trend of protein polypeptide chains [1, 2]. It is believed that different folds lead to different protein functions [2]. Therefore, accurate recognition of protein folds is helpful for predicting the protein structures and functions, and protein fold recognition based only on the protein sequences is critical for protein sequence analysis [3].
Because of its importance, some computational predictors were proposed to detect the protein folds from their sequences, including two categories: sequence alignment methods and discriminant-based methods [3, 4].
Sequence alignment methods calculate the similarity between query protein sequence and template protein sequence. The higher the score between query protein and template protein is, the more likely the query protein can be classified into the same fold categories as this template protein. The alignment methods were applied to protein fold recognition, such as Nedleman–Wunsch algorithm [5] with global optimum and Smith–Waterman algorithm with local optimum [1, 6]. Later, in order to improve the speed of traditional sequence alignment methods, researchers proposed BLAST [7] algorithm, FASTA [8] algorithm and HAlign [9, 10] at the cost of reducing accuracy. These methods cannot accurately detect the fold relationships among proteins with sequence similarity less than 25% [2]. Because proteins in the same fold usually share very low sequence identity, the simple sequence-profile alignment methods failed to detect protein folds [11]. In order to increase the sensitivity of sequence alignments, the structure features of proteins were added into the methods of sequence alignments, such as HHpred [12], FFAS-3D [13], SPARKS-X [14], etc. Later, researchers improved the HMM alignments [15] by sequence profiles, such as Hmmer [16] and HHblits [17]. Machine learning techniques have been widely used in protein fold recognition based on the sequence alignment methods, for example the RF-Fold [18] combines the features extracted by various sequence alignment methods with the random forest algorithm [19]. Ding et al. [20] employed the support vector machines (SVMs) and neural network (NN) to solve the protein fold recognition problem. Polat et al. [21] constructed a new NN called GAL for protein fold recognition problem. The multi-view model was employed to combine various sequence-based features [22]. Because the profiles consider the evolutionary information, some predictors improve the predictive performance by incorporating the profiles [23–25]. Recently, some predictors were constructed based on deep learning techniques, which have been widely employed in the field of bioinformatics [26–33]. For example DeepFRpro [34] extracted the fold-specific features by using deep learning and obviously improved the predictive performance. Later, this method was improved by combining the profile-based features extracted by LSTM model and SVMs [35].
All these aforementioned methods are playing important roles in the development of this very important field. However, there are still some problems which should be addressed: (i) the existing sequence alignment methods search the proteins in the same fold in an unsupervised manner, failing to accurately detect the proteins sharing low protein similarities; and (ii) the current predictors ignore the relationship of the proteins in the dataset. However, as reported in previous study [36], this information is critical for protein homology analysis.
In this regard, in this study we are to propose a novel predictor called Fold-LTR-TCP for protein fold recognition based on the Learning to Rank (LTR) algorithm [37] and triadic closure principle (TCP) [38] so as to solve the aforementioned problems. The LTR algorithm retrieves the proteins in the same fold in a supervised manner so as to use the protein fold information and the sequence-based and profile-based features. Previous study [36] has shown that protein similarity network considering the relationship of proteins in the dataset is useful for protein remote homology detection. Inspired by this study, the TCP [38] was employed and performed on the protein similarity network constructed by LTR algorithm [37] so as to improve the accuracy of the ranking list. When tested on a widely used benchmark dataset, experimental results showed that the proposed Fold-LTR-TCP predictor outperformed other competing methods for protein fold recognition.
Materials and method
Benchmark dataset
In this study, the LE benchmark dataset [39] was used to evaluate the performance of various methods. The LE dataset was proposed by Lindahl and Elofsson [39], which was constructed based on SCOP database [40]. The dataset contains 976 sequences, which can be downloaded in http://yanglab.nankai.edu.cn/TA-fold/benchmark/.
In order to rigorously simulate the protein fold recognition task, the LE benchmark dataset was divided into two subsets, sharing no proteins belonging to the same superfamily. For more detailed information, please refer to [39]. A 2-fold cross-validation was employed to evaluate the performance of the proposed method.
Framework of Fold-LTR-TCP
LTR algorithm [37] is a powerful supervised machine learning method, which was successfully applied to information retrieval [1] and protein remote homology detection [1, 41, 42]. Previous study [36] has shown that the ranking list can be further improved by considering the relationship of proteins in the protein similarity network. In this regard, we constructed a protein similarity network based on LTR algorithm [37] for protein fold recognition, and then the TCP [38] was performed on this network so as to refine the ranking list. Finally, the Fold-LTR-TCP predictor was proposed, whose flowchart is shown in Figure 1.
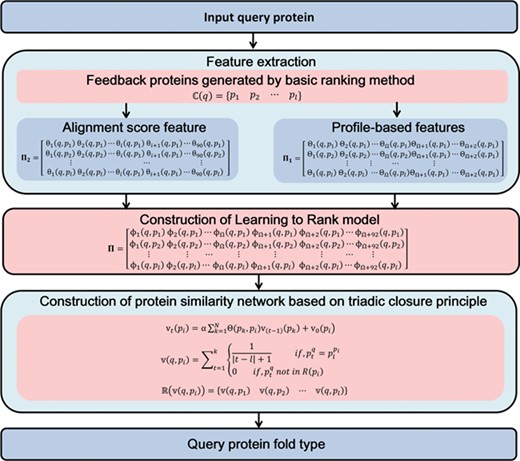
The flowchart to show how Fold-LTR-TCP works.
Basic ranking method
In this study, ranking method is used to identify protein folds. In this regard, HHsearch [17] was employed as the basic ranking method. The reason is that the ranking list detected by HHsearch [17] is accurate with high coverage of positive samples.
Feature extraction
The proteins in the same folds usually share sequence similarity lower than 25% [39]. Because the similarity of proteins in the same superfamily is generally higher than that of proteins in the same fold, the traditional sequence alignments for homology detection generally failed for fold recognition. Therefore, in order to improve the predictive performance, two features were extracted to capture the characteristics of different protein folds, and then three feature mapping strategies were performed on these features to measure the relationship between any two proteins. The two feature extraction methods are introduced as follows:
(1) Profile-based feature
As shown in previous studies [43–45], profile-based features are more discriminative than the sequence-based features, because they contain evolutionary information extracted from the multiple sequence alignments [46]. In this regard, Top-n-gram [47] was used to extract these features.
(2) Alignment score feature
In sequence analysis, sequence alignment is a commonly used method. Although a single sequence alignment method is often inaccurate, better performance can be achieved by combining the complementary sequence alignment methods. Therefore, in this study, the 84-dimension features based on the alignment scores reported in [18] were employed. For more details about the 84-dimension features, please refer to [18].
Feature mapping strategies
Profile-based features are widely used in bioinformatics. However, none of these features can directly reflect the relationship between query proteins and feedback proteins. To solve this problem, three feature mapping strategies were used to measure the relationship between the two proteins:
(1) Phase subtraction strategy
The profile-based features Top-n-grams [47] are employed to represent the protein sequences, and the similarity of the query feedback protein pair|$\Big(q,p\Big)$| can be calculated by [42]:
(2) Chebyshev distance strategy.
Chebyshev distance is able to measure the similarity between two vectors [48], and performs well for protein sequence similarity measurement. Therefore, in this study, we apply the Chebyshev distance [49] to measure the similarity of vectors based on Top-n-gram.
The similarity of query feedback protein pair|$\Big(q,p\Big)$| based on Top-n-grams is calculated by
(3) Min’s distance strategy
Min’s distance [48] is widely used in measuring protein sequence similarities. For a ranking list, a perfect result is that all the positive samples of the query are ranked higher than other proteins. In order to solve the problem that the extreme score in the ranking list will impact on the predictive results, the logarithmic function [50] was employed to solve this problem.
The similarity of query feedback protein pair|$\Big(q,p\Big)$| based on Top-n-gram is calculated by
Construction of LTR model.
LTR [37] is a supervised machine learning method for ranking tasks, which has been applied to many fields [1]. Recently, it has also been used in protein sequence analysis [1, 41]. In this study, the LambdaMART [37] method is used. A good ranking list will detect all the positive samples, and all the positive ones are ranked higher than the negative ones. The lambdaMART algorithm in the RankLib2.7 package was used as the implementation of LTR. Its parameters were set as ‘ranker 6 –metric2t NDCG@10 –norm linear –shrinkage 0.05’. Therefore, NDCG is used to measure the performance of the experimental algorithm because the NDCG considers the influence of positions in the ranking list.
In order to incorporate the Top-n-gram features into the LTR algorithm, we constructed a feature matrix |${\boldsymbol{\Pi}}_{\mathbf{1}}$| by using the features in the feedback proteins in |$\mathbb{C}(q)$|, which can be represented as
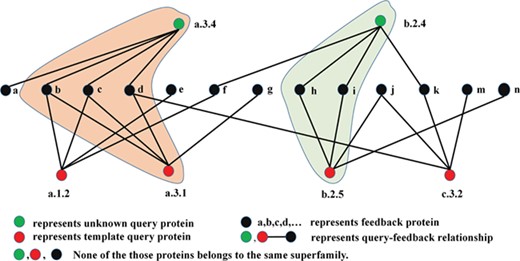
Construction of protein similarity network based on TCP.
Protein fold recognition is a multi-classification problem with low protein sequence similarity, which will lead to different data distribution between the training dataset and the test dataset. The traditional methods failed to accurately calculate the similarity between the template protein and the query protein, and therefore, their performance for protein fold recognition is generally low. In order to overcome this disadvantage, in this study we extended the one-to-one relationship between query protein and template protein to the one-to-multiple relationship among query protein and multiple template proteins. A protein similarity network was constructed based on LTR, and then the TCP [38] was performed on the network to improve the ranking list by considering the one-to-multiple relationship among query protein and multiple template proteins.
The TCP has been successfully applied to the studies of social network [38] as shown in Figure 2a and b. The TCP believes the following: (i) the closer the relationship between two persons and their common friends, the more they are likely to become friends; and (ii) the more common friends they have, the more they are likely to become friends [38]. Inspired by these rules, we proposed two rules for protein fold recognition: (i) the higher the scores between two proteins and the shared feedback proteins are, the more they are likely to belong to the same fold; and (ii) the more feedback proteins the two proteins share, the more they are likely to belong to the same fold. These rules were shown in Figure 2c and d. Based on these two rules, we proposed a protocol for protein fold recognition based on TCP, whose process was shown in Figure 3, and the details steps will be introduced in the following section.
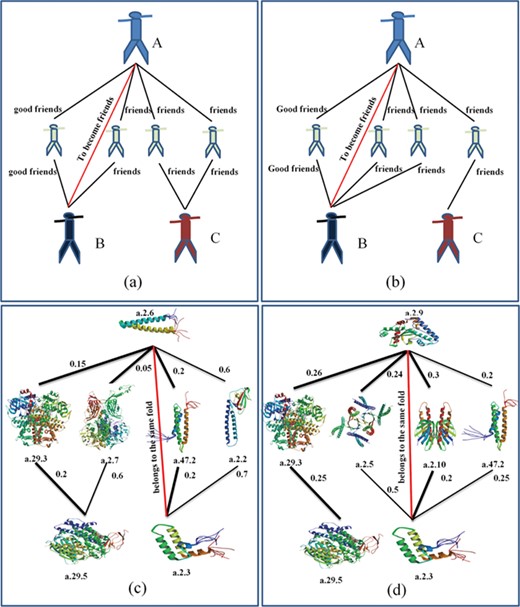
The similarity between social network and protein fold recognition. Based on their similarity, the TCP can be applied to protein fold recognition.
The flowchart of how TCP works on the protein similarity network.
Evaluation methodology
In this study, protein fold recognition was treated as a ranking task. The similarity scores among query protein and all the corresponding template proteins were calculated, and then the template proteins were sorted in descending order according to the similarity scores. The first template protein with the highest similarity score is considered as the hit of the query protein.
The overall accuracy was employed to measure the performance various methods, which is the ratio of the number of correctly predicted proteins to all the number of proteins to be predicted [45]:
|$\mathrm{Accuary}=\frac{n}{N}\times 100\%$| (15)where n represents the number of the test samples, whose folds are correctly predicted, and N is the total number of query samples in the test dataset.
Results and discussion
TCP improves the accuracy of protein fold recognition
The TCP was compared with other two similar methods for protein fold recognition, including PageRank [36] and Hyperlink-Induced Topic Search (HITS) [36]. Besides the current protein similarity network constructed by the LTR model, these three methods were also performed on other four protein similarity networks constructed by four state-of-the-art protein fold recognition methods, including DeepFRpro (DF) [34], cosine (CS) [18], correlation (CL) [18] and Gaussian kernel functions (GK) [18]. The corresponding results were listed in Table 1, from which we can see the following: (i) among the five protein similarity networks, the ones constructed by LTR and DF obviously outperformed the other three, and the one based on LTR achieved the top performance. These results are not surprising because the LTR model retrieves the template proteins in a supervised manner using both the sequence label information and the features extracted from protein sequences, and DeepFRpro [34] combines deep learning algorithm with multiple alignment scores, leading to a more accurate protein similarity network; and (ii) TCP outperformed HITS and PageRank on all the five protein similarity networks. The reason is that TCP considers the relationship among the query protein and the template proteins in the ranking list, which will obviously improve the accuracy of the ranking list.
Performance of TCP, PageRank and HITS performed on five different protein similarity networks on LE benchmark dataset via 2-fold cross-validation
| Methods | Accuracy |
|---|---|
| PageRank (LTR)a | 72.5% |
| HITS (LTR)a | 70.1% |
| TCP (LTR) a | 73.2% |
| PageRank (DF)b | 71.3% |
| HITS (DF)b | 69.4% |
| TCP (DF)b | 72.6% |
| PageRank (CS)c | 4.9% |
| HITS (CS)c | 10.1% |
| TCP (CS)c | 20.9% |
| PageRank (CL)d | 9.3% |
| HITS (CL)d | 12.5% |
| TCP (CL)d | 19.3% |
| PageRank (GK)e | 6.5% |
| HITS (GK)e | 10.3% |
| TCP (GK)e | 11.2% |
In order to illustrate the computational efficiency of the Fold-LTR-TCP predictor, its time complexity is analyzed. There are two algorithms in Fold-LTR-TCP, including lambdaMART algorithm in LTR model, and TCP. The time complexity of lambdaMART is |$O(TNM)$|, where |$T$| is the maximum number of the iterations, |$N$| is the number of the query samples of each iteration and |$M$| is the number of the feedback proteins of each query sample. In the TCP, the total number of query proteins in the protein similar network is |$N$| (cf. Equation 12), and the time complexity of the TCP is |$O\Big({N}^2\Big)$|. Therefore, the time complexity of the Fold-LTR-TCP predictor is |$O\Big( TNM+{N}^2\Big)$|. In this study, the LE dataset was split into two subsets with 159 sequences and 162 sequences. The 2-fold cross-validation strategy was used to evaluate the performance of Fold-LTR-TCP. The total training time is 17 340 s and the total test time is only 170 s. This experiment was performed on a computer with the CPU of 20 cores with 2.4GHz and memory of 128G, indicating that the Fold-LTR-TCP predictor is an efficient method with high accuracy.
Comparison with other competing methods
The performance of the proposed Fold-LTR-TCP predictor is compared with other predictors, including PSI-Blast [7], HMMER [16], SAM-T98 [15], BLASTLINK [39], SSEARCH [51], SSHMM [52], THREADER [53], Fugue [54], RAPTOR [55], SPARKS [56], SPARKS-X [14], SP3 [57], SP4 [58], SP5 [59], BoostThreader [60], HH-fold [61], RFDN-Fold [62], DN-FoldS [62], DN-FoldR [62], MT-fold [63], HHpred [12], FFAS-3D [13], TA-fold [61], FOLDpro [64], DN-Fold [62], RNDN-Fold [62], RF-Fold [18], dRHP-PseRA [65], DeepFRpro [34] and DeepSVM-fold [35]. Table 2 shows the performance of these aforementioned methods, from which we conclude that the Fold-LTR-TCP predictor achieves the best performance. Besides Fold-LTR-TCP, all the other methods can only consider the pairwise similarity between the query protein and the template protein. The Fold-LTR-TCP is the first predictor to consider the global relationships among the query proteins and the template proteins based on the protein similarity network (Figure 3). This is the main reason for its better performance. These results further confirm that the Fold-LTR-TCP predictor is efficient for protein fold recognition and will facilitate the studies of protein structures and functions.
Performance comparison of the Fold-LTR-TCP with other state-of-the-art methods on LE benchmark dataset via 2-fold cross-validation
| Methods | Accuracy | Source |
|---|---|---|
| PSI-Blast | 4.0% | [39] |
| HMMER | 4.4% | [39] |
| SAM-T98 | 3.4% | [39] |
| BLASTLINK | 6.9% | [39] |
| SSEARCH | 5.6% | [39] |
| SSHMM | 6.9% | [39] |
| THREADER | 14.6% | [39] |
| Fugue | 12.5% | [64] |
| RAPTOR | 25.4% | [64] |
| SPARKS | 28.7% | [64] |
| SP3 | 30.8% | [64] |
| FOLDpro | 26.5% | [64] |
| HHpred | 25.2% | [62] |
| SP4 | 30.8% | [62] |
| SP5 | 37.9% | [62] |
| BoostThreader | 42.6% | [62] |
| SPARKS-X | 45.2% | [62] |
| RF-Fold | 40.8% | [62] |
| DN-Fold | 33.6% | [62] |
| RFDN-Fold | 37.7% | [62] |
| DN-FoldS | 33.3% | [62] |
| DN-FoldR | 27.4% | [62] |
| FFAS-3D | 35.8% | [61] |
| HH-fold | 42.1% | [61] |
| TA-fold | 53.9% | [61] |
| dRHP-PseRA | 34.9% | [65] |
| MT-fold | 59.1% | [65] |
| DeepFRpro | 66.0% | [34] |
| DeepSVM-fold | 67.3% | [35] |
| Fold-LTR-TCP | 73.2% | This study |
The bold values represent the proposed method achieving the top performance.
Besides the aforementioned methods, DeepSF [49] and SVM-fold [61] are two state-of-the-art methods. However, these two methods cannot be directly compared with our method and other related methods on the same LE dataset for the following reasons: (i) these two methods were not evaluated on the LE dataset; and (ii) they contain several hyper-parameters, which should be optimized for different datasets, and their source code is unavailable. However, our method can indirectly compare with these two methods. Evaluated on two benchmark datasets derived from SCOP database, the DeepSF achieved accuracies of 75.3% and 73% as reported in [49]. The Fold-LTR-TCP achieved an accuracy of 73.2% on the LE benchmark dataset, which was also derived from SCOP database. Therefore, we conclude that the Fold-LTR-TCP is better than or at least comparable with DeepSF. The Fold-LTR-TCP predictor was directly compared with TA-fold, and the performance was shown in Table 2. TA-fold combined SVM-fold and HH-fold and outperformed the SVM-fold as reported in [61]. Because the Fold-LTR-TCP outperformed TA-fold (Table 2), we conclude that Fold-LTR-TCP is better than SVM-fold.
Conclusion
In this study, we proposed a new computational predictor called Fold-LTR-TCP for protein fold recognition by combining the LTR and TCP. The Fold-LTR-TCP predictor is a general method for detecting different protein fold types. Because the protein folds with more proteins will provide more training samples for training Fold-LTR-TCP, it will achieve better performance for these protein folds. Experimental results showed that the Fold-LTR-TCP outperformed other competing methods. Fold-LTR-TCP has the following advantages: (i) it incorporates various features into the framework of LTR model in a supervised manner, treating protein fold recognition as a ranking task; and (ii) the ranking list generated by the LTR model is further improved by using the TCP by considering the one-to-multiple relationship among query protein and multiple template proteins. To the best knowledge of ours, Fold-LTR-TCP is the first approach to use the global relationships among the query proteins and all template proteins for protein fold recognition. It can be anticipated that the proposed framework would have many potential applications when the global interactions among biological sequences are required, such as protein complex identification [66], circRNA–disease association prediction [67], microRNA–disease identification [68], etc.
Protein fold recognition is a very important problem in the field of protein structure and function studies. Although the existing computational predictors contribute the development of this field, they failed to accurately detect the protein folds due to the low sequence similarities of proteins in the same fold.
This study represents a new predictor called Fold-LTR-TCP for protein fold recognition. The protein similarity network describing the relationship among proteins was constructed based on LTR model, and then TCP was performed on this network by considering the one-to-multiple relationship among query protein and multiple template proteins for accurate protein fold recognition.
Experimental results on the LE benchmark dataset showed the proposed Fold-LTR-TCP outperformed 29 existing state-of-the-art methods for protein fold recognition. To the best knowledge of ours, Fold-LTR-TCP is the first predictor considering the relationships among proteins in the dataset for protein fold recognition, which is main reason for its better performance.
Acknowledgements
The authors are very much indebted to the four anonymous reviewers, whose constructive comments are very helpful in strengthening the presentation of this article.
Funding
This work was supported by the National Natural Science Foundation of China (61672184, 61822306), Fok Ying-Tung Education Foundation for Young Teachers in the Higher Education Institutions of China (161063) and Scientific Research Foundation in Shenzhen (JCYJ20180306172207178).
Bin Liu, PhD, is a professor at the School of Computer Science and Technology, Beijing Institute of Technology, Beijing, China. His expertise is in bioinformatics, nature language processing and machine learning.
Yulin Zhu
Yulin Zhu is a master student at the School of Computer Science and Technology, Harbin Institute of Technology, Shenzhen, Guangdong, China. His expertise is in bioinformatics.
Ke Yan
Ke Yan is a is a Ph. D candidate at the School of Computer Science and Technology, Harbin Institute of Technology, Shenzhen, Guangdong, China. His expertise is in bioinformatics.
