


Abstract
Genes are unique in functional role and differ in their sensitivities to genetic defects, but with difficulties in pathogenicity prediction. This study attempted to improve the performance of existing in silico algorithms and find a common solution based on individualization strategy. We initiated the individualization with the epilepsy-related SCN1A variants by sub-regional stratification. SCN1A missense variants related to epilepsy were retrieved from mutation databases, and benign missense variants were collected from ExAC database. Predictions were performed by using 10 traditional tools with stepwise optimizations. Model predictive ability was evaluated using the five-fold cross-validations on variants of SCN1A, SCN2A, and KCNQ2. Additional validation was performed in SCN1A variants of damage-confirmed/familial epilepsy. The performance of commonly used predictors was less satisfactory for SCN1A with accuracy less than 80% and varied dramatically by functional domains of Nav1.1. Multistep individualized optimizations, including cutoff resetting, domain-based stratification, and combination of predicting algorithms, significantly increased predictive performance. Similar improvements were obtained for variants in SCN2A and KCNQ2. The predictive performance of the recently developed ensemble tools, such as Mendelian clinically applicable pathogenicity, combined annotation-dependent depletion and Eigen, was also improved dramatically by application of the strategy with molecular sub-regional stratification. The prediction scores of SCN1A variants showed linear correlations with the degree of functional defects and the severity of clinical phenotypes. This study highlights the need of individualized optimization with molecular sub-regional stratification for each gene in practice.
Introduction
The advances in genetic sequencing technology have led to increased detection of novel sequence variants, but variant interpretation remains a major challenge. A variety of computational methods have been developed to assist the interpretation of variants. These algorithms are derived from different computational classification models based on amino acid characteristics, position-specific phylogenetic information, and statistical learning methods. However, the unique properties of individual gene products, such as structural and biological complexities of biomolecules and their interactions, might hinder successful prediction. In fact, previous investigations had revealed that in silico prediction tools have variable accuracies in different genes [1–3]. Our previous study demonstrated that the same amino acid substitution at homologous residue of sodium channel Nav1.1 or Nav1.3 produces distinct functional impairments [4]. It is suggested that gene products differ in their sensitivities to mutant damage and individualized strategies in prediction is potentially required. Here, we explored the feasibility of individualizing prediction for each gene, started with SCN1A, a particular gene coding Nav1.1 that is a fundamental mediator of electrical signaling.
In humans, there are nine Nav channels (Nav1.1–Nav1.9), which are characterized by their α subunits that are encoded by one of the most ancient and conserved gene families (SCN1A–SCN11A). The α subunit of Navs is composed of four homologous domains (DI–DIV), each of which contains six transmembrane segments (S1–S6). Despite ofxs their homologous structure, Navs differ in biophysical properties and expression patterns. In particular, Nav1.1 appears to be the most important molecule that is associated with epilepsy [5, 6]. In human beings, more than 1200 SCN1A mutations have been identified, and nearly 50% of the mutations are missense [7]. The SCN1A mutation-associated epilepsies comprise a spectrum of phenotypes ranging from the extremely severe form of severe myoclonic epilepsy of infancy (SMEI or Dravet syndrome, MIM 607208) [8, 9] to the milder form of patients with generalized epilepsy with febrile seizure plus (GEFS+, MIM 604233), or pure febrile seizures (FS) [10, 11]. SCN1A mutations have been detected in 60% to 80% of patients with Dravet syndrome and 10% of patients with GEFS+ [12, 13]. SCN2A, which encodes the α subunit of Nav1.2, is also associated with epilepsy with about 50 mutations have been identified [14]. In contrast, the role of SCN3A and SCN8A, which are also expressed in the brain, remain to be confirmed [14, 15]. These findings suggest that sodium channel genes differ in their pathogenic potential. Furthermore, sodium channel genes are unique with intricate functional domains, which are also variable in the sensitivities to genetic impairments [16, 17]. Currently, a vast number of missense variants have been identified in SCN1A with locations in different functional domains of Nav1.1. In this study, we evaluated and optimized the performance of various prediction algorithms on SCN1A variants with considerations on their molecular sub-regional implications. Validation was performed on SCN1A variants with functional alterations confirmed experimentally and those from epilepsy families, as well as the variants of SCN2A and potassium channel gene KCNQ2. We aimed to provide practical tools for predicting damages of SCN1A variants and strategies for individualizing prediction for genes.
Materials and methods
Variant data sets
Epilepsy driver mutations were retrieved from SCN1A mutation database (http://www.caae.org.cn/gzneurosci/scn1adatabase/index.php) [7] and Human Gene Mutation Database (HGMD) [18] to build a positive (pathogenic) test set, which included 596 missense mutations. The negative (benign) set of non-deleterious variants was built from the Exome Aggregation Consortium database (ExAC) [19]. Only variants for which all selected programs could provide valid outputs were used in the analysis. The amino acid sequence and information of human NaV1.1 were obtained from Uniprot database (UniProt ID: P35498) and ENSP (ENSP00000303540).
In silico analysis
The damaging effect of the missense variants were predicted by 10 in silico algorithms (SIFT, MASS, PP2-HDIV, PP2-HVAR, PROVEAN, SNAP2, MutPred2, I-Mutant 2.0, FATHMM-W and FATHMM-U), which provide online services and free public access. An overview of these algorithms and the criteria used for classification of damaging effect are presented in Supplementary Table S1. To evaluate the possibility of combined application of prediction tools, we selected the top three in silico tools according to their accuracies. A variant was considered to be damaging if at least two outputs were ‘damaging’; in case of only two outputs were available, a variant was classified as damaging if one output was ‘damaging’, as in a previous study [2].
Performance assessment and validation
Scoring data generated from each prediction were collected for in-depth analysis. The predictive results were indicated by true positives (TP, correct predictions for pathogenic mutations), true negatives (TN, correct predictions for benign mutations), false positives (FP, incorrect predictions for benign mutations), and false negatives (FN, incorrect predictions for pathogenic mutations). We calculated the overall accuracy (ratio of overall correct predictions to the total number of predictions), sensitivity (TP rate), specificity (true negative rate), positive predictive values (PPV) and negative predictive values (NPV) for each in silico tool. The F score was defined as |$\frac{{\rm 2PR}}{{\rm P}+{\rm R}}$|, where precision (P) =|$ \frac{{\rm TP}}{{\rm TP}+{\rm FP}}$|, recall (R) =|$ \frac{{\rm TP}}{{\rm TP}+{\rm FN}}$|. The Matthews correlation coefficient (MCC) was calculated using the equation |$ \frac{{\rm TP} \times {\rm TN}-{\rm FP}\times {\rm FN}}{\sqrt{({\rm TP}+{\rm FP})({\rm TP}+{\rm FN})({\rm TN}+{\rm FP})({\rm TN}+{\rm FN})}}$|, with a scale of −1 to 1; −1 indicates a completely wrong binary classifier while 1 indicates a completely correct binary classifier.
Model predictive ability was evaluated using the k-fold cross-validations (k = 5) as in previous study [20]. The data were randomly split into five subsets with equal size. Four subsets were combined as training set and the remaining one subset was used as the testing set. Variants in the training set were stratified by their functional domains and trained for the best cutoff of each individual algorithm. The domain-specific classifier was generated with further combination of algorithms, and its prediction performance over the testing set was reported in the results. This procedure was repeated until all subsets had been used as a test set. Therefore, five predicting models were built over five data sets. The proposed method of model evaluating follows these criteria: accuracy, sensitivity, specificity and MCC score. The model predictive ability was evaluated using variants of SCN1A, SCN2A and KCNQ2, considering that SCN2A and KCNQ2 have homologous functional domains and are associated with epilepsy. Their pathogenic and benign missense variants were retrieved from HGMD and ExAC databases respectively.
Additionally, 47 SCN1A missense variants with functional alterations confirmed by in vitro electrophysiological recordings and 58 mutations identified in epilepsy families (http://www.caae.org.cn/gzneurosci/scn1adatabase/index.php) were used to validate the optimized prediction strategy. The 25th percentile of SCN1A missense variants (n = 76) with higher minor allele frequency (MAF > 0.000008306) from ExAC database were set as benign group for validation. We also used three ensemble methods, Mendelian clinically applicable pathogenicity (M-CAP) [21], combined annotation-dependent depletion (CADD) [22] and Eigen [23], to validate the application of our proposed strategy (Supplementary Table S1).
Statistical analysis
Pearson and spearman correlation coefficient, one-way analysis of variance (ANOVA), post hoc least significant difference (LSD) tests, and receiver operating characteristic curve (ROC) analyses were performed by SPSS statistical software (Version 17.0, IBM Corp.). The ROC analysis was used for comparison of in silico algorithms and identification of the optimum cutoff value that maximized accuracy and Youden index (sensitivity + specificity − 1) [24]. The optimum cutoff value with the highest Youden index was used to evaluate model predictive ability in the five-fold cross-validation. Area under the curve (AUC) of ROC was calculated to evaluate the discriminatory ability of the disease-based prognostic scores.
Results
Overview of SCN1A missense variants
A total of 596 missense variants were retrieved from the SCN1A mutation databases, and 345 variants were retrieved from the ExAC database. Forty variants overlapped between the two resources were excluded. The remaining 556 variants from mutation databases did not have MAFs in ExAC, neither in NHLBI ESP6500 or 1000 Genomes database, and were therefore taken as positive test set. We then compared the MAFs of the 40 overlapped variants, assumed to be pathogenic, with those of the other 305 benign missense variants from ExAC database. No significant difference in their MAFs was found between the two groups (3.30 × 10⁻⁴ ± 0.92 × 10⁻⁴, n = 40, versus 9.24 × 10⁻⁴ ± 9.01 × 10⁻⁴, n = 305, P = 0.487, Student's t-test). Pearson correlation analysis did not show significant correlation between MAF values and prediction scores of in silico tools, either (Supplementary Table S2). Therefore, we did not set a MAF cutoff value to classify benign missense variants. The prediction scores of the overlapped variants are presented intermediately between the positive test set and the negative set (Supplementary Figure S1, shown by prediction scores of SNAP2). The number of variants in the positive set (n = 556) and negative set (n = 305) and their sub-regional distributions in Nav1.1 functional domains were summarized in Supplementary Table S3.
Performance of in silico tools
The pathogenic classification accuracies of the 10 in silico algorithms for SCN1A variants ranged from 64.1% (I-Mutant2.0) to 80.6% (MutPred2) (Table 1, upper part), using default cutoff values. MutPred2, PP2-HVAR and SNAP2 were the top three predictors in accuracy rate. All algorithms, except FATHMM-U, achieved high sensitivities (> 85%) but low specificity (< 60%). FATHMM-U had a sensitivity and specificity of 63.3% and 79.0%, respectively. In terms of MCC and F-score, which represent the quality of binary classifications, the highest degree of correlation and F-score were observed in MutPred2 (MCC = 0.569, F-score = 0.865), and the next ranked performers were PP2-HVAR (MCC = 0.538, F-score = 0.854) and SNAP2 (MCC = 0.525, F-score = 0.853). According to ROC curves and AUC scores, SNAP2, MutPred2, and PP2-HVAR also performed relatively better than the others (Supplementary Figure S2A and Table S4).
Performance of default and optimized algorithms for prediction of SCN1A missense variants
| Prediction algorithms | Cutoff value | TP | TN | FP | FN | Accuracy (%) | Sensitivity (%) | Specificity (%) | PPV (%) | NPV (%) | F-score | MCC |
|---|---|---|---|---|---|---|---|---|---|---|---|---|
| SIFT | 0.05 | 520 | 144 | 161 | 36 | 77.1 | 93.5 | 47.2 | 76.4 | 80.0 | 0.841 | 0.479 |
| MASS | 1.935 | 504 | 130 | 175 | 52 | 73.6 | 90.6 | 42.6 | 74.2 | 71.4 | 0.816 | 0.390 |
| PP2-HDIV | 0.5 | 518 | 146 | 159 | 38 | 77.1 | 93.2 | 47.9 | 76.5 | 79.3 | 0.840 | 0.479 |
| PP2-HVAR | 0.5 | 514 | 171 | 134 | 42 | 79.6 | 92.4 | 56.1 | 79.3 | 80.3 | 0.854 | 0.538 |
| PROVEAN | −2.5 | 535 | 127 | 178 | 21 | 76.9 | 96.2 | 41.6 | 75.0 | 85.8 | 0.843 | 0.480 |
| SNAP2 | 0 | 530 | 149 | 156 | 26 | 78.9 | 95.3 | 48.9 | 77.3 | 85.1 | 0.853 | 0.525 |
| MutPred2 | 0.5 | 536 | 158 | 147 | 20 | 80.6 | 96.4 | 51.8 | 78.5 | 88.8 | 0.865 | 0.569 |
| I-Mutant 2.0 | 0 | 494 | 58 | 247 | 62 | 64.1 | 88.8 | 19.0 | 66.7 | 48.3 | 0.762 | 0.109 |
| FATHMM-U | −3.0 | 352 | 241 | 64 | 204 | 68.9 | 63.3 | 79.0 | 84.6 | 54.2 | 0.724 | 0.405 |
| FATHMM-W | −1.5 | 555 | 20 | 285 | 1 | 66.8 | 99.8 | 6.6 | 66.1 | 95.2 | 0.795 | 0.198 |
| After optimization of cutoff value for classification accuracy | ||||||||||||
| SIFT | 0.005 | 484 | 221 | 84 | 72 | 81.9 | 87.1 | 72.5 | 85.2 | 75.4 | 0.861 | 0.601 |
| MASS | 2.83 | 429 | 229 | 76 | 127 | 76.4 | 77.2 | 75.1 | 85.0 | 64.3 | 0.809 | 0.507 |
| PP2-HDIV | 0.975 | 477 | 218 | 87 | 79 | 80.7 | 85.8 | 71.5 | 84.6 | 73.4 | 0.852 | 0.576 |
| PP2-HVAR | 0.842 | 487 | 216 | 89 | 69 | 81.6 | 87.6 | 70.8 | 84.5 | 75.8 | 0860 | 0.594 |
| PROVEAN | −3.423 | 494 | 192 | 113 | 62 | 79.7 | 88.8 | 63.0 | 81.4 | 75.6 | 0.850 | 0.543 |
| SNAP2 | 43 | 494 | 242 | 63 | 62 | 85.5 | 88.8 | 79.3 | 88.7 | 79.6 | 0.888 | 0.682 |
| MutPred2 | 0.746 | 489 | 228 | 77 | 67 | 83.3 | 87.9 | 74.8 | 86.4 | 77.3 | 0.872 | 0.632 |
| I-Mutant 2.0 | 0.37 | 526 | 38 | 267 | 30 | 65.5 | 94.6 | 12.5 | 66.3 | 55.9 | 0.780 | 0.125 |
| FATHMM-U | −1.39 | 486 | 138 | 167 | 70 | 72.5 | 87.4 | 45.2 | 74.4 | 66.3 | 0.804 | 0.365 |
| FATHMM-W | −4.05 | 503 | 186 | 119 | 53 | 80.0 | 90.5 | 61.0 | 80.9 | 77.8 | 0.854 | 0.550 |
The data in bold highlights the best tool for predicting SCN1A missense variants before and after optimization. PPV, positive prediction value; NPV, negative prediction value; MCC, Matthews correlation coefficient.
The 10 algorithms generate data on a continuous scale, applying a binary ‘cutoff point’ and report results as ‘pathogenic’ or ‘benign’. When the data points generated by the algorithms were visualized in scatter plots, it was found that the default cutoff values of algorithms were set at a relatively lower level for this particular sodium channel gene (Figure 1). Therefore, the cutoff value was adjusted to a level that had the highest accuracy rate for each algorithm by ROC analysis (Figure 1). The resetting of cutoffs increased the accuracy range of these algorithms from 64.1%–80.6% to 65.5%–85.5% (Table 1, lower part). With the optimization, the best predictor was achieved by SNAP2 (MCC = 0.682, F-score = 0.888), followed by MutPred2 (MCC = 0.632, F-score = 0.872) and SIFT (MCC = 0.601, F-score = 0.861).
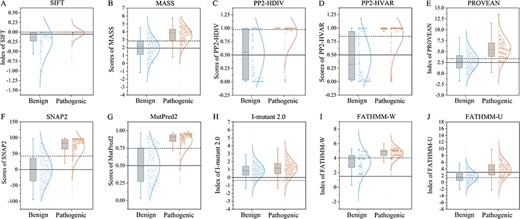
Box and whisker plots showing the distributions of prediction scores of the ten algorithms for SCN1A missense variants. The data were generated by different tools, including SIFT (A), MASS (B), PP2-HDIV (C), PP2-HVAR (D), PROVEAN (E), SNAP2 (F), MutPred2 (G), I-Mutant 2.0 (H), FATHMM-W (I), and FATHMM-U (J). All pathogenic groups are significantly different from the benign groups in prediction scores (n = 596 for pathogenic variants, n = 305 for benign variants, P < 0.001, student’s t-test). The solid and dash lines across the graphs indicate the default and optimized cutoffs (thresholds), respectively. Predictive scores above the cutoff lines indicate pathogenic. Note that most default cutoffs were lower than those optimized by accuracy, indicating that the default predictions have higher false positive rates. Boxes represent the 25–75th percentiles, and lines in the middle of boxes are the medians. The colored points represent individual data.
Stratified prediction based on functional domains of Nav1.1
An accuracy of 90% was proposed for classification of variants as likely pathogenic or likely benign for clinical application [25]. It appears that the accuracy improved by cutoff resetting still did not meet the criterion. Considering that Nav1.1 functional domains differ in their sensitivities to variant damage [16, 26], the variant position could be a confounding variable and need to be concerned. The SCN1A variants were then subgrouped according to their positions in Nav1.1 functional domains, i.e. N, C-Terminus, domain linker, S1–S3 transmembrane domain, voltage sensor and pore region, as in our previous studies [16, 17]. The cutoff of each algorithm was optimized to obtain the highest accuracy for predicting.
As shown in Table 2, the algorithms performed much better in general after the stratification by functional domain of Nav1.1, and further improvements were obtained by resetting the cutoffs. As far as the accuracy rate is concerned, the best algorithm for SCN1A variants was MASS in the N, C-Terminus domain (82.9%), MutPred2 in the domain linker (87.2%), SNAP2 in both S1–S3 in the transmembrane and the voltage sensor domains (85.9% and 92.9%, respectively), and PROVEAN in the pore region (92.5%) (Table 2). MASS, PP2-HVAR, SNAP2 and MutPred2 have the accuracies of over 90% in voltage sensor, while PROVEAN, SNAP2 and MutPred2 have the accuracies of over 90% in pore region. All the 10 algorithms were much better in prediction for SCN1A variants occurring in S1–S3, voltage sensor and pore region, which are the core architectures of Nav1.1, than for variants in the other domains (Table 2, Supplementary Figure S2, and Table S4).
Optimizing with stratification by functional domains for prediction of SCN1A missense variants
| Algorithms | N, C-Terminus | Domain linker | S1–S3 | Voltage sensor | Pore region | ||||||||||||||
|---|---|---|---|---|---|---|---|---|---|---|---|---|---|---|---|---|---|---|---|
| Cutoff | Acc (%) | MCC | Cutoff | Acc (%) | MCC | Cutoff | Acc (%) | MCC | Cutoff | Acc (%) | MCC | Cutoff | Acc (%) | MCC | |||||
| SIFT | ≤0.05 | 64.2 | 0.350 | ≤0.05 | 60.5 | 0.335 | ≤0.05 | 74.8 | 0.446 | ≤0.05 | 88.9 | 0.254 | ≤0.05 | 88.0 | 0.521 | ||||
| MASS | >1.935 | 63.4 | 0.336 | >1.935 | 44.2 | 0.335 | >1.935 | 79.3 | 0.534 | >1.935 | 85.9 | 0.153 | >1.935 | 87.0 | 0.585 | ||||
| PP2-HDIV | >0.5 | 65.9 | 0.400 | >0.5 | 63.4 | 0.444 | >0.5 | 74.8 | 0.426 | >0.5 | 87.9 | 0.125 | >0.5 | 86.1 | 0.440 | ||||
| PP2-HVAR | >0.5 | 69.9 | 0.458 | >0.5 | 69.2 | 0.463 | >0.5 | 77.0 | 0.480 | >0.5 | 88.9 | 0.254 | >0.5 | 86.7 | 0.482 | ||||
| PROVEAN | ≤−2.5 | 65.9 | 0.400 | ≤−2.5 | 52.9 | 0.414 | ≤−2.5 | 74.8 | 0.446 | ≤−2.5 | 85.9 | 0.065 | ≤−2.5 | 92.2 | 0.674 | ||||
| SNAP2 | >0 | 64.2 | 0.350 | >0 | 62.8 | 0.440 | >0 | 74.8 | 0.430 | >0 | 90.9 | 0.406 | >0 | 90.7 | 0.603 | ||||
| MutPred2 | >0.5 | 72.4 | 0.483 | >0.5 | 69.8 | 0.497 | >0.5 | 70.4 | 0.322 | >0.5 | 89.9 | 0.286 | >0.5 | 90.1 | 0.550 | ||||
| I-Mutant 2.0 | <0 | 56.9 | 0.220 | <0 | 33.1 | 0.178 | <0 | 60.0 | −0.033 | <0 | 76.8 | 0.019 | <0 | 80.7 | 0.100 | ||||
| FATHMM-U | <−3.0 | 69.1 | 0.382 | <−3.0 | 69.2 | 0.355 | <−3.0 | 79.3 | 0.596 | <−3.0 | 65.7 | 0.241 | <−3.0 | 65.4 | 0.351 | ||||
| FATHMM-W | <−1.5 | 48.8 | NA | <−1.5 | 33.1 | 0.252 | <−1.5 | 64.4 | NA | <−1.5 | 88.9 | NA | <−1.5 | 85.2 | NA | ||||
| After optimization of cutoff value for with stratification | |||||||||||||||||||
| SIFT | =0 | 72.4 | 0.455 | =0 | 77.3 | 0.384 | <0.02 | 78.5 | 0.418 | ≤0.02 | 89.9 | 0.404 | ≤0.08 | 89.8 | 0.573 | ||||
| MASS | >3.565 | 82.9 | 0.677 | >3.865 | 84.9 | 0.506 | >2.91 | 83.7 | 0.648 | >0.49 | 90.9 | 0.406 | >1.6 | 89.2 | 0.606 | ||||
| PP2-HDIV | >0.922 | 73.2 | 0.504 | >0.997 | 80.8 | 0.469 | >0.890 | 76.3 | 0.462 | >0.872 | 89.9 | 0.359 | >0.77 | 87.3 | 0.531 | ||||
| PP2-HVAR | >0.963 | 78.0 | 0.562 | >0.947 | 82.0 | 0.533 | >0.474 | 78.5 | 0.516 | >0.67 | 90.9 | 0.449 | 0.823 | 87.3 | 0.574 | ||||
| PROVEAN | <−2.035 | 66.7 | 0.426 | ≤−6.103 | 79.7 | 0.326 | <−3.414 | 81.5 | 0.586 | ≤−1.891 | 88.8 | NA | ≤−2.197 | 92.5 | 0.685 | ||||
| SNAP2 | >53 | 79.7 | 0.601 | >57 | 86.6 | 0.589 | >62 | 85.9 | 0.702 | >32 | 92.9 | 0.580 | >−11 | 91.0 | 0.604 | ||||
| MutPred2 | >0.720 | 75.6 | 0.512 | >0.805 | 87.2 | 0.600 | >0.859 | 85.2 | 0.677 | >0.700 | 90.9 | 0.417 | >0.448 | 90.7 | 0.574 | ||||
| I-Mutant 2.0 | <−0.37 | 63.4 | 0.312 | <−3.39 | 77.9 | NA | <2.8 | 64.4 | NA | <2.30 | 88.9 | NA | <2.04 | 85.2 | NA | ||||
| FATHMM-U | <−2.32 | 70.7 | 0.420 | <−5.73 | 79.1 | 0.215 | <−2.03 | 83.7 | 0.637 | <−3.93 | 88.9 | NA | <4.92 | 85.2 | NA | ||||
| FATHMM-W | <−4.19 | 73.2 | 0.474 | <−3.84 | 84.9 | 0.561 | <−4.41 | 65.2 | 0.203 | <−4.13 | 88.9 | NA | <−3.99 | 87.7 | 0.440 | ||||
| Results in total after multiple optimizations | |||||||||||||||||||
| Multiple-step strategy | Acc = 90.5%, sensitivity = 92.6%, specificity = 86.6%, MCC = 0.792 (n = 861) | ||||||||||||||||||
The data in bold highlights the best tool for prediction. Acc, accuracy; MCC, Matthews correlation coefficient; NA, not applicable.
Combination of in silico tools
To improve the prediction performance, we further applied combination strategy. The cutoff shifting of the top three tools for each NaV1.1 domain is shown in Supplementary Figure S3. As shown in Supplementary Table S5, combination of MASS, SNAP2 and PP2-HVAR tools achieved the best accuracy (86.2%) in the subgroup of N, C-Terminus, which was better than any single tool with MASS (82.9%). For domain linkers, combined use of MutPred2, SNAP2 and FATHMM-W exhibited the best performance, improving the accuracy from 87.2% to 89.5%. For the domain of S1–S3, SNAP2 collaborating with MutPred2 and MASS elevated the accuracy from 85.9% to 88.9%. Combination of the algorithms did not significantly improve prediction for variant in the voltage sensor and the pore region.
Ultimately, the predictive accuracy of SCN1A variants ranged from 86.2% to 92.9% for different functional domains, with a general accuracy of 90.5% (sensitivity = 92.6%, specificity = 86.6%) after multiple steps of optimization (Table 2). We then proposed a stepwise prediction strategy for SCN1A variants through the domain-oriented tool selection and cutoff resetting (Figure 2).
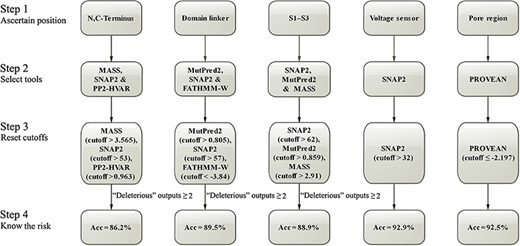
Step-by-step optimizations for predicting the damaging effect of SCN1A missense variants. Acc, accuracy.
Validation of the proposed prediction strategy
To test the effectiveness of the proposed prediction strategy, we performed five-fold cross-validation on the SCN1A data Sets. As shown in Table 3, the stepwise prediction strategy for SCN1A highly improved predictive performance according to 5 rounds of average measures: accuracy (90.2% ± 2.1%), sensitivity (93.5% ± 3.3%), specificity (84.4% ± 4.5%), and MCC (0.788 ± 0.045). The training model based on all variants of SCN1A data set with accuracy of 90.5% and MCC of 0.792 was chosen as the final classifier. In addition, two SCN1A homogenous genes SCN2A and KCNQ2 were selected for further performance validation, which also help to explore the applicability of the proposed strategy to other genes. For SCN2A, 49 likely pathogenic variants from HGMD and 283 likely benign variants from ExAC were retrieved. Similarly, 70 likely pathogenic variants and 172 likely benign variants were collected for KCNQ2. Likewise, SCN2A and KCNQ2 exhibited high performance measures with five-fold cross-validation (Table 3).
Five-fold cross validations of the model predictive ability on SCN1A, SCN2A, and KCNQ2 data sets
| Test | SCN1A data set (n = 861) | SCN2A data set (n = 332) | KCNQ2 data set (n = 242) | |||||||||
|---|---|---|---|---|---|---|---|---|---|---|---|---|
| Acc (%) | Sens (%) | Spec (%) | MCC | Acc (%) | Sens (%) | Spec (%) | MCC | Acc (%) | Sens (%) | Spec (%) | MCC | |
| 1 | 90.9 | 91.2 | 90.5 | 0.806 | 88.2 | 88.0 | 88.3 | 0.734 | 92.6 | 95.2 | 91.5 | 0.838 |
| 2 | 88.1 | 92.0 | 81.0 | 0.738 | 83.5 | 72.0 | 88.3 | 0.603 | 95.6 | 85.7 | 100.0 | 0.898 |
| 3 | 91.5 | 98.2 | 79.4 | 0.815 | 91.8 | 92.0 | 91.7 | 0.811 | 94.1 | 95.2 | 93.6 | 0.868 |
| 4 | 88.1 | 90.3 | 84.1 | 0.741 | 85.9 | 68.0 | 93.3 | 0.648 | 94.1 | 85.7 | 97.9 | 0.861 |
| 5 | 92.6 | 95.6 | 87.3 | 0.838 | 87.1 | 88.0 | 86.7 | 0.712 | 92.6 | 95.2 | 91.5 | 0.838 |
| Average | 90.2 ± 2.1 | 93.5 ± 3.3 | 84.4 ± 4.5 | 0.788 ± 0.045 | 87.3 ± 3.0 | 81.6 ± 10.8 | 89.7 ± 2.7 | 0.702 ± 0.080 | 93.8 ± 1.2 | 91.4 ± 5.2 | 94.9 ± 3.9 | 0.861 ± 0.024 |
Sens, sensitivity; Spec, specificity.
Additional validation was performed in SCN1A variants of damage-confirmed and familial epilepsy. Forty-seven variants evidenced by in vitro functional studies and 58 variants associated with familial epilepsy were used as pathogenic sets, while the 25th percentile of SCN1A missense variants (n = 76) with higher MAFs from ExAC database were used as benign data set. Using our stepwise strategy, 44 of 47 pathogenic variants evidenced by electrophysiological measurements were suggested to be pathogenic, with higher accuracy (90.2%) and MCC score (0.802) than using any single algorithm or ensemble method (Table 4). The exceptional variants include T808S, T1174S, and R1575C, which are located outside the voltage sensor and pore region (at DIIS2, DII-DIII linker and DIVS2, respectively). For the validation of variants from familial epilepsy, the strategy was also superior to any single algorithm or ensemble method, with an accuracy of 85.8% (Table 4).
Validation of the proposed strategy in SCN1A variants with functional confirmation and from familial epilepsy, and in variants of SCN2A and KCNQ2
| Algorithms | Validation using in vitro test data set (n = 123) | Validation using familial data set (n = 134) | Validation using SCN2A data set (n = 332) | Validation using KCNQ2 data set (n = 242) | ||||||||||||
|---|---|---|---|---|---|---|---|---|---|---|---|---|---|---|---|---|
| Acc (%) | Sens (%) | Spec (%) | MCC | Acc (%) | Sens (%) | Spec (%) | MCC | Acc (%) | Sens (%) | Spec (%) | MCC | Acc (%) | Sens (%) | Spec (%) | MCC | |
| SIFT | 65.0 | 95.7 | 46.1 | 0.443 | 65.7 | 91.4 | 46.1 | 0.405 | 75.9 | 63.3 | 78.1 | 0.327 | 59.1 | 81.4 | 50.0 | 0.290 |
| MASS | 61.8 | 89.4 | 44.7 | 0.356 | 63.4 | 87.9 | 44.7 | 0.351 | 57.5 | 83.7 | 53.0 | 0.260 | 61.6 | 82.9 | 52.9 | 0.328 |
| PP2-HDIV | 65.0 | 95.7 | 46.1 | 0.443 | 66.4 | 93.1 | 46.1 | 0.427 | 54.8 | 91.8 | 48.4 | 0.289 | 52.1 | 92.9 | 35.5 | 0.288 |
| PP2-HVAR | 69.9 | 95.7 | 53.9 | 0.506 | 70.9 | 93.1 | 53.9 | 0.494 | 56.0 | 91.8 | 49.8 | 0.298 | 61.1 | 91.4 | 48.8 | 0.378 |
| PROVEAN | 61.0 | 95.7 | 39.5 | 0.390 | 63.4 | 94.8 | 39.5 | 0.394 | 55.4 | 89.8 | 49.5 | 0.281 | 76.0 | 92.9 | 69.2 | 0.563 |
| SNAP2 | 65.9 | 95.7 | 47.4 | 0.453 | 64.9 | 87.9 | 47.4 | 0.375 | 63.6 | 67.3 | 62.9 | 0.218 | 66.9 | 91.4 | 57.0 | 0.443 |
| MutPred2 | 65.9 | 95.7 | 47.4 | 0.453 | 67.2 | 93.1 | 47.4 | 0.438 | 59.6 | 93.9 | 53.7 | 0.338 | 76.9 | 95.7 | 69.2 | 0.589 |
| I-Mutant 2.0 | 43.1 | 85.1 | 17.1 | 0.029 | 47.8 | 87.9 | 17.1 | 0.070 | 25.0 | 79.6 | 15.5 | −0.05 | 39.3 | 80.0 | 22.7 | 0.029 |
| FATHMM-U | 75.6 | 70.2 | 78.9 | 0.487 | 70.1 | 58.6 | 78.9 | 0.385 | 80.4 | 51.0 | 85.5 | 0.325 | 69.4 | 52.9 | 76.2 | 0.282 |
| FATHMM-W | 42.3 | 100.0 | 6.6 | 0.162 | 46.3 | 98.3 | 6.6 | 0.116 | 15.1 | 100.0 | 35.3 | 0.020 | 40.9 | 98.6 | 17.4 | 0.217 |
| CADD | 56.1 | 97.9 | 30.3 | 0.345 | 59.1 | 98.2 | 30.3 | 0.365 | 50.6 | 93.9 | 43.1 | 0.271 | 49.6 | 95.7 | 30.8 | 0.285 |
| CADD-Opta | 71.5 | 95.7 | 56.6 | 0.528 | 67.4 | 82.1 | 56.6 | 0.390 | 85.2 | 0 | 100.0 | NA | 74.0 | 24.3 | 94.2 | 0.266 |
| CADD-Optb | 77.2 | 93.6 | 67.1 | 0.595 | 74.2 | 83.9 | 67.1 | 0.507 | 88.9 | 36.7 | 97.9 | 0.474 | 86.4 | 57.1 | 98.3 | 0.657 |
| Eigen | 51.2 | 97.9 | 22.4 | 0.278 | 52.3 | 92.9 | 22.4 | 0.206 | 50.9 | 95.9 | 43.1 | 0.286 | 52.5 | 90.0 | 37.2 | 0.271 |
| Eigen-Opta | 74.8 | 87.2 | 67.1 | 0.529 | 72.7 | 80.4 | 67.1 | 0.470 | 86.7 | 10.2 | 100.0 | 0.297 | 76.9 | 34.3 | 94.2 | 0.371 |
| Eigen-Optb | 78.0 | 89.4 | 71.1 | 0.588 | 79.5 | 82.3 | 71.1 | 0.531 | 90.1 | 53.1 | 96.4 | 0.565 | 88.8 | 72.9 | 95.3 | 0.720 |
| M-CAP | 40.2 | 100.0 | 2.7 | 0.102 | 43.8 | 100.0 | 2.7 | 0.107 | 22.1 | 98.0 | 9.0 | 0.09 | 29.8 | 100.0 | 59.5 | 0.042 |
| M-CAP-Opta | 83.6 | 95.7 | 76.0 | 0.699 | 80.0 | 85.5 | 76.0 | 0.607 | 90.5 | 55.1 | 96.8 | 0.614 | 81.5 | 71.4 | 85.7 | 0.592 |
| M-CAP-Optb | 86.1 | 93.6 | 81.3 | 0.730 | 82.3 | 83.6 | 81.3 | 0.644 | 93.0 | 69.4 | 97.1 | 0.732 | 90.8 | 71.4 | 98.8 | 0.774 |
| Proposed strategyc | 90.2 | 93.6 | 88.2 | 0.802 | 85.8 | 82.8 | 88.2 | 0.711 | 86.4 | 77.6 | 88.0 | 0.564 | 84.7 | 60.0 | 94.8 | 0.609 |
| Proposed strategyd | 87.3 | 81.6 | 89.7 | 0.702 | 93.8 | 91.4 | 94.9 | 0.861 | ||||||||
The data in bold highlights the best single tool for prediction.
aIndividualized optimization of cutoff value for SCN1A, SCN2A and KCNQ2 data sets. b. Individualized optimization of cutoff value with sub-regional stratification for SCN1A, SCN2A, and KCNQ2 data sets. c. Performance of model trained by using SCN1A data sets. d. Performance of self-trained model by using data sets of SCN2A and KCNQ2, respectively.
To explore the extensibility and reliability of the strategy to genes with similar function and homogenous functional domains, we tested the performance of model trained by SCN1A data sets for variants in SCN2A and KCNQ2. The model trained using SCN1A data set outperformed the traditional tools and ensemble methods with accuracies of 86.4% and 84.7% for SCN2A and KCNQ2, respectively (Table 4). However, it was noted that better performance was achieved by using self-training models of SCN2A and KCNQ2 (Table 3), in which the accuracies were 87.3% and 93.8%, respectively. Much improvement has been observed in predictions for variants in the N, C-terminus and domain linkers of SCN2A and variants in the pore regions of KCNQ2 (Supplementary Table S6 and S7).
We also evaluated the performance of recently developed ensemble tools M-CAP, CADD and Eigen in the data sets for comparison with our strategy. The accuracy rates for variants in these channel genes ranged from 22.1% to 43.8% for M-CAP, 49.6% to 59.1% for CADD and 50.9% to 52.3% for Eigen (Table 4) if they were used in a regular way without individualization. These tools revealed generally high sensitivities but low specificities. Remarkable improvements in predictive performance were observed when they were used with individualization for each gene, and further improvement followed the sub-regional stratification (Table 4), indicating the applicability of the individualized strategy.
Possible prediction of functional alterations and phenotype severity
Missense mutations in SCN1A result in diverse functional alterations that contribute to the pathogenesis of epilepsy [27–30]. These alterations had been categorized as complete loss of function (LOF), partial LOF (pLOF), gain of function (GOF), and gain-and-loss of function (G-LOF), according to altered current and channel kinetics [7, 16]. We then attempted to explore the possible link between in silico prediction and functional outcome of SCN1A missense mutations. The 47 variants with functional data from electrophysiological measurements were subgrouped according to their functional alteration. Prediction scores of the 47 pathogenic variants and 305 benign variants were obtained by using SNAP2, which had the highest accuracy, MCC score, and AUC score after optimization. The mean prediction score of the mutations significantly differed from that of benign variants (P < 0.05, one-way ANOVA). However, post hoc LSD test did not show differences in prediction scores during inter-group comparison of the four functional subgroups. We then attempted to rank the subgroups with functional alteration by their theoretical impairment of channel function as GOF (associated with milder phenotypes), G-LOF, pLOF and LOF (associated with the severe phenotypes) [7]. Spearman correlation analysis showed a weak positive linear relationship (r = 0.408, P = 0.004, n = 47) between SNAP2 prediction scores and channel function alterations (Figure 3A).
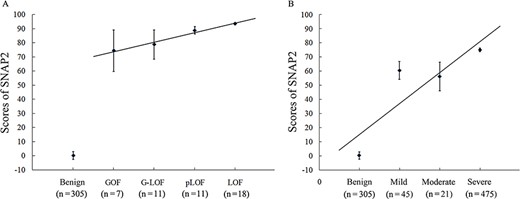
Potential associations between predictive score and functional alteration or phenotypic severity. The SCN1A variants with functional alteration confirmed (A) or documented phenotype (B) were analyzed. Predictive scores were generated by the representative tool SNAP2. According to the Spearman’s rank correlation analysis, the predictive scores had a positive correlation with ranks of functional alteration (r = 0.408, P = 0.004) and phenotypic severity (r = 0.670, P = 0.000).
Missense mutations in the SCN1A gene are associated with a spectrum of epilepsy-related disorders. However, a clear genotype-phenotype association has not been established. Here we tried to explore the possible correlation between phenotype severity and genetic variants in a quantitative model of in silico prediction. A total of 541 mutations were subgrouped into three groups according to the associated phenotypes, which were ranked by clinical severity [7]. The FS or GEFS+ was categorized into mild group, while partial epilepsy or partial epilepsy with febrile seizures plus was categorized into moderate group. The severe group included Dravet syndrome and other forms of epileptic encephalopathies. The SNAP2 algorithm revealed that the mean prediction scores of epilepsy-associated variants differed significantly from that of benign variants (P < 0.05, one-way ANOVA); and there was a high positive correlation between in silico prediction scores and phenotypic severity (r = 0.670, P = 0.000, n = 846, Spearman's rank correlation) (Figure 3B). The post-hoc LSD test indicated that the prediction scores of both mild and moderate subgroups significantly differed from that of severe group (P < 0.05).
Discussion
In this study, we evaluated the predictive efficacy of 10 commonly used in silico algorithms for SCN1A variants. The performance of these algorithms was less satisfactory for the specific gene SCN1A when compared with the general performance that was previously claimed for all genes. Retraining with stepwise approaches, including cutoff resetting, domain-based stratification and combination of predicting tools, increased the accuracy rates and MCC scores. The individualizing strategy with sub-regional stratification also improved the performance of the ensemble algorithms like M-CAP, CADD and Eigen, which were validated in two completely independent test sets, SCN2A and KCNQ2. This study highlights the need of individualized optimization for genes with molecular sub-regional stratification in practice.
To date, many prediction tools have been developed. Current tools are developed for application to all variants throughout the genome. Training by all variants, irrespective of gene discrepancy and functional complexity, may encounter the problems of underfitting, in which data were mixed up and lost details to fit the structure-function relation of a specific gene. In this respect, these all-purpose models may be too simple to fit well with variants in a specific gene. These algorithms generated relatively high error rates with low specificities and low MCC scores for SCN1A missense variants when they were conventionally used without optimization. Any of the algorithms did not reach 90% in accuracy for predicting pathogenic classification of SCN1A variants, which was proposed by the American College of Medical Genetics and Genomics [25]. The results are consistent with a previous study that showed high rates of error from in silico derived classifications [30]. Thus, stereotypical applications of these tools are not sufficient for predicting the damaging effect of variants in a specific gene like SCN1A.
New strategies or optimized ensemble algorithms such as M-CAP have been developed. M-CAP employs a combination strategy by collaborating classical tools (including SIFT, Polyphen-2 and CADD) in a novel model and outperforms the single algorithms with high sensitivity [20]. However, M-CAP revealed low specificity with an accuracy of only 40.2% for the SCN1A variants evidenced by in vitro functional studies and 43.8% for variants associated with familial epilepsy, if it was used in a regular way without individualized optimization (Table 4). Previously, through adjusting the threshold of M-CAP, better performance had been obtained for missense variants of sodium channel (SCN) genes [30]. Further improvement had been observed by using an individualized predictor called SCN index, which was based on weighted combination of the M-CAP and several classical algorithms with logistic regression. However, it appeared to be less efficient for variants in KCNQ2 and KCNQ3 with an accuracy of less than 80% [30]. These findings suggested the need for individualized optimization.
How to optimize the predicting tools is still a major challenge in practice. Generally, proteins consist of several structural domains that are associated with distinct functional roles and potentially have different sensitivities to genetic defects. Our previous study indicated that the functional domains of SCN1A are associated with distinct functional impairments [16], which are related to clinical phenotype [7, 26]. In this study, improvement in prediction of SCN1A variants was obtained by individualizing the cutoffs (Table 1). Further improvement in prediction has been achieved when the prediction was individualized according to the locations of variants in functional domains (Table 2). It is noted that the prediction accuracy was particularly high for variants in some regions (Table 2, Supplementary Table S6 and S7). In the validation data set of SCN1A variants that were functionally determined, the actual prediction accuracy was 100% for variants in the voltage sensor and pore regions. Similar results were obtained for variants in KCNQ2 (Supplementary Table S7). These results suggest that stratification by functional domains should be a critical consideration in predicting the damaging effect of genetic variants.
In this study, we used the prediction scores as a mathematical description of genetic variants and explore the relationship between prediction scores and the functional defects/phenotypic severity of SCN1A variants. Spearman correlation analysis showed linear relationship between the SNAP2 prediction scores and the ranked functional defects/phenotype severity. This study also presented 40 SCN1A variants that overlapped between the mutation databases and SNP database. These overlapped variants did not show significant difference with benign missense variants in MAFs, and their prediction scores also presented intermediately (Supplementary Figure S1). Therefore, it appears appropriate to set a medial ‘possible pathogenic’ category for this kind of variants in practical use of the prediction algorithms.
In practical application, several additional points should be considered
First, how this proposed strategy could be generalized to other genes. The proposed strategy is a process for calibration of underfitting algorithms. By individualized calibration with molecular sub-regional stratification, the performance of existing in silico algorithms improved apparently, suggesting the approach were generally applicable. However, how to individualize for each gene is a major task. The present study demonstrated that individualization with stratification by molecular sub-regions as pore region, voltage sensor, D-linkers, etc., was applicable for SCN1A, SCN2A and KCNQ2, which are voltage-gated ion channels and share similar functional sub-regions. However, genes are distinct in their structure–function relation. Our recent study showed that several genes, such as ARHGEF9 [31], DEPDC5 and GRIN1 (unpublished data), have completely different molecular sub-regions with distinct pathogenic significance. Therefore, individualization with stratification by molecular sub-regions would be, generally, a principle, but determining the pathogenically significant sub-regions of each gene needs further fine work. On the other hand, this approach needs training data of variants that are known to be disease-causing or benign, thus may have difficulties in applying to uncharacterized genes. The present study demonstrated that model trained using SCN1A data set outperformed the traditional and ensemble methods for variants of SCN2A and KCNQ2 (Table 4), suggesting that a model trained by data sets from a gene with known disease causing or benign variants was possibly applicable to genes with similar function and homogenous functional domains. However, it should be noted that better performance have been achieved by using self-training models for SCN2A and KCNQ2 variants. Thus, we propose to define the sub-molecular pathogenic implication of each gene and then train the model accordingly. In case of insufficiency of data set with known disease-causing or benign variants, model trained using data from a gene with similar function and homogenous functional domains may be tried.
Second, the balance between sensitivity and specificity is a practical issue. This study showed that several algorithms have advantages in sensitivity, such as M-CAP, to which priority should be given in data filtrations. In evaluating pathogenicity of variants, however, accuracy should be emphasized, as suggested by ACMG [25].
Third, the prediction indexes may be influenced by selection of the variants for building pathogenic or benign test set. The effects of genetic variants vary and potentially present a continuous distribution with overlaps between pathogenic variants and benign variants, as shown by the distribution of the prediction scores (Figure 1). Using a clear-cut indicator, such as MAF, to select variants at the two extremes to build pathogenic test set or benign test set may produce ‘false’ high accuracy for a prediction model [30]. Similarly, a clear-cut damaging/benign prediction appeared to be difficult for some variants in practical application, and a medial ‘possible pathogenic’ set appeared appropriate.
Fourth, it is unknown exactly why the current predicting tools perform so differently. These tools employ evolutionary, sequence or structural information to characterize residue substitutions; and predictions are obtained via mathematical, rule-based, or statistical learning methods [1, 32]. The present study demonstrated that MutPred2, PP2-HVAR and SNAP2, which are sequence–structure based [33–35], achieved relatively higher discriminative power for SCN1A variants. PROVEAN is mainly based on sequence information [36] and revealed higher accuracy for variants in the pore regions of SCN1A, for which the high conservative sequence in this region may be one of the explanations. Our study emphasizes applicable strategies to calibrate the models with molecular sub-regional stratification, while keeping the application of the available in silico tools at the current stage. However, it is necessary to develop sensitive algorithms for specific functional domains and the related individualized softwares in the future.
In conclusion, since each gene is unique in functional role, function–structure relation and sensitivity to variation, individualized optimization of prediction for variants in specific gene is required. We provided an individualized strategy with molecular sub-regional stratification for SCN1A, which was also applicable for voltage-gated channel genes, SCN2A and KCNQ2. It is suggested that the principle of sub-regional stratification is potentially applicable to genes with similar significant sub-regions. Further fine work is required to determine the pathogenically significant sub-regions of each gene, which would help to develop individualized software for variant prediction in the future.
Individualized optimization with molecular sub-regional stratification increased the predictive performance of current algorithms for variants in SCN1A.
The proposed strategy was applicable to voltage-gated channel genes SCN2A and KCNQ2, suggesting that the principle of sub-regional stratification is potentially applicable to genes with similar pathogenically significant sub-regions.
Prediction scores were linearly correlated with the degree of functional defects and the severity of clinical phenotypes and could be a mathematical description of genotypes.
Funding
This work was supported by Omics-based precision medicine of epilepsy being entrusted by Key Research Project of the Ministry of Science and Technology of China (grant 2016YFC0904400), the National Natural Science Foundation of China (grant 81501125, 81571273 and 81571274), internet medical innovation platform project of health commission of Guangdong province: biomedical large database of genetic pathogenicity analysis, Science and Technology Project of Guangzhou (grant 201804020046, 201508020011, 201604020161 and 201607010002). The funders had no role in study design, data collection, data analysis, and decision to prepare or publish the manuscript.
Bin Tang is a research fellow at the Institute of Neuroscience and the Second Affiliated Hospital of Guangzhou Medical University.
Bin Li is a MD candidate at the Institute of Neuroscience and the Second Affiliated Hospital of Guangzhou Medical University.
Liang-Di Gao is a research fellow at the Institute of Neuroscience and the Second Affiliated Hospital of Guangzhou Medical University.
Na He is a physician at the Institute of Neuroscience and Department of Neurology of the Second Affiliated Hospital of Guangzhou Medical University.
Xiao-Rong Liu is a professor at the Institute of Neuroscience and the Second Affiliated Hospital of Guangzhou Medical University.
Yue-Sheng Long is a professor at the Institute of Neuroscience and the Second Affiliated Hospital of Guangzhou Medical University.
Yang Zeng is a research fellow at the Institute of Neuroscience and the Second Affiliated Hospital of Guangzhou Medical University.
Yong-Hong Yi is a professor at the Institute of Neuroscience and Department of Neurology of the Second Affiliated Hospital of Guangzhou Medical University.
Tao Su is an associate professor at the Institute of Neuroscience and the Second Affiliated Hospital of Guangzhou Medical University.
Wei-Ping Liao is the director of the Institute of Neuroscience and the Second Affiliated Hospital of Guangzhou Medical University and an Associated Editor of SEIZURE. His major researches are on genetics. He won Ambassador for Epilepsy among others.
References
Author notes
Bin Tang and Bin Li contributed equally to this work.
