


Abstract
RNA post-transcriptional modifications play a crucial role in a myriad of biological processes and cellular functions. To date, more than 160 RNA modifications have been discovered; therefore, accurate identification of RNA-modification sites is fundamental for a better understanding of RNA-mediated biological functions and mechanisms. However, due to limitations in experimental methods, systematic identification of different types of RNA-modification sites remains a major challenge. Recently, more than 20 computational methods have been developed to identify RNA-modification sites in tandem with high-throughput experimental methods, with most of these capable of predicting only single types of RNA-modification sites. These methods show high diversity in their dataset size, data quality, core algorithms, features extracted and feature selection techniques and evaluation strategies. Therefore, there is an urgent need to revisit these methods and summarize their methodologies, in order to improve and further develop computational techniques to identify and characterize RNA-modification sites from the large amounts of sequence data. With this goal in mind, first, we provide a comprehensive survey on a large collection of 27 state-of-the-art approaches for predicting N1-methyladenosine and N6-methyladenosine sites. We cover a variety of important aspects that are crucial for the development of successful predictors, including the dataset quality, operating algorithms, sequence and genomic features, feature selection, model performance evaluation and software utility. In addition, we also provide our thoughts on potential strategies to improve the model performance. Second, we propose a computational approach called DeepPromise based on deep learning techniques for simultaneous prediction of N1-methyladenosine and N6-methyladenosine. To extract the sequence context surrounding the modification sites, three feature encodings, including enhanced nucleic acid composition, one-hot encoding, and RNA embedding, were used as the input to seven consecutive layers of convolutional neural networks (CNNs), respectively. Moreover, DeepPromise further combined the prediction score of the CNN-based models and achieved around 43% higher area under receiver-operating curve (AUROC) for m1A site prediction and 2–6% higher AUROC for m6A site prediction, respectively, when compared with several existing state-of-the-art approaches on the independent test. In-depth analyses of characteristic sequence motifs identified from the convolution-layer filters indicated that nucleotide presentation at proximal positions surrounding the modification sites contributed most to the classification, whereas those at distal positions also affected classification but to different extents. To maximize user convenience, a web server was developed as an implementation of DeepPromise and made publicly available at http://DeepPromise.erc.monash.edu/, with the server accepting both RNA sequences and genomic sequences to allow prediction of two types of putative RNA-modification sites.
Introduction
RNA modifications include the addition of chemical groups to the four canonical bases or local structural changes [1, 2]. RNA molecules can undergo a wide array of post-transcriptional modifications, including N1-methyladenosine (m1A), N6-methyladenosine (m6A), 5-methylcytosine (m5C) and pseudouridine (Ψ) [1–5]. Recent studies show that RNA post-transcriptional modifications play crucial roles in diverse cellular processes [6]. For example, m1A is catalyzed by methyltransferases, which add a methyl group to the nitrogen at the 1st position of the adenosine base [7] and can influence the structure and function of both transfer (t) RNA and ribosomal (r) RNA [8, 9]. m6A involves methylation modification of the nitrogen at the 6th position of the adenosine base [10, 11] and is involved in a variety of biological processes, including RNA location and degradation [12], RNA-structure dynamics [13], alternative splicing [14], primary microRNA processing [15], cell differentiation and reprogramming [16, 17] and regulation of circadian clock [18]. However, the identity and precise roles for the majority of RNA-modification sites remain unknown [2, 5].
Information concerning the positions of RNA-modification sites plays a crucial role in characterizing the mechanisms and functions of those modifications. Due to recent advances in genomics and molecular biology, biologists are able to experimentally identify various types of RNA modifications. Consequently, more than 160 modifications have been identified within RNAs, with these deposited and annotated in public databases [19]. Such experimentally validated RNA modifications are useful for revealing their important patterns and novel functions. Despite their efficacy, most currently available high-throughput experimental techniques exhibit limitations due for the following reasons: (1) although certain techniques, such as MeRIP [20], m6A-seq [21] and PA-m6A-seq [22], can be used to identify m6A sites and detect tens of thousands of m6A-containing sequence fragments (~100-nt length) in the transcriptome, they cannot locate the exact positions of the m6A sites and (2) some techniques, such as miCLIP [23], can detect m6A sites at the single-nucleotide resolution level, but are unable to identify different RNA modifications that simultaneously occur in the same RNA molecule [24]. For example, adenosine usually undergoes m1A and m6A modifications [25], making it difficult to determine whether different types of RNA modifications might occur simultaneously.
To address this problem, computational methods can be used in tandem with the experimental identification of RNA-modification sites. Many of these methods have been recently developed to predict RNA-modification sites. Amongst the different types of RNA-modification sites, the most highly abundant gold-standard (e.g. m6A sites at single-nucleotide resolution) datasets are available for m6A sites. Therefore, several computational methods [26–35] were developed to predict m6A sites with SRAMP [36], Gene2Vec [37], BERMP [38] and WHISTLE [39] being four representative and state-of-the art tools for m6A site prediction. SRAMP combines three random forest (RF) classifiers by exploiting sequence-derived features to predict mammalian m6A sites [36], and Gene2Vec [37] and BERMP [38] were developed to identify m6A sites based on convolutional neural networks (CNNs) and recurrent neural networks, respectively. WHISTLE [39] used the support vector machine (SVM) and integrated 35 additional genomic features besides the conventional sequence features to predict the m6A sites. For m1A-site prediction, RAMPred accepts nucleotide-chemical properties and nucleotide composition as the input to SVM to detect potential m1A sites in eukaryotic transcriptomes [40]. Generally, the workflow of these methods can be summarized in Figure 1. They differ in a variety of aspects in terms of model construction, including benchmark dataset construction, features employed and software availability and utility. Despite significant research efforts being devoted to the development of computational methods for RNA-modification site prediction, little work has been done to systematically summarize and evaluate the state-of-the-art approaches, which could potentially shed a light on the bottlenecks or missing features, which need to be addressed to improve the algorithm design for RNA-modification sites prediction.
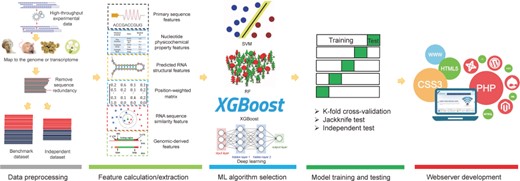
Overview of the current computational approaches for m1A and m6A sites prediction. To establish a useful predictor for m1A and m6A sites, the five following procedures are often involved: (1) data processing; (2) feature calculation/extraction; (3) machine learning algorithm selection; (4) model training and testing, and (5) webserver development.
With this goal in mind, in this article, we first provide a comprehensive survey regarding the state-of-art computational methods. We discuss a wide range of aspects including the dataset quality, core algorithms selected for individual methods, feature selection techniques employed, performance evaluation strategy and user experience. Based on our survey and findings, we further propose a novel framework called Deep CNN-based Predictor of RNA modification sites (DeepPromise) based on the use of deep CNN to predict two major types of RNA modifications (m1A and m6A sites). DeepPromise utilizes readily available RNA sequence information as the input to the CNN models in order to make the prediction. The method achieved the best predictive performance for two major types of RNA post-transcriptional modification sites as compared with existing sequence-based methods and when evaluated by both cross-validation and independent tests. Moreover, to facilitate high-throughput identification of these two types of RNA modifications and maximize user convenience, we implemented an online web server for DeepPromise, which is freely accessible at http://DeepPromise.erc.monash.edu/. We anticipate that DeepPromise will be used as a powerful bioinformatics tool for the discovery of novel putative RNA modifications, experimental hypothesis generation and functional validation efforts.
Materials and methods
State-of-the-art computational approaches for m1A and m6A sites prediction
More than 20 computational approaches have been developed for prediction of m1A and m6A sites. These methods differ in a variety of aspects, including the benchmark dataset, sequence and/or structural descriptors used, physicochemical properties and genomics features employed, feature selection techniques and targeted RNA modification types, etc. In Table 1, we summarize 27 computational approaches for m1A and m6A site prediction according to the algorithm selected, features employed, dataset size, dataset quality, performance evaluation strategy, web server availability, option of batch prediction, window size and species. A general flow chart of computational methods for the prediction of m1A and m6A sites is shown in Figure 1.
Summary of the reviewed predictors for m1A and m6A
| Tool | Modification | Algorithm | Feature selection | Encoding scheme(s) | Benchmark dataset size (modification sites) | Dataset quality | Evaluation strategy | URL/stand-alone package | Option of batch prediction | Adjustment of predictor thresholds | Window size | Species | Reference |
|---|---|---|---|---|---|---|---|---|---|---|---|---|---|
| RAMPred | m1A | SVM | None | NCP ANF | 6366 (H. sapiens) 1064 (M. musculus) 483 (S. cerevisiae) | Non-single-nucleotide resolution | Jackknife test | http://lin-group.cn/server/RAMPred | Yes | No | 41 | H. sapiens M. musculus S. cerevisiae | [40] |
| iRNA-3typeA | m1A m6A | SVM | None | NCP ANF | 6366 (H. sapiens; m1A) 1064 (M. musculus; m1A) 1130 (H. sapiens; m6A) 725 (M. musculus; m6A) | Non-single-nucleotide resolution | Jackknife test | http://lin-group.cn/server/iRNA-3typeA/ | Yes | No | 41 | H. sapiens M. musculus | [41] |
| iRNA-Methyl | m6A | SVM | None | PseDNC RNA property parameters | 1307 | Non-single-nucleotide resolution | 10-fold cross-validation Jackknife test | http://lin-group.cn/server/iRNA-Methyl | Yes | No | 51 | S. cerevisiae | [42] |
| m6Apred | m6A | SVM | None | NCP ANF | 1307 (832/475) | Non-single-nucleotide resolution | Jackknife test Independent test | http://lin-group.cn/server/m6Apred.php | Yes | All High Medium Low | 21 | S. cerevisiae | [43] |
| M6ATH | m6A | SVM | None | NCP ANF | 394 | Non-single-nucleotide resolution | Jackknife test | http://lin-group.cn/server/M6ATH | Yes | No | 25 | A. thaliana | [29] |
| RNA-MethylPred | m6A | SVM | None | BPB DNC KNN score | 1307 | Non-single-nucleotide resolution | Jackknife test | MATLAB package | No | No | 51 | S. cerevisiae | [33] |
| TargetM6A | m6A | SVM | IFS | PSNP PSDP k-mer | 1307 (Met2614) 832 (Train1664) | Non-single-nucleotide resolution | Jackknife test | http://csbio.njust.edu.cn/bioinf/TargetM6A (Not available) | No | No | 51/21 | S. cerevisiae | [32] |
| pRNAm-PC | m6A | SVM | None | PCPM | 1307 | Non-single-nucleotide resolution | Jackknife test | http://www.jci-bioinfo.cn/pRNAm-PC | Yes | No | 51 | S. cerevisiae | [44] |
| RNAMethPre | m6A | SVM | None | binary k-mer Relative position value MFE | 29,457 (H. sapiens) 31,728 (Mouse) | Single- nucleotide resolution | Fivefold cross-validation Independent test | http://bioinfo.tsinghua.edu.cn/RNAMethPre/index.html (Not available) | NA | NA | 101 | H. sapiens M. musculus | [31] |
| AthMethPre | m6A | SVM | None | binary k-mer | 6581 | Non-single-nucleotide resolution | Fivefold cross-validation & Independent test | http://bioinfo.tsinghua.edu.cn/AthMethPre/index.html (Not available) | NA | NA | 101 | A. thaliana | [30] |
| M6A-HPCS | m6A | SVM | None | PCPM PseDNC AC CC | 1307 | Non-single-nucleotide resolution | Jackknife test 10-fold cross-validation | http://csbio.njust.edu.cn/bioinf/M6A-HPCS (Not available) | NA | NA | 51 | S. cerevisiae | [45] |
| SRAMP | m6A | RF | None | binary KNN score spectrum | 55,706 (Full transcript mode) 46,992 (Mature mRNA mode) | Single- nucleotide resolution | Fivefold cross-validation | http://www.cuilab.cn/sramp/ | No | No | 251 | H. sapiens M. musculus | [36] |
| MethyRNA | m6A | SVM | None | NCP ANF | 1130 (H. sapiens) 725 (M. musculus) | Non-single-nucleotide resolution | Jackknife test | http://lin-group.cn/server/methyrna | Yes | No | 41 | H. sapiens M. musculus | [35] |
| RAM-ESVM | m6A | SVM | None | PseDNC Motif features | 1307 | Non-single-nucleotide resolution | Jackknife test | http://server.malab.cn/RAM-ESVM/ | Yes | No | 51 | S. cerevisiae | [46] |
| iRNA-PseColl | m6A | SVM | None | NCP ANF | 1130 | Non-single-nucleotide resolution | Jackknife test | http://lin-group.cn/server/iRNA-PseColl/ | Yes | NA | 41 | H. sapiens | [47] |
| RAM-NPPS | m6A | SVM | RFE FSDI MRMD | NPPS | 8366 (H. sapiens) 1307 (S. cerevisiae) 394 (A. thaliana) | Mixed | Jackknife test | http://server.malab.cn/RAM-NPPS/ | Yes | No | 51 | H. sapiens S. cerevisiae A. thaliana | [26] |
| iMethyl-STTNC | m6A | SVM | None | STTNC | 1307 | Non-single-nucleotide resolution | Jackknife test | No | No | No | 51 | S. cerevisiae | [48] |
| iRNA(m6A)-PseDNC | m6A | SVM | None | PseDNC | 1307 | Non-single-nucleotide resolution | 10-fold cross-validation | http://lin-group.cn/server/iRNA(m6A)-PseDNC.php | Yes | No | 51 | S. cerevisiae | [49] |
| BERMP | m6A | BGRU | None | ENAC RNA word embedding | 53,000 (Mammalian full transcript mode) 44,853 (Mammalian Mature mRNA mode) 1100 (S. cerevisiae) 2100 (A. thaliana) | Mixed | 10-fold cross-validation | http://www.bioinfogo.org/bermp | Yes | Low Moderate High Very high | 251 (Mammalian) 51 (S. cerevisiae) 101 (Arabidopsis thaliana) | H. sapiens M. musculus S. cerevisiae A. thaliana | [38] |
| M6AMRFS | m6A | XGBoost | SFS | Dinucleotide binary Local position-specific dinucleotide frequency | 1307 (S. cerevisiae) 1130 (H. sapiens) 725 (M. musculus) 1000 (A. thaliana) | Non-single-nucleotide resolution | 10-fold cross-validation jackknife test | http://server.malab.cn/M6AMRFS/ | Yes | No | 51 (S. cerevisiae) 41 (H. sapiens) 41 (M. musculus) 25 (A. thaliana) | S. cerevisiae H. sapiens M. musculus A. thaliana | [50] |
| RFAthM6A | m6A | RF | None | PSNSP PSDSP KSNPF k-mer | 2518 | Non-single-nucleotide resolution | Fivefold cross-validation Independent test | Rscript | Yes | NA | 101 | A. thaliana | [27] |
| M6APred-EL | m6A | Ensemble of SVM | None | PS(k-mer)NP PCPs RFHC-GACs | 1307 | Non-single-nucleotide resolution | 10-fold cross-validation | http://server.malab.cn/M6APred-EL/ | Yes | No | 51 | S. cerevisiae | [51] |
| — | m6A | SVM | None | NCP ANF | 2055 | Non-single-nucleotide resolution | 10-fold cross-validation Independent test | No | No | No | 41 | E. coli | [52] |
| HMpre | m6A | XGBoost | None | Site Location Entropy Information SNP features Binary CPD Kmers | 26,512 | Single- nucleotide resolution | 10-fold cross-validation Independent test | No | No | No | 51 | H. sapiens | [53] |
| WHISTLE | m6A | SVM | Perturb method | NCP CNF Genome-derived features | 20,516 17,383 | Single- nucleotide resolution | Fivefold cross-validation Independent test | www.xjtlu.edu.cn/biologicalsciences/whistle http://whistle-epitranscriptome.com | No | No | NA | H. sapiens | [39] |
| DeepM6APred | m6A | SVM | None | Deep features NPPS | 1307 | Non-single-nucleotide resolution | 10-fold cross-validation | http://server.malab.cn/DeepM6APred/ | Yes | No | 51 | S. cerevisiae | [54] |
| Gene2Vec | m6A | CNN | None | One-hot Neighbouring methylation state RNA word embedding Gene2vec | 56,557 | Single- nucleotide resolution | Training and validation | http://server.malab.cn/Gene2vec/ | Yes | No | 1001 | H. sapiens M. musculus | [37] |
Abbreviations: PseDNC, pseudo dinucleotide composition; NCP, nucleotide chemical property; ANF, accumulated nucleotide frequency; BPB, bi-profile bayes; DNC, dinucleotide composition; KNN, k nearest neighbour; PSNP, position-specific nucleotide propensity; PSDP, position-specific dinucleotide propensity; NC, nucleotide composition; MFE, minimum free energy; PCPM, physical-chemical property matrix; AC, auto-covariance; CC, cross-covariance; NPPS, nucleotide pair position specificity; STTNC, split-tetra-nucleotide composition; ENAC, Enhanced nucleic acid composition; PSNSP, position-specific nucleotide sequence profile; PSDSP, position-specific dinucleotide sequence profile; KSNPF, K-spaced nucleotide pair frequencies; PS(k-mer) NP, position-specific k-mer nucleotide propensity; PCPs, physical-chemical properties; RFHC-GACs, ring-function-hydrogen-chemical properties without GAC; CPD, chemical property with density; IFS, incremental feature selection; RFE, recursive feature elimination; FSDI, feature selection based on discernibility and independence of a feature; MRMD, maximal relevance and maximal distance; SFS, sequence forward search.
Dataset construction
High-throughput experimental identification of m1A and m6A sites currently relies on use of next-generation sequencing-based techniques. Such techniques can be divided into two categories according to the mapping resolution. The techniques such as MeRIP [20, 55], M6A-seq [21] and PA-m6A-seq [22] lacked the resolution for identifying the precise individual modified base, while the techniques like miCLIP [23] and m1A-seq [56] are able to provide the single-nucleotide resolution mapping of the m6A and m1A sites. Therefore, as shown in Table 1, the datasets of the developed methods can be also divided into two categories (i.e. single-nucleotide resolution and non-single-nucleotide resolution) based on the dataset quality. A total of 17 methods listed in Table 1 were developed based on the non-single-nucleotide resolution dataset, while only 5 methods were based on the single-nucleotide resolution dataset. The datasets of the remaining methods consisted of both categories.
In addition, there were two modes in building the benchmark dataset, that is, the full transcript mode that used the genomic sequences as its input and the mature mRNA mode that considered the cDNA sequences instead. Most of the studies built their benchmark datasets based on the mature mRNA mode, while only a few methods like RNAMethPre [31], SRAMP [36] and WHISTLE [39] considered both modes. To reduce the potential bias introduced by sequence homology, a threshold of 60–85% sequence similarity was commonly used to remove the sequence redundancy in the resulting datasets. For each of the modification sites, a 2n + 1 nt local sequence window centred around the modified or non-modified site will be extracted, and the value of 2n + 1 varies largely depending on the developed methods, ranging from 21 to 1001 (Table 1).
Machine learning algorithms employed
As listed in Table 1, all the computational approaches for m1A and m6A sites prediction were built using well-established machine learning algorithms. These algorithms include SVM, RF, eXtreme Gradient Boosting (XGBoost) and deep learning. Based on our survey, SVM is the most commonly used machine learning algorithm and is often considered as the ‘algorithm-of-choice’ for building computational models (Table 1). We briefly describe these algorithms below.
Support vector machine
SVM aims to accurately classify samples by generating the optimal hyperplanes based on the feature dimensionality of the training data [57, 58]. A variety of kernels have been developed for SVM, including Gaussian radial basis function (RBF), linear kernel, polynomial kernel, sigmoid kernel, etc. Although the resulting mapping formula generated by SVM is often not interpretable, the satisfactory prediction performance it achieves makes it usually the ‘first choice’ adopted in many bioinformatics studies [26, 29–33, 35, 39–52, 54]. Amongst the alternative kernels, the RBF kernel was used in almost all the SVM-based methods reviewed in this study. The grid search strategy was used to optimize the regularization parameter C and the kernel width parameter g.
Random forest
RF [59] is another well-established and widely employed algorithm, which is essentially an ensemble of a number of decision trees. One decision tree contains a single root node, several leaf nodes denote the final decisions and many intermediate nodes describe the conditions supporting the final decisions [60]. A path from the root node to the leaf node is called a rule. Accordingly, an important advantage of RF is its interpretability. For example, Zhou et al. used the overrepresented rules extracted from the constructed RF classifiers to characterize the most useful features for the prediction of m6A sites [36]. When applying RF, one should bear in mind that the number of decision trees is a determining parameter for the performance of the classifier and should thus be examined exhaustively specific for the application or biological question, in order to achieve an optimal prediction performance.
eXtreme gradient boosting
XGBoost is a tree boosting algorithm [61] and an advanced implementation of the gradient boosting algorithm. Due to its empirical performance, it has been widely applied to solve many classification problems [50, 53] in recent years. XGBoost has some attractive advantages over other cost-sensitive classifiers: firstly, the regularization in its loss function can effectively control the complexity of the model and avoid overfitting; secondly, the combination of multithreading, data compression and fragmentation methods allow a faster learning speed; thirdly, XGBoost is of high flexibility and allows users to define custom optimization objectives and evaluation criteria. Moreover, XGBoost classifier can learn from imbalanced training data by setting class weight and taking the receiver-operating curve (ROC) as the evaluation criteria. For example, Zhao et al. employed a cost-sensitive XGBoost classifier to resolve the data imbalance issue for the prediction of m6A sites [53].
Deep learning architectures
Deep learning architectures are basically artificial neural networks of multiple non-linear layers [62]. Deep learning-based methods including CNNs and recurrent neural networks (RNNs) have been applied for the prediction of RNA-modification sites [37, 38]. CNNs consist of the convolutional layers, non-linear layers and pooling layers, while RNNs are designed to utilize the sequential information of the input data with cyclic connections amongst the building blocks like long short-term memory units (LSTMs) [63] or gated recurrent units (GRUs) [64]. As an example of the developed methods based on the deep learning architectures listed in Table 1, Huang et al. developed a cross-species RNN classifier named BERMP [38] based on bidirectional gated recurrent unit (BGRU) [65] and demonstrated that the deep learning framework was more suitable for addressing the prediction task with larger datasets, whereas Zou et al. proposed a CNN-based predictor for the prediction of m6A sites [37].
Different types of features employed by the reviewed approaches for m1A and m6A site prediction
| Feature type | Feature | Biological interpretation | Reference |
|---|---|---|---|
| RNA primary sequence-derived features | ANF | The accumulated nucleotide frequency di of any nucleotide nj at position i in a RNA sequence is calculated by ${d}_i=\frac{1}{\mid {N}_i\mid }{\sum}_{j=1}^lf\Big({n}_j\Big),\kern0.5em f\Big({n}_j\Big)=\Big\{\begin{array}{c}1\kern1.00em \mathrm{if}\ {n}_j=q\\ {}0\kern1em \mathrm{other}\ \mathrm{case}\end{array}\Big.$ where l is the sequence length, |Ni| is the length of the i-th prefix string {n1, n2, …, ni} in the sequence, q ∈ {A, C,G, U}. | [29, 35, 39–41, 43, 47, 52, 53] |
| DNC | The DNC is the frequency of the adjoining dinucleotides in the RNA sequences. | [33] | |
| k-mer | For k-mer descriptor, the RNA sequences are represented as the occurrence frequencies of k neighbouring nucleic acids. | [27, 30–32, 53] | |
| PS(k-mer)NP | Position-specific k-mer nucleotide propensity (PS(k-mer)) | [51] | |
| Binary/One-hot | The position-specific information of the amino acids surrounding modification sites. | [30, 31, 36, 37, 53] | |
| Dinucleotide binary | There are a total of 16 possible dinucleotides. In this descriptor, each dinucleotide can be encoded into a 4-dimensional 0/1 vector. | [50] | |
| Local position-specific dinucleotide frequency | For a given sequence, the feature vector of this descriptor can be denoted as |$\Big({f}_2,{f}_3,\cdots, {f}_l\Big)$|, where fi is calculated as: |$\mathrm{f}=\frac{1}{\Big|{N}_i\Big|}C\Big({X}_{i-1}{X}_i\Big),2\le i\le l$|, where l is the length of the given sequence, |Ni| is the length of the i-th prefix string |$\Big\{{X}_1,{X}_2,\cdots, {X}_i\Big\}$|in the sequence, and |$C\Big({X}_{i-1}{X}_i\Big)$| is the occurrence number of the dinucleotide |${X}_{i-1}{X}_i$| in position i of the i-th prefix string. | [50] | |
| Nucleotide pair spectrum | This encoding depicts the sequence context of a modification site by calculating the frequencies of all possible d-spaced nucleotide pairs. | [36] | |
| STTNC | RNA sequence is portioned into three distinct parts where each part is treated as a separate sequence, and the frequency of four consecutive nucleotides is computed. | [48] | |
| ENAC | The frequency of the nucleic acids was calculated in the window continuously sliding from the 5′ to 3′ of each RNA fragment in the dataset. | [38] | |
| RNA word embedding | Take single or 3-nt long window along the sample sequences to generate RNA subsequences that can be analogized into gene words. | [37, 38] | |
| Entropy information | Shannon entropy (En), relative entropy (REn) and information gain score (IGS) of all samples as feature. | [53] | |
| Deep features | Deep learning based feature descriptor with deep belief network (DBN) to extract high-level latent features | [54] | |
| Nucleotide physicochemical properties | NCP | Three coordinates (x, y, z) were used to represent the chemical properties of the four nucleotides and were assigned 1 or 0 values. Where the x coordinate stands for the ring structure, y for the hydrogen bond, and z for the chemical functionality. | [29, 35, 39–41, 43, 47, 52, 53] |
| PseDNC | PseDNC is an approach incorporating the contiguous local sequence-order information and the global sequence-order information into the feature vector of the RNA sequence. | [42, 45, 46, 49] | |
| RNA property parameters | Three physicochemical properties, including enthalpy, entropy and free energy that can quantify the RNA secondary structures, are used to calculate the global or long-range sequence-order effects. | [42] | |
| RFHC-GACs | ring-function-hydrogen-chemical properties without GAC. | [51] | |
| Auto-covariance | The auto-covariance encoding measures the correlation of the same physicochemical index between two dinucleotide separated by a distance of lag along the sequence. | [44, 45, 51] | |
| Cross-covariance | The Cross-covariance encoding measures the correlation of two different physicochemical indices between two dinucleotides separated by lag nucleic acids along the sequence. | [44, 45, 51] | |
| Predicted RNA structural features | MFE score | Minimum free energy value predicted by RNAFold [66]. | [31] |
| RNA secondary structure | The RNA secondary structures around the modification site, the RNA secondary structures are predicted using RNAfold from the Vienna RNA package [67]. | [39] | |
| Position-specific scoring matrices | BPB/PSNP/NPPS | Two position-specific profiles, including positive position-specific profile and negative position-specific profile, can be generated through calculating the frequency of each nucleotide at each position in the positive data set and negative data set, respectively. | [26, 27, 32, 33] |
| PSDP | PSDP further extended the PSNP to dinucleotides (double nucleotide) to extract additional information contained in RNA segment. | [27, 32] | |
| RNA sequence similarity features | KNN score | The KNN encoding implies the clustering information (i.e. sequence similarity/distance) of RNA sequences with modification sites. | [33, 36] |
| Genomic features | Relative distribution | The absolute distance from the transcript start site was calculated and then scaled to obtain a relative position value (between 0 and 1). | [31, 53] |
| Motif features | Motifs are considered as sequence signal for several genomic elements, such as gene Transcription Starting Sites (TSS), Transcription Factor Binding Sites (TFBS) and in the upstream regions of miRNA. | [46] | |
| SNP feature | SNP information | [53] | |
| Neighbouring methylation state | The neighbouring methylation state feature counted the neighbouring positive/negative site numbers as a kind of feature. | [37] | |
| Genomics dummy variables | Dummy variables indicating whether the site is overlapped to the topological region on the major RNA transcript. The dummy variables include 5’ UTR, 3’ UTR, stop codons flanked by 100 bp, start codons flanked by 100 bp, downstream 100 bp of TSS, downstream 100 bp of TSS on A, exons containing stop codons, alternative exons, constitutive exons, internal exons, long exons (exon length > = 400 bp), 5′ 400 bp of the last exons, 5′ 400 bp of the last exons containing stop codons. | [39] | |
| Relative position on the region | Real valued features defining the relative position of the transcript regions (3’ UTR, 5’ UTR and whole transcript), that is, the distance from the adenine to the 5′ end divided by the width of the region. The values are also set to zero for sites that do not belong to the region. | [39] | |
| The region length | The region length represents the length of the transcript region containing the modification site. The values are also set to zero for sites that not belong to the region. | [39] | |
| Nucleotide distances towards the splicing junctions or the nearest neighbouring sites | Capture the distance from the adenine sites to the 5′ end or 3′ end of the splicing junctions. Additionally, the distance to the nearest neighbouring modification sites in the training data is generated to measure the clustering effect of the RNA-modification sites. | [39] | |
| Scores related to evolutionary conservation | Scores related to evolutionary conservation represent the evolutionary conservation score of the adenosine sites and its flanking regions. | [39] | |
| Attributes of the genes or transcripts | The properties of the genes or transcripts containing the modification sites, such as being the miRNA target genes or housekeeping genes. | [39] | |
| RNA annotations related to m6A biology | The annotation of miRNA target sites are from eCLIP data of HNRNPC RNA-binding sites [68], miRanda [69] and TargetScan [70]. | [39] |
Features calculated and extracted for model construction
To construct robust and accurate machine learning predictors for RNA-modification site prediction, diverse features have been designed and extracted for encoding the RNA sequences. In this section, we summarize six major types of features based on an investigation of current computational approaches for m1A and m6A site prediction (Table 2). These major feature types include (1) RNA primary sequence-derived features, (2) nucleotide physicochemical properties, (3) predicted RNA structural features, (4) position-weighted matrix, (5) RNA sequence similarity feature and (6) genomic-derived features. Based on our survey, we collected the representative features for each type, together with their biological interpretation and references. The sequence-derived features are the most commonly used features, which can be extracted/calculated based on the RNA sequence, while some features, such as the predicted RNA structural features, require use of third-party software to generate outputs prior to feature calculation and encoding. Notably, the majority of the existing RNA-modification site prediction methods used sequence-based features or in combination with the feature type 1 through type 5 listed in Table 2. In addition, use of such features alone may not be able to fully capture the attributes of RNA modifications. In view of this, the genomic features were also introduced by some methods and were observed to result in an improved performance [39]. However, a coin has two sides—although integrating the genomic features helped to improve the predictor performance significantly, doing so also considerably limited the wider applicability of the developed methods in the meanwhile. Thus, the sequence-derived features are more widely used than genomic-derived features in most studies. To better address this issue, Chen et al. further built and made available a useful online, publicly accessible database to host the predicted human m6A epitranscriptome, which enables interested users to perform a direct search and query of predicted RNA-methylation sites [39]. Currently, a number of useful packages/web servers have been developed and made available to calculate and extract a variety of sequence/structural and physicochemical features, including Pse-in-One [71], BioSeq-Analysis [72] and iLearn [73]. After feature encoding, the initial feature set often has a high dimensionality and may result in biased model training. Therefore, feature selection is required and performed as a next step, to reduce the dimensionality of the initial feature set, prior to construction of the computational models.
Feature selection strategy
As aforementioned, prior to model construction, feature selection is a nontrivial step that measures the importance of all the features and eliminates the less informative ones. Four of the 27 surveyed predictors in Table 1 adopted the feature selection procedure. The commonly used feature selection algorithms include IFS [32], RFE, PSDI, MRMD [26] and Perturb method [39].
Performance evaluation measures and strategies
Three validation methods, including K-fold cross-validation test, jackknife validation test and independent dataset test, are often used to derive comparative metrics (values) amongst the reviewed predictors. A detailed interpretation of the three evaluation strategies can be found in [74]. Generally, the jackknife is commonly used in the prediction task with a smaller dataset size, while K-fold cross-validation and independent tests are more popular in the prediction task with a larger dataset size (Table 1). Amongst the reviewed predictors, most undertook one or two cross-validation tests combined with the independent test as their evaluation strategy.
Software availability and usability
To facilitate community-wide research efforts for identifying RNA-modification sites, a user-friendly webserver and/or a local executable of the proposed predictor should be ideally available along with the publication. Based on our survey of the predictors for m1A and m6A site prediction (Table 1), 24 predictors (accounting for 89%) out of 27 were made available as webservers and/or stand-alone software for high-throughput prediction. However, four of these webservers have been offline to date. Some webservers have changed their IP addresses, and we accordingly updated the new addresses in Table 1. Generally, the user input, parameter configuration/explanation and prediction output are the main components of a webserver/stand-alone tool, which should be designed carefully.
Specific for the RNA-modification site prediction, the design of a user-friendly webpage should include considerations for the following important aspects: (1) user input format, (2) any parameter configurations and their explanations and (3) prediction output of the submitted data. Amongst the 18 predictors with available webservers, 16 servers permit multiple-sequence submission, 1 predictor only allows users to submit one RNA sequence at a time and 1 database only allows user to query the modification state of a gene with the specified gene name. Amongst these 17 servers, only 3 servers facilitate file uploading for the submitted sequence. ‘FASTA’ is the commonly used sequence format for online submission. A reasonable output design is crucial for the interpretability of prediction results. At least four important aspects regarding the output, specific to RNA-modification site prediction, should be taken into consideration: (1) RNA indicator (e.g. job ID, RNA name, etc.), (2) the positions of the predicted modification sites in the RNA sequence, (3) the sequence fragment containing the predicted modification sites and (4) the prediction score or confidence score. Amongst the predictors with available webservers, RAMPred [40], iRNA-3typeA [42], m6Apred [43], SRAMP [36], MethyRNA [35], iRNA(m6A)-PseDNC [49], BERMP [38], M6APred-EL [51], DeepM6APred [54] and Gene2Vec [37] provide detailed output information including the predicted modification site and the corresponding prediction score. SRAMP [36] and BERMP [38] allow users to download the prediction results in the ‘TEXT’ format for further follow-up analysis. Data visualization techniques can facilitate the systematic display of the prediction results. An interactive webpage can assist users to better understand the distribution of predicted RNA-modification sites across the whole RNA sequence. In this regard, SRAMP [36] provides such a graphical data display. Another important functionality aspect is the possibility to revisit historical prediction results (based on the job ID). However, amongst the reviewed predictors, no webservers have provided this functionality.
Stand-alone tools are available for RNA-MethylPred [33] and RFAthM6A [27]. Amongst these, RFAthM6A [27] provides step-by-step software installation instructions, with the guidance information about dependencies and runtime environment. It is thus a biologist user-friendly tool, especially considering that it is generally challenging for biologists to use these stand-alone tools on their local machines.
Development of the DeepPromise approach
Datasets
We extracted datasets of two major types of RNA-modification sites, including m1A and m6A, from several recently published single-nucleotide resolution mapping studies of RNA-modification sites [23, 56, 75–79]. For m1A, the modification sites were mapped to the transcripts recorded by the NCBI nucleotide database (https://www.ncbi.nlm.nih.gov/nuccore/) and the ENSEMBL database (http://www.ensembl.org). The CD-HIT-EST tool [80] was used to remove redundant sequences, which is consistent with previous studies [36]. After this procedure, the resulting dataset was separated into two groups: a benchmark dataset for performing cross-validation tests and another used as the independent test set. For each RNA-modification site, we extracted a (2n + 1)-nt local sequence window centred at the modified/non-modified site. It should be noted that the value of n is different for these two modifications. If the sequence length was shorter than 2n + 1, then the character ‘-’ would be assigned to fill in the corresponding positions in order to ensure that the sequence had the same window size. This is called padding. Because there exist many more and a whole lot of more interesting non-modification sites than modification sites, for m1A sites, that is, the dataset is unbalanced, we set the positive-to-negative ratio at 1:10 in the datasets by randomly selecting the negative samples, as previously suggested [38]. For the m6A sites, the dataset was derived from previous studies from Zou et al [37]. A statistical summary of the datasets curated for these three RNA modifications after reduction of sequence redundancy is provided in Table 3.
A statistical summary of the benchmarking and independent test datasets curated
| Dataset | Modification Type | Window size | Species | No. of positive samples | No. of negatives samples | Validation |
|---|---|---|---|---|---|---|
| m1A_BM | m1A | 101 | H. sapiens | 593 | 5930 | Fivefold cross-validation |
| m1A_IND | m1A | 101 | H. sapiens | 114 | 1140 | Independent test |
| m6A_BM | m6A | 1001 | H. sapiens and M. musculus | 44, 901 | 44, 901 | Fivefold cross-validation |
| m6A_IND | m6A | 1001 | H. sapiens and M. musculus | 11, 656 | 116, 906 | Independent test |
| m6A_IND1 | m6A | 1001 | H. sapiens and M. musculus | 5233 | 52, 272 | Independent test |
BM, benchmark; IND, independent.
Feature-encoding scheme
Three feature-encoding schemes, including the enhanced nucleic acid composition (ENAC) [81], one-hot and RNA-embedding schemes, were employed to encode the RNA sequences prior to the CNN model training. We previously applied ENAC encoding to successfully predict protein malonylation sites [82] and demonstrated its usefulness for improving model performance. In particular, ENAC calculates nucleic acid composition based on a fixed-length sequence window (i.e. a sliding window) that continuously slides from the 5′ to 3′ termini of each nucleotide sequence. This encoding scheme can simultaneously depict the nucleic acid composition and position information of a nucleotide sequence. In the present study, we optimized the sliding-window size using fivefold cross-validation experiments, resulting in a setting of two. Therefore, a nucleotide sequence of length 51 corresponded to a total of 50 (i.e. 51 − 2 + 1 = 50) sliding windows, with the vector dimension of the ENAC encoding generated by a 50 × 4 (nucleic acid) vector equal to 200. It is noteworthy that the ENAC encoding is diffident from di-nucleic acid composition. Compared with the ENAC encoding, the di-nucleic acid composition calculates the di-nucleic acid composition based on the whole sequence instead of the fixed-length sequence window. The dimension of the ENAC encoding depends on two parameters (i.e. the sequence length and the sliding-window size), and can be calculated as (sequence length—sliding-window size + 1) × 4, while the dimension of the di-nucleic acid encoding is fixed, with a fixed dimension of 16 (i.e. the number of all possible di-nucleic acid composition, which is 16) irrespective of the whole sequence length.
The one-hot and RNA-embedding encodings are two commonly used schemes for encoding RNA sequences. One-hot encoding describes the position-specific information in the flanking sequence window of RNA-modification sites. The four nucleotides along with the gap symbol ‘-’ are coded as five-dimensional binary vectors [e.g. A (1, 0, 0, 0, 0), C (0, 1, 0, 0, 0), G (0, 0, 1, 0, 0), U (0, 0, 0, 1, 0) and ‘-’ (0, 0, 0, 0, 1)].
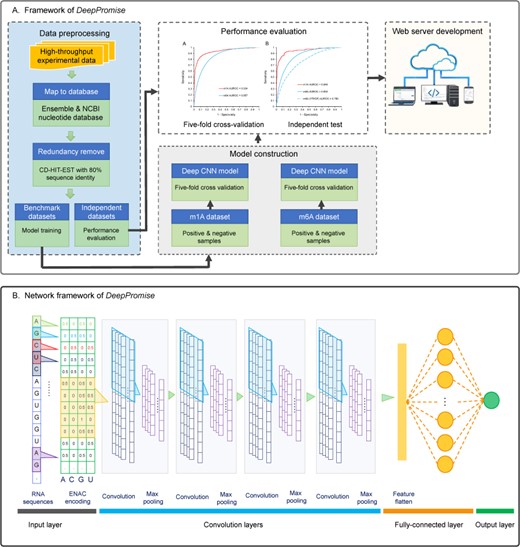
Overview of DeepPromise. Summaries of the (A) architecture and (B) structure of the CNNs used in this study.
For the RNA-embedding encoding scheme, each of the five characters (e.g. ‘A’, ‘C’, ‘G’, ‘U’ and ‘-’) was taken as a word, resulting in a vocabulary size of the word dictionary of five. Each of the five words was represented by a unique integral index, and an original sequence was transformed into an integral sequence using the corresponding integral index. (The integral sequence was then input into the embedding layer.) Then we put the embeddings integral sequence as inputs to PyTorch (https://pytorch.org/) in order to transform each integral sequence into an embedding matrix, WE ∈ ℝV × D, where D is the embedding dimensionality and V is the number of words in vocabulary, thereby generating the word embedding.
Architecture of the deep-neural networks
An overview of the architecture of the proposed deep learning framework of DeepPromise is provided in Figure 2. Three specific classifiers were built to predict each type of the modification sites based on the ENAC, one-hot and RNA-embedding encodings, respectively. All the classifiers used the same framework and contained seven layers, including an input layer, four convolution layers, a fully connected layer and an output layer. Taking the ENAC encoding as an example, the input layer, convolution layers, fully connected layer and output layer were organized as follows:
(i) Input layer: an RNA sequence with 2n + 1 nucleotides is transformed into a two-dimensional vector in the form of ENAC encoding. The feature vector matrix is m × k, where m is the sliding-window number in the RNA sequence and the value of k is set at four.
(ii) Convolution layers: each of the four convolution layers contains a convolution layer with the rectified linear unit (ReLU) [83] as its activation function and a max pooling layer. The number of convolution kernels was set at 64, and the convolution kernel size was set at five. For the max pooling layer, the size of the max pooling windows was two.
(iii) Fully connected layer: the hidden-state vectors obtained from the convolution layer were concatenated and received by the fully connected layer, which comprised 64 neurons and was activated by the ReLU [83] function.
- (iv) Output layer: there exists only one neuron with ‘Sigmoid’ as the activation function [84]. It can calculate the score (ranging from 0 to 1) as the probability score, which indicates the likelihood of this site to be modified. The Sigmoid function is expressed as:where the variable |$\boldsymbol{x}=\boldsymbol{w}\bullet \boldsymbol{x}$|.(2)$$\begin{equation} \mathrm{sigmoid}\left(\boldsymbol{x}\right)=\frac{1}{1+{e}^{-\boldsymbol{x}}}, \end{equation}$$
Integration of multiple CNN classifiers trained using different feature encodings
Results and discussion
In this work, we first summarized 27 state-of-the-art approaches for predicting m1A and m6A sites and covered a variety of important aspects including the dataset preparation, feature calculation/extraction, ML algorithm selection, model training and testing and webserver development. Based on the summary, we provided our thoughts on potential strategies that may be exploited to improve the model performance in future studies. In addition, we also developed a computational approach based on the deep learning technique for simultaneous prediction of m1A and m6A sites.
Summary of the developed computational approaches
To develop a computational method for RNA-modification site prediction, the first important step is to construct a reliable benchmark dataset. As highly abundant gold-standard datasets are available for m6A sites, 26 predictors were developed for the m6A site prediction. The developed predictors could be divided into two major categories according to the mapping resolution (i.e. single-nucleotide resolution and non-single-nucleotide) of the dataset used. Only five predictors were developed based on the high-quality dataset. The high-quality dataset should be employed to ensure the reliability and robustness of the developed predictors. The high-quality datasets used in these predictors cover five different species, including Saccharomyces cerevisiae, Homo sapiens, Mus musculus, Arabidopsis thaliana and Escherichia coli. However, there were no high-quality datasets currently available for S. cerevisiae, A. thaliana and E. coli.
Feature extraction/calculation is particularly relevant for predictor construction. Transforming the sequence data into an effective mathematical expression that can truly reflect the intrinsic relationship between the attributes and the to-be-predicted class label can significantly affect the performance of the resulting model [73]. In this work, in order to construct robust and accurate machine learning predictors for RNA-modification sites prediction, six different feature types were used to train the model by the reviewed approaches. The sequence-derived features are more popular than the other feature types. In addition, the feature selection algorithms were also commonly adopted by four methods to improve the prediction performance.
ML algorithm selection is another key step for constructing the predictor. Use of a powerful algorithm will significantly improve the prediction performance. As discussed in the section ‘Machine learning algorithms employed’, four different machine learning algorithms (i.e. SVM, RF, XGBoost and Deep learning algorithms) were employed by the existing approaches for m1A and m6A sites prediction. Amongst these, SVM is the most commonly used machine learning algorithm.
Model performance validation is an important step prior to the application of the predictor [86]. Three validation methods, including K-fold cross-validation test, jackknife validation test and independent data set test, were used to quantify seven performance metrics (i.e. Sn, Sp, MCC, Acc, AUROC, AUROC01 and AUPRC) by the reviewed predictors.
Finally, another important consideration for developing computational approaches is that they should be conveniently used by biologists to facilitate target selection, experimental design and hypothesis generation and validation. Based on our survey, 89% of the approaches provided webservers or stand-alone software as an implementation of the developed algorithms, which vary in several aspects including the input format, parameter configurations and explanations, prediction output and result visualization.
Development of DeepPromise
Parameter optimization
An optimal sequence-window size can significantly improve the predictive capability of the classifier. Here, we used ENAC encoding to optimize the sequence-window size for predicting two types of RNA-modification sites. To identify the optimal sequence-window size for model construction for m1A sites, we established nine different sequence-window sizes (i.e. 21, 31, 41, 51, 61, 71, 81, 91 and 101, respectively) and evaluated their respective impacts on the predictive performance using the independent dataset. Supplementary Figure S1A shows that the model trained with the window size of 101 achieved the highest AUROC value for m1A-site prediction. In the case of m6A-site prediction, we evaluated 5 sequence window sizes, including 251, 451, 651, 851 and 1001. As a result, the model trained using a sequence-window size of 1001 performed best. Therefore, these results indicated that the optimal window sizes were 101 and 1001 for m1A and m6A sites, respectively.
On the other hand, the sliding-window size is also considered an important parameter for the ENAC encoding scheme. To examine its impact on predictive performance, we evaluated and compared five different sliding-window sizes (i.e. 2, 3, 5, 7 and 9) for each type of modification site. As a result, we found that models based on a sliding-window size of two performed best across both the two types of sites (Supplementary Figures S2A and B). Additionally, the main hyperparameters of the deep learning framework, such as the convolution number of filters, the size of the convolution kernel and the size of the pooling kernel, were empirically set first, followed by fine-tuning of each parameter by fixing the remaining parameters. The same parameters were ultimately adopted by all models, with detailed hyperparameters described in Supplementary File 1.
Establishment of the predictors
As noted in the Materials and Methods section, all datasets in this study comprise of experimentally identified RNA-modification sites at single-nucleotide resolution. We used three encoding schemes to encode and represent the RNA sequence. The positional one-hot encoding of the nucleotide sequence depicts the nucleotide at each position surrounding the modification sites and has been widely used to construct predictors for various protein- and RNA-modification sites [36, 37, 87–89]. One-hot encoding was employed to depict the nucleotide sequence and used as the input to the first layer (i.e. input layer) of the proposed CNN. The CNN using the one-hot encoding (CNNone-hot) classifier achieved encouraging performance according to fivefold cross-validation testing (Table 4). In particular, CNNone-hot achieved AUROC values of 0.930 and 0.852 for m1A and m6A sites, respectively. One-hot encoding performed better on the m1A dataset than that of m6A sites. When evaluated at a lower false-positive rate (i.e. Sp ≥ 90%), the performance of one-hot encoding was competitive and achieved an AUROC01 of 0.070 for m1A sites (Table 4), indicating that the CNNone-hot classifier could effectively capture the sequence pattern underlying these types of RNA-modification sites. Here, the output of the initial convolution layer was used to analyse the sequence patterns around the two types of modification sites.
Performance of different models trained using different encoding schemes on the fivefold cross-validation test. Values in bold indicate the best performance
| RNA modification type | Classifiers | Sensitivity (%) | Specificity (%) | MCC | AUROC | AUROC01 |
|---|---|---|---|---|---|---|
| m1A | CNNENAC | 82.97 | 90.00 | 0.563 | 0.928 | 0.0683 |
| CNNOne-hot | 81.45 | 90.00 | 0.553 | 0.930 | 0.0700 | |
| CNNRNA embedding | 75.89 | 90.00 | 0.517 | 0.912 | 0.0636 | |
| DeepPromise | 84.15 | 90.00 | 0.571 | 0.934 | 0.0710 | |
| RFENAC | 79.76 | 90.00 | 0.549 | 0.923 | 0.0672 | |
| RFOne-hot | 77.23 | 90.00 | 0.531 | 0.922 | 0.0650 | |
| RFRNA embedding | 74.53 | 90.00 | 0.586 | 0.910 | 0.0628 | |
| SVMENAC | 74.87 | 90.00 | 0.510 | 0.895 | 0.0582 | |
| SVMOne-hot | 64.56 | 90.00 | 0.240 | 0.838 | 0.0438 | |
| SVMRNA embedding | 70.66 | 90.00 | 0.482 | 0.889 | 0.0556 | |
| m6A | CNNENAC | 53.32 | 90.00 | 0.466 | 0.850 | 0.0338 |
| CNNOne-hot | 53.93 | 90.00 | 0.471 | 0.852 | 0.0342 | |
| CNNRNA embedding | 52.45 | 90.00 | 0.458 | 0.845 | 0.0328 | |
| DeepPromise | 54.87 | 90.00 | 0.479 | 0.857 | 0.0351 | |
| RFENAC | 30.47 | 90.00 | 0.260 | 0.714 | 0.0207 | |
| RFOne-hot | 22.88 | 90.00 | 0.179 | 0.650 | 0.0174 | |
| RFRNA embedding | 26.41 | 90.00 | 0.225 | 0.696 | 0.0167 | |
| SVMENAC | 28.39 | 90.00 | 0.233 | 0.697 | 0.0164 | |
| SVMOne-hot | 37.25 | 90.00 | 0.321 | 0.754 | 0.0223 | |
| SVMRNA embedding | 36.61 | 90.00 | 0.315 | 0.751 | 0.0218 |
The convolution operation is the engine of the CNN and essentially determines the performance of the classifier. In the convolution layer, the convolution kernel scans a set of weight matrices across the inputs, with the kernels learning to recognize relevant patterns during this process. A growing number of studies have used convolution kernels in the first layer to extract informative motifs from massive sequence datasets [90, 91]. Therefore, to analyse the useful motifs learned by the network, we extracted the output of the first convolution layer with a row for each convolution kernel and a column for each position in the input. In the first layer of DeepPromise, we used 64 convolution kernels and a kernel size of 5 to search for motifs within the sequence. For the output of a kernel, we first applied a rectifier operation (i.e. by setting all the negative values to zero) to the output matrix. In particular, for each of the positions, we counted the number of sequences that activated the kernel to a value that was >50% its maximum value, and the position with the maximum sequence number was finally selected [90]. The corresponding sequences were then truncated to 5-mers with the selected position at the centre, followed by aligning of the sequences according to sequence-logo representations rendered using the WebLogo program [92, 93]. As a result, a total of 64 informative motifs were characterized for each type of RNA-modification site. All of the motifs demonstrating the effectiveness of the CNN models are graphically illustrated in Supplementary Files 2 and 3, as reflected by the bit scores in the Y-axes of the sequence-logo graphs. Some of the learned motifs were in good agreement with known motifs of RNA-modification sites (Figure 3A and B). For example, for the m6A sites, the majority of the learned motifs were consistent with the well-known ‘DRACH’ motif (where D = ‘A’, ‘G’ or ‘U’; R = ‘A’ or ‘G’; and H = ‘A’, ‘C’ or ‘U’) [20–23, 94] (Figure 3A). However, most of the learned motifs were novel motifs, which need to be verified against the known motifs for m1A sites. This might be due to the small size of the identified m1A sites. The discovered novel motifs will be useful for future experimental analyses. Additionally, for the m1A sites, the learned motifs were consistent with the known motif ‘GUUCNANNC’ (where ‘N’ denotes any of the four types of bases) [56] (Figure 3B), where ‘G’ frequently appeared at the −5 position, ‘U’ was enriched at positions −4 and −3 and ‘C’ tended to appear at the −2 and +3 positions (Figure 3B).
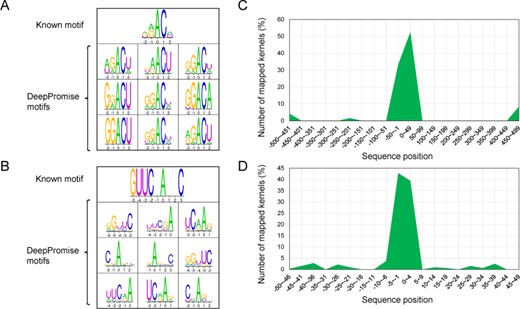
Comparative analysis of DeepPromise motifs, those previously identified, and the distributions of their kernel-mapped positions. Comparison of the motifs learned by DeepPromise with (A) the known ‘DRACH’ motif in m6A sites, (B) the known ‘GUUCNANNC’ motif in m1A sites. (C) Distributions of the kernel-mapped positions in m6A sites with sequence length of 1001, (D) in m1A sites with sequence length of 101.
In addition to characterization of sequence motifs, we analysed the importance of sequence position around modification sites by counting the number of kernels mapped to a sequence position. There were 64 kernels in DeepPromise, and for each of the kernels, a motif with the highest number of sequences was extracted first and then mapped to a range of 5-nt sequences. This allowed counting of the number of mapped kernels for each position of the sequence, with a larger number for a position indicating its greater importance. Figure 3C and D shows the distributions of the mapped kernels for the sequence positions. For the m6A sites, >85% of the kernels were mapped to positions between ~−100 and ~+100, whereas the remaining 15% of kernels were mapped to positions between ~−500 and ~−400, ~−250 and ~150, and ~450 and ~500 (Figure 3C). Majority of the kernel-mapped positions were distributed around positions ~−10 and ~10 for the m1A sites (Figure 3D). These data indicated that nucleotides at proximal positions of the modification sites contributed most to the classification performance of the CNN models, whereas those at distal positions had less of an effect on classification performance.
In addition to one-hot encoding, we used RNA-embedding encoding to depict the sequence pattern surrounding the modification sites. The four nucleotides (i.e. ‘A’, ‘C’, ‘G’ and ‘U’) and the gap symbol ‘-’ were converted into a three-dimensional word vector to represent nucleotide properties. This one-hot encoding technique was previously used to train models to predict protein malonylation sites [82]. In the present study, we used RNA-embedding encoding (CNNembedding) to construct the CNN classifier, which ultimately achieved competitive performance with that of one-hot encoding according to fivefold cross-validation tests using the benchmark dataset (Table 4). In particular, the CNNembedding classifier achieved AUROC values of 0.912 and 0.845 for m1A and m6A sites, respectively. Additionally, performance involving low false-positive rates (i.e. Sp ≥ 90%) by the classifier using RNA-embedding encoding was acceptable, with an AUROC01 of 0.0636 for m1A sites and indicating that the CNNembedding classifier efficiently captured useful sequence patterns for these types of RNA-modification sites.
It is difficult for both one-hot encoding and RNA-embedding encoding to represent and capture nucleotide composition around RNA-modification sites. Therefore, to address this, we introduced the ENAC encoding, which has been successfully applied to predict protein malonylation sites [82]. The results showed that the CNN classifier using ENAC encoding (denoted as CNNENAC) exhibited comparative performance with that of the other classifiers (i.e. CNNone-hot and CNNembedding) according to fivefold cross-validation tests. For m1A and m6A sites, CNNENAC achieved AUROC values of 0.928 (AUROC01 = 0.0683) and 0.850 (AUROC01 = 0.0338), respectively. To characterize the most informative and contributive features to classifier performance, we ranked the different sequence features using the information gain method and accordingly selected the top 30 features for each type of modification site. Remarkably, for m6A sites, 25 features amongst the top 30 selected were located at sequence positions within a range of −5 to +5 (Figure 4). Additionally, ‘C’ was included in 11 of 30 features, followed by ‘A’ in 7 of 30 features and ‘G’ and ‘U’ in 6 of 30 features. Comparison of these informative features with the sequence patterns surrounding m6A sites revealed that the data were consistent. For example, ‘G’ was significantly enriched at sequence positions −2, −1 and +3 (Figure 4A). Furthermore, these positions included the selected features ‘Top2: G@[−2, −1]’, ‘Top7: G@[−3, −2]’ and “Top17: G@[2, 3]” (Figure 4B). Moreover, ‘C’ was depleted at sequence positions −4, −3, +2, +3 and +4 (Figure 4A) and was consistently included in the features “Top4: C@[1, 2]”, “Top5: C@[2, 3]”, “Top13: C@[3, 4]”, “Top20: C@[4, 5]”, ‘Top21: C@[−4, −3]’ and ‘Top25: C@[−3, −2]’ (Figure 4B). Similarly, for m1A sites, the selected features also depicted the sequence patterns well (Supplementary Figure S3). These findings suggested that the performance of the CNNENAC classifier likely depended primarily upon the ability of the ENAC encoding to effectively characterize and capture the flanking nucleotides around two types of modification sites. The selected top 30 features of the ENAC encoding for the two modifications are provided in Supplementary Tables S3 and S4.
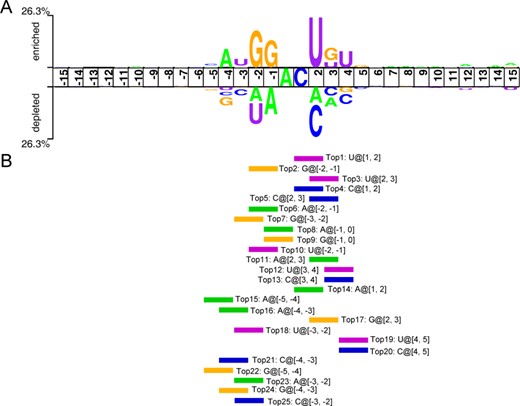
Two-Sample-Logo representations and informative features identified by ENAC encoding. (A) Sequence patterns surrounding m6A sites, including significantly enriched and depleted nucleotides for the m6A and non-m6A sites (P < 0.05, t test). The patterns were visualized using the Two-Sample-Logo method, and (B) informative features captured by ENAC encoding were ranked using the information gain method, with the top-ranked characteristic features listed.
Establishment of the optimized model of DeepPromise by integrating the output of three types of predictors
All three classifiers (CNNone-hot, CNNembedding and CNNENAC) were constructed based on CNNs having the same architecture. Generally, both one-hot encoding and RNA-embedding encoding accurately described position-specific information surrounding the modification sites, whereas ENAC encoding specialized in simultaneously depicting the nucleic acid composition and position information of a nucleotide sequence. To examine potential complementary effects by combining these classifiers and whether the final optimized model of DeepPromise exhibited improved performance, we integrated the classifiers and performed both cross-validation and independent tests. The final model of DeepPromise was constructed by integrating the three classifiers using a weight-summing formula (See the Material and Methods). After integration, DeepPromise achieved an AUROC value of 0.857 (MCC = 0.479) (Table 4 and Figure 5, blue-coloured ROC curve) for m6A sites and 0.934 (MCC = 0.571) for m1A sites. Examination of performance according to low false-positive rates (i.e. Sp = 90%) indicated outstanding performance by the integrated DeepPromise model according to both cross-validation and independent tests. The results in Table 4 illustrate that the performance was improved by combining the three classifiers trained using different encoding schemes.
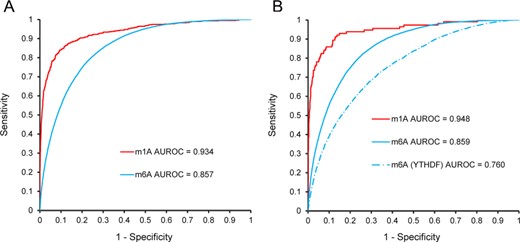
ROC curves for the different DeepPromise variants. (A) Fivefold cross-validation and (B) independent tests.
Comparison with traditional classifiers
To benchmark the performance of CNN classifiers, we also built the RF and SVM classifiers based on the traditional machine algorithms. Each of the three encodings (i.e. one-hot, RNA embedding and ENAC) was used as the input to train the individual classifiers. For an implementation of SVM, we used the LIBSVM package [95] and applied the RBF kernel function to train the SVM classifier, while for the implementation of RF, we used the Weka software package (Version 3.8.1). The performance comparison results show that the CNN-based classifiers clearly outperformed the RF- and SVM-based classifiers (Table 4). Due to the presence of the most highly abundant datasets for m6A sites (Table 3), the CNN-based classifiers achieved a much better improved performance for m6A site prediction, and a relatively minor improved performance for m1A site prediction compared with the traditional SVM and RF classifiers. These results suggest that the deep learning algorithm has achieved a superior performance of RNA-modification site prediction when trained on a larger dataset.
Comparison with existing methods
We then evaluated the performance of DeepPromise relative to existing methods using the independent dataset. RAMPred [40] and iRNA-3typeA [41] are two m1A-site predictors developed based on an SVM algorithm and an encoding scheme involving nucleotide-chemical properties. There are ~6000 human m1A sites in the RAMPred and iRNA-3typeA dataset. As noted in the Introduction, majority of the modification sites were experimentally determined using the MeRIP-seq technique [20], which cannot precisely identify m1A sites at single-nucleotide-resolution. We submitted the independent dataset to their webserver, with results indicating that DeepPromise performed better than the RAMPred and iRNA-3typeA algorithm (Table 5). DeepPromise achieved an AUROC value of 0.948 and an MCC value of 0.594 relative to 0.514 and 0.025 for RAMPred and 0.508 and 0.028 for iRNA-3typeA, respectively. The result indicated that the predictor should be developed based on high-quality dataset.
Performance of DeepPromise and other tools on the independent test
| RNA modifications | Tools | Sensitivity (%) | Specificity (%) | MCC | AUC | AUC01 |
|---|---|---|---|---|---|---|
| m1A | DeepPromise | 87.72 | 90.00 | 0.594 | 0.948 | 0.076 |
| RAMPred | 92.10 | 1.05 | 0.025 | 0.514 | 0.050 | |
| iRNA-3typeA | 98.97 | 2.64 | 0.028 | 0.508 | 0.050 | |
| m6A | DeepPromise | 55.58 | 90.00 | 0.376 | 0.859 | 0.036 |
| SRAMP | 44.00 | 90.00 | 0.290 | 0.794 | — | |
| Gene2Vec | 63.00 | 90.00 | 0.500 | 0.841 | — | |
| BERMP | 49.42 | 90.00 | 0.331 | 0.829 | 0.032 | |
| m6A (YTHDF) | DeepPromise | 39.10 | 90.00 | 0.252 | 0.760 | 0.024 |
| SRAMP | — | — | — | 0.720 | — | |
| Gene2Vec | — | — | — | 0.737 | — | |
| BERMP | 37.89 | 90.00 | 0.242 | 0.715 | 0.024 |
For m6A-site prediction, we compared the performance of DeepPromise with three recently developed sequence-based methods [SRAMP [36], BERMP [38] and Gen2Vec [37]] using the same datasets. On the first independent dataset, DeepPromise achieved the highest AUROC value of 0.859 as compared with 0.841 for Gene2Vec, 0.794 for SRAMP and 0.829 for BERMP, respectively (Table 5). Although DeepPromise performed best in terms of AUROC, Gene2Vec identified the most m6A sites according to low false-positive rate (i.e. SP ≥ 90%), indicating the robustness of Gene2Vec for predicting m6A sites. The second independent dataset contained YTHDF-binding proteins, which target m6A sites. RNA sequences harbouring m6A sites are bound YTHDF, allowing selection of YTHDF-binding RNAs [37]. The AUROC value for DeepPromise was 0.760 as compared with 0.720, 0.737 and 0.715 for SRAMP, Gene2Vec and BERMP, respectively. Both SRAMP and Gen2Vec are designed to identify mammalian m6A sites and outperformed other predictors. These results suggested DeepPromise as a better predictor of RNA-modification sites relative to current methods. In addition, WHISTLE [39] is also a robust predictor, which integrated additional genomic features besides the conventional sequence features. The reported performance of WHISTLE [39] (AUROC = 0.880 for mRNA models) is better than DeepPromise (AUROC = 0.859). However, the precondition for using of WHISTLE is the known genome information, which limits its applicability.
Online web server implementation
An online web server allowing use of DeepPromise was implemented and is publicly accessible at http://DeepPromise.erc.monash.edu/. The web server is maintained by the cloud computing facility supported by the eResearch Centre at Monash University and is equipped with 16 cores, 64 GB memory and a 2 TB hard disk. The configuration of this server can be readily upgraded to respond to possible future increases in demand. The DeepPromise web server was developed on the open-source web platform LAMP (Linux-Apache-MySQL-PHP) and has been tested using several commonly used web browsers, including Internet Explorer (≥v.7.0), Microsoft Edge (Microsoft Corp.), Mozilla Firefox, Google Chrome and Safari.
At the index webpage, users can input one or more nucleotide sequences (a maximum number of 100 sequences is allowed for each submission) in the FASTA format in the textbox or upload a single file containing multiple sequences in the FASTA format via the file-selection dialogue box. To control false-positive predictions, four different cut-off values are listed (i.e. ‘VERY HIGH’ = 98% Sp, ‘HIGH’ = 95% Sp and ‘MEDIUM’ = 90% Sp). Users are advised to pay attention to the predicted RNA-modification sites with ≥95% Sp, as these sites are likely accurately predicted. All generated prediction results are saved in a tabular format containing detailed information regarding the positions of predicted modification sites, scores and the applied prediction cut-off values. All results can be downloaded in plain text format for follow-up analysis. Additionally, DeepPromise offers two alternative graphical methods (Supplementary Figure S4) for visualizing the prediction results and statistical summary of the submitted query sequences. For a single prediction task of a typical RNA sequence with around 1500-nt long, it generally takes about 30 s for DeepPromise to complete the prediction and return the result.
Current limitations and future improvements
To date, a variety of predictors have been developed to predict the RNA-modification sites, which differ in a variety of aspects. Due to the limited availability of high-quality datasets at the early stage, most of the developed predictors used the non-single-nucleotide resolution datasets to train their models, which resulted in unsatisfactory prediction performance when tested on the single-nucleotide resolution datasets. For example, RAMPred [40] and iRNA-3typeA [41] are two m1A-site predictors developed based on the non-single-nucleotide dataset. The worse performance on the independent single-nucleotide resolution dataset indicates that it is necessary to develop robust predictors based on the single-nucleotide resolution dataset. Although some predictors like SRAMP [36], Gene2Vec [37] and WHISTLE [39] were developed based on the singe-nucleotide resolution dataset, these predictors were limited to m6A sites for H. sapiens and M. musculus. For S. cerevisiae and A. thaliana, there are no experimentally validated datasets with the single-nucleotide resolution available to build the predictor. Most of the predictors reviewed in this study were designed to predict m6A sites, while only two approaches exist that focus on predicting m1A sites. Their performance on the m1A dataset with single-nucleotide resolution was not satisfying. Therefore, there is an urgent need to develop improved m1A-site predictors based on the single-nucleotide resolution dataset.
Apart from the dataset quality, the dataset size is also another important aspect that needs to be considered when training a robust predictor. Some early stage predictors could only use small data sets to train their models, which would result in unsatisfactory prediction performance when tested on the large-scale dataset. For example, M6ATH [29] was built based on the A. thaliana dataset, which contained only 394 m6A sites. The dataset size was too small to cover the informative sequence patterns around the m6A sites. Therefore, to keep the published predictor up-to-date, it is suggested that models should be retrained once the up-to-date data sets become available.
Almost all computational methods for RNA-modification site prediction were developed based on machine learning algorithms (Table 1 and Figure 1). To further improve the prediction performance of such methods, we would like to make two suggestions. First, sequence similarity-based methods, which have been successfully developed for the prediction of protein post-translational modifications sites, could, in principle, be also used for the prediction of RNA-modification sites. For example, the group-based phosphorylation site predicting and scoring (GPS) algorithm [96] is a popular tool for protein phosphorylation sites prediction. It can be extended to address the RNA-modification site prediction problem. Second, ensemble learning methods might be useful for improving the prediction performance. For example, ZincExplorer is a zinc-binding site predictor, which integrates the outputs from three individual predictors (i.e. an SVM predictor, a cluster-based predictor and a template-based predictor) [97]. Amongst them, the cluster-based predictor is a sequence similarity-based method. Although its discriminative ability is not as good as the machine learning-based predictor, integration of the two predictors was found to further improve the performance significantly. These results indicate that the prediction performance may be significantly improved by the ensemble learning strategy via the integration of the outputs of multiple predictors.
Most of the predictors currently available focus on identifying a single type of RNA modification; in this work, we developed DeepPromise for the simultaneous prediction of two major types of RNA-modification sites. We have also developed a publicly available, user-friendly web server as an implementation of the proposed methodology. To ensure the wider applicability of the proposed predictor, only the sequence-derived features are considered and no external genome feature is required. It has been demonstrated that the m6A sites are enriched in some specific positions such as stop codon, longest exons and the regions targeted by microRNAs and RNA-binding proteins [14, 16, 17, 21]. Thus, the genome feature-based predictors like WHISTLE [39] performed better than sequence-based predictors. Balancing the performance by incorporating the genome features and the wider applicability will be the next step to develop the RNA-modification predictors.
DeepPromise was developed to predict two major types of RNA-modification sites simultaneously; however, more than 160 RNA modifications have been identified. Due to the lack of sufficient amounts of experimentally verified modification sites at single-nucleotide resolution, we were unable to incorporate additional modification types into this version of DeepPromise. With the rapid advances in functional genomics and molecular biology, we anticipate that more experimental data will be accumulated regarding RNA-modification sites, and our future work will involve inclusion of those data into the updated version of DeepPromise.
Conclusions
In this study, we first provided a comprehensive survey regarding the state-of-art computational methods for predicting RNA-modification sites. We discuss a wide range of aspects including the dataset quality, core algorithms selected for individual methods, feature selection techniques employed, performance evaluation strategy and user experience. Based on our survey and findings, we described the development of a novel bioinformatics approach called DeepPromise for simultaneous prediction of two major types of RNA post-transcriptional modification sites, that is, m6A and m1A sites. Benchmarking tests indicated that the ENAC encoding scheme was more capable of identifying useful sequence patterns surrounding RNA-modification sites, with the CNN model trained using ENAC encoding outperforming the other two encoding methods and particularly suitable for accurately predicting the two major types of RNA-modification sites. Furthermore, we optimized two important parameters for model performance (i.e. sequence-window size and the sliding window) for each of the two types of RNA-modification sites. Although most existing predictors focus only on identifying a single type of RNA modification, DeepPromise was capable of detecting two types of RNA-modification sites simultaneously with better performance. To facilitate use by the wider biomedical research community, an online web server for DeepPromise was implemented and is freely accessible at http://DeepPromise.erc.monash.edu/.
RNA modifications play important roles in a myriad of diverse biological processes. This study serves as a comprehensive survey of current methods for m1A and m6A sites prediction, particularly in terms of model construction and evaluation.
We propose a new deep learning model, termed DeepPromise, to improve the prediction of two major types of RNA modifications. Experimental results demonstrate the superior performance of DeepPromise compared with existing sequence-based methods.
We demonstrate the predictive power of deep learning-based models in RNA-modification prediction, for which high-quality dataset is necessary for developing a robust deep learning-based model.
A web server (http://DeepPromise.erc.monash.edu/) has been made available to facilitate online high-throughput prediction of m1A and m6A sites.
Acknowledgements
This work was supported by grants from the National Health and Medical Research Council of Australia (NHMRC) (1144652 and 1127948), the Young Scientists Fund of the National Natural Science Foundation of China (31701142), the Australian Research Council (ARC) (LP110200333 and DP120104460), a Major Inter-Disciplinary Research (IDR) project awarded by Monash University and the Collaborative Research Program of Institute for Chemical Research, Kyoto University (2019-32 and 2018-28).
Zhen Chen is an assistant professor at the School of Basic Medical Science, Qingdao University, China. His research interests include protein bioinformatics, machine learning and analysis of next-generation sequencing.
Pei Zhao is an assistant professor at the State Key Laboratory of Cotton Biology, Institute of Cotton Research of Chinese Academy of Agricultural Sciences, Anyang 455000, Henan, China. Her research interests are bioinformatics and analysis of next-generation sequencing in plants.
Fuyi Li received his BEng and MEng degrees from Northwest A&F University, China. He is currently a PhD candidate in the Department of Biochemistry and Molecular Biology and Biomedicine Discovery Institute, Monash University, Australia. His research interests are bioinformatics, computational biology, machine learning and data mining.
Yanan Wang received his MEng degree from Shanghai Jiao Tong University, China. He is currently a PhD student in the Department of Biochemistry and Molecular Biology and Biomedicine Discovery Institute, Monash University, Australia. His research interests are bioinformatics, computational oncology, machine learning and pattern recognition.
A. Ian Smith completed his PhD at Prince Henrys Institute Melbourne and Monash University, Australia. He is currently the Vice-Provost (Research & Research Infrastructure) at Monash University. He is also a Professorial Fellow in the Department of Biochemistry and Molecular Biology at Monash University, where he runs his research group. His research applies proteomic technologies to study the proteases involved in the generation and metabolism of peptide regulators involved in both brain and cardiovascular function.
Geoffrey I. Webb received his PhD degree in 1987 from La Trobe University. He is the director of the Monash Centre for Data Science and Professor in Faculty of Information Technology at Monash University, Australia. He is a leading data scientist and have been the Program Committee Chair of two leading Data Mining conferences, ACM SIGKDD and IEEE ICDM. His research interests include machine learning, data mining, computational biology and user modelling.
Tatsuya Akutsu received his DEng degree in Information Engineering in 1989 from University of Tokyo, Japan. Since 2001, he has been a professor in the Bioinformatics Center, Institute for Chemical Research, Kyoto University, Japan. His research interests include bioinformatics and discrete algorithms.
Abdelkader Baggag completed his PhD in Computer Science from the University of Minnesota. He is a Senior Scientist at the Qatar Computing Research Institute (QCRI) and has a joint appointment as an Associate Professor at Hamad Bin Khalifa University (HBKU) in the Division of Information and Computing Technology. His research interests include data mining, linear algebra and machine learning.
Halima Bensmail received her PhD from the University of Pierre & Marie Currie (Paris 6) in France. She is currently a Principal Scientist at QCRI-HBKU and a joint Associate Professor at the College of Computer and Science Engineering, HBKU. Her research interests include statistical machine learning and bioinformatics.
Jiangning Song is an Associate Professor and group leader in the Monash Biomedicine Discovery Institute, Monash University, Melbourne, Australia. He is also affiliated with the Monash Centre for Data Science, Faculty of Information Technology, Monash University. His research interests include bioinformatics, computational biology, machine learning, data mining and pattern recognition.
References
Author notes
Zhen Chen and Pei Zhao are contributed equally to this work.
