


ABSTRACT
This note complements and clarifies part of the work of Hawinkel et al. recently published in the journal and suggests some more or less standard tools and methods for carrying out association studies of the microbiome.
Introduction
Hawinkel et al. [1] have recently exhibited the weaknesses of several ‘popular’ methods for detecting differences in microbial abundance in studies of the microbiome; in particular, they showed that those methods can lead to alarming false discovery rates (FDRs). It has been pointed out [e.g. 2, 3] that if the many p-values involved in an application of the Benjamini–Hochberg (BH) method are biassed―as it will be the case, to a greater or smaller extent, if they come from incorrectly specified models or if they are based on theoretically or computationally inaccurate approximations―then their histogram may be overly peaked at the lower range of its domain (though the opposite may also happen), in which case the method will underestimate the FDR to a greater or smaller extent. So it is not surprising that methods which do not guarantee unbiassed p-values―as is the case with the methods considered by Hawinkel et al. with the exception of the permutation versions of the t- and Wilcoxon tests―lead to underestimation (or overestimation) of the true FDR. The effort of Hawinkel et al. is laudable because it seems that many studies of microbiome data are still based on unsuitable statistical methods and pedagogical attempts to repair the situation are therefore welcome, but its focus on the bad results may have left some readers with the impression that―be it because of the ‘mixed character’ of microbiome data (namely their being composed of a number of zeros and a number of positive values that indicate relative bacterial abundance) or because of the dependence between normalized abundances of different bacterial taxa―there exist few or no standard statistical tools offering protection against false findings in studies of the microbiome. The purpose of this note is to clarify a few points related to the work of Hawinkel et al. and to suggest and illustrate some more or less standard tools and methods for carrying out association studies of the microbiome along the lines proposed in [3].
Some tools and methods of analysis
It is important to note in the first place that there are ways―perhaps not full proof but effective in detecting serious abnormalities―of checking the correctness of the p-values obtained from many tests of ‘differential abundance’. An obvious one is to examine histograms of p-values that result from the same tests applied to the same data but for the values of the ‘response variable’ (e.g. group labels in a comparison between groups), which are randomly permuted, as described by Hawinkel et al. [1] in their section on ‘real data shuffling’. In an illustration of this method given in [3, p. 30–31], p-values of a perfectly suitable test statistic computed with its asymptotic distribution are shown to yield histograms deviating from the uniform density, while the exact p-values of the corresponding permutation test computed approximately by simulation conform to the assumption of uniformity.
Secondly, there exist several flexible nonparametric tests for testing differential abundance―and, more generally, for testing associations between bacterial abundance and an ordinal variable―that cope perfectly well with the mixed character of microbiome data in that they yield reliable p-values compatible with a uniform distribution, or at least with a nondecreasing density, and which therefore allow the control of the FDR. Among these we single out the tests based on ‘sum statistics’ [e.g. 4, 5] and those based on ranks, such as the Anderson–Darling test [6] and the classical, well-known Spearman, Wilcoxon, Kruskal–Wallis and Friedman tests, all of which have implementations [e.g. 5, 7] that compute approximate (and occasionally exact) p-values based on their permutation distributions.
Sum statistics have the form |$S={\sum}_{b=1}^B{\sum}_{i=1}^{n_b}{T}_{i,b}{R}_{i,b}$|, where |${T}_{i,b}$| may stand for a numerically coded ‘treatment’ of individual |$i$| in ‘block’ |$b$| [e.g. a stratum determined by sex, age, body mass index (BMI) and other factors thought to influence the microbiome] and |${R}_{i,b}$| for a corresponding numerical ‘response’, such as abundance of a bacterial taxon, |${n}_b$| stands for the number of individuals in block |$b$|, |$B$| for the number of blocks (|$B=1$| means no blocking), the sets of |$({T}_{i,b},{R}_{i,b})$|s from different blocks are independent, the |${R}_{i,b}$|s within a block are a random sample of random variables or a function of the ranks of such a sample, and the |${T}_{i,b}$|s within a block are a random sample from a finite or infinite population drawn with or without replacement. The type of response involved in |$S$| is quite general and may consist of the ranks of an ordinal variable; the treatments may correspond to the levels of an actual medical treatment (e.g. assuming the values 0, 1, 2, 3, with 0 signifying a placebo and 1, 2 and 3 increasing doses of treatment), to group labels (e.g. 0 for a healthy group, 1 for a diseased group) or indeed to any ordinal variable coded in numbers. Although treatments and responses need not be thought of as being causally related or as following a particular temporal order, the object of |$S$| is their joint distribution: for |$S$| is meant to test the null hypothesis of independence between treatments and responses in all blocks. The conditional null distribution of |$S$| is the distribution of the random variable |$\overset{\sim }{S}={\sum}_{b=1}^B{\sum}_{i=1}^{n_b}{\overset{\sim }{T}}_{i,b}{R}_{i,b}$|, where the |${\overset{\sim }{T}}_{i,b}$|s are the |${T}_{i,b}$|s randomly permuted within blocks (each permutation having the same block-dependent probability), and from it, or from an estimate of it obtained by simulation, one computes the P-value associated with |$S$|. The statistic is a sum of inner products of vectors of treatments and vectors of responses. Since adding to it and multiplying it by functions of the |${R}_{i,b}$|s and |${T}_{i,b}$|s, which are invariant to within-block permutations of the |${T}_{i,b}$|s, does not affect the associated distribution, |$S$| is equivalent, as far as testing is concerned, to a weighted sum of sample covariances or correlations between treatments and responses; in particular, if the |${T}_{i,b}$|s are binary, the test based on |$S$| amounts to a test based on the overall difference between average responses in two groups. It follows from this observation that if treatments and responses are associated at least in some of the blocks and―as is often the case with biomedical variables―the associations have the same direction (not necessarily the same strength) in most of those blocks, then |$S$| provides a consistent test of the null hypothesis of independence, and in many realistic situations it is known to have certain optimality properties [4, 8]. Regarding its application to testing differential abundance in studies of the microbiome, it is evident that the occurrence of few or many zeros among the |${R}_{i,b}$|s does not pose problems to the calculation of |$S$| and of its null distribution. The only unpleasant consequence that a large proportion of zeros may have is a very discrete distribution of p-values, with support clearly bounded away from zero, which is well known [e.g. 9, 10] to imply some loss of power in multiple testing procedures rather than a violation of the nominal FDR (too few rather than too many rejections). Let us also mention that by regarding each individual as a block and treatment as indicator of time of sampling (e.g. before and after illness, medical intervention, etc.) |$S$| can be used to identify changes in the abundance of taxa within a population of patients, and it can be used to detect the strongest pairwise associations between the abundances of interesting subsets of taxa (e.g. taxa that, in a previous step of the study, have been selected for their probable association with a clinical variable; for this purpose one simply takes the |${R}_{i,b}$|s and |${T}_{i,b}$|s to be the abundances of a pair of taxa). A useful implementation of sum statistics is provided by the R package coin [5] in the form of the ‘independence test’. This package also provides implementations of the Spearman test (with or without blocking), which can also be seen as a sum statistic corresponding to certain choices of treatments and responses, and of Friedman’s test, which serves to detect changes in the abundance of taxa in the same population over two or more occasions. Incidentally, temporal patterns in the abundance of taxa, and the correlation of such patterns with other variables, may be studied by using measures of overall abundance, trend or ‘peakedness’ (area under the curve, Theil–Sen estimator, time of maximum/minimum abundance, etc.) at the patient level in combination with the tests statistics mentioned above.
In situations where the direction of the associations could vary from block to block, sum statistics may dilute the evidence for an association over the blocks and hence loose power. Permutation versions of the Anderson–Darling and Kruskal–Wallis tests may then be useful provided the |${T}_{i,b}$|s can be made to separate the |${R}_{i,b}$|s into groups. The first test in particular is consistent against any difference between two or more distribution functions within one or more blocks, and the second is consistent against most plausible deviations from the null. In their exact or Monte Carlo versions both tests cope perfectly well with ties (in particular with the occurrence of zeros, which get the same lower rank), the only inconvenience of which is, again, some conservativeness in multiple testing procedures due to the more pronounced discreteness of the p-values. The R package kSamples [7] provides useful implementations of these and other rank tests (the Kruskal–Wallis test is also implemented in coin).
Our experience with 16S rRNA data on the abundance of approximately 800 taxa measured on groups of about 200 people each confirms that the tests mentioned above (blocked by sex and age, sometimes also by BMI, or unblocked), and especially the ‘independence test’ of the coin package, have non-negligible power to detect differences in bacterial abundance and associations between the abundances of different taxa (see the illustrations in the next section). Moreover, as expected by the general considerations of the two preceding paragraphs, the distributions of their p-values derived from the ‘real data shuffling’ procedure mentioned earlier are perfectly compatible with a uniform distribution. In fact, given the nature of the tests considered, the only explanation for an eventual deviation from the uniform distribution on the part of the histogram of p-values towards an unduly decreasing density overly peaked near the origin would be a very strong dependence between many of the p-values, which in turn could result only from a very strong dependence between the abundances of many different taxa (on the workings of the BH method under dependence see for example [3, pp. 12–14] and references therein). But, as researchers working with microbiome data know or may verify (e.g. by looking at bar plots of the joint occurrence of zero or positive abundances and at scatter plots of positive abundances; see the example in Figure 4), the relative abundances of different taxa are weakly dependent, and the groups of taxa revealing a non-negligible dependence are small.
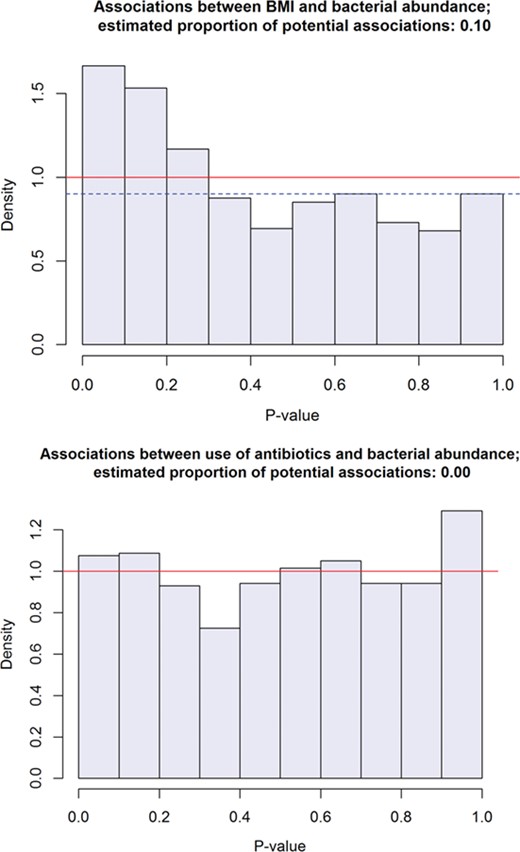
Histograms of p-values from tests of association between the relative abundance of each of about 830 taxa and each of two variables: BMI (above) and use of antibiotics (a binary variable) sometime during the month prior to sampling. The tests are based on the sum statistic with sex and age stratum as blocking factor; their p-values have been estimated by 10 million random permutations. A lower bound for the proportion of potential associations can be estimated from the height of the histograms near 1. The weak ‘signal’ provided by the second histogram shows that, despite the dependence between the abundances of different taxa, the p-values ‘under the null’ have a histogram that looks very much like a uniform density.

Plots illustrating the putative associations between E. rectale and BMI (above) and between C. mitsuokai and antibiotics (binary variable equal to 1 in patients who used antibiotics sometime during the month prior to sampling). In the first case, BMI tends to be somewhat higher in patients with whom the taxon is present and more abundant; in the second the taxon is more frequently present and more abundant in patients who took antibiotics.
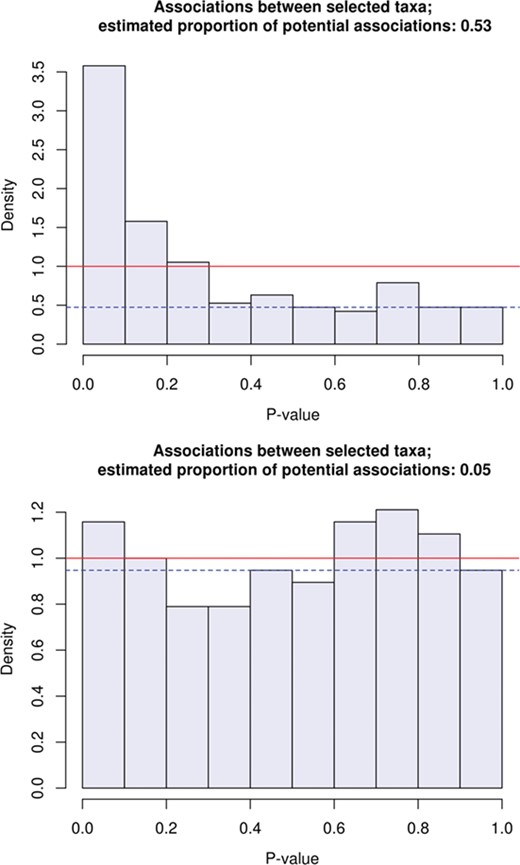
Histograms of p-values from tests of association between the relative abundance of pairs of 20 taxa selected for their putative association with BMI (18 taxa) and with use of antibiotics; the |$190=20\times 19/2$| tests and the estimates shown are completely analogous to those described in Figure 1. The first histogram is of p-values of tests on the real data and suggests that about 50% of the 190 pairs of the selected taxa are dependent. The second is of p-values of tests on ‘randomly shuffled’ abundances and is meant to simulate the ‘null situation’ in which the taxa are independent; despite their being dependent (each taxon being involved in 19 tests), the p-values seem compatible with a uniform distribution.

Bar, scatter and box plots illustrating the association between E. rectale and Lachnospiraceae bacterium, one of the stronger pairwise associations between the 20 taxa selected for their potential associations with BMI or antibiotics.
These statements are in fact illustrated by the results of Hawinkel et al.: since the t- and Wilcoxon tests used by them correspond approximately or exactly to a test based on the sum statistic and to a rank test (the former differs from the special version of the sum statistic for comparing two groups only by a multiplicative constant, which is somewhat dependent on the permutations; the latter can differ from the one we use only in details of implementation), the general considerations made earlier predict that those tests yield appropriate p-values and should have some power at least for some sample sizes. Accordingly, the simulations in [1] show that the permutation version of the t- and Wilcoxon tests have no problems in maintaining the nominal FDR and that they have some power except for very small sample sizes (which is only natural). It follows that if the control of the FDR fails in a study of the microbiome it is not because of a putative strong dependence between the relative abundances of different taxa but because the p-values are numerically inaccurate or are based on an inappropriate test or model.
One way of mitigating the loss of power entailed by overly discrete p-values may be to refrain from testing associations with bacterial taxa for which even the most extreme indication of an association in the face of the available data would correspond to a large P-value, say above 0.1. For instance, in the comparison between groups, the lowest P-value attainable would be obtained by assigning all or most positive abundances to one group and all or most of the zero abundances to the other groups; if such a P-value turned out to be |$\ge$|0.1, the test should not be even attempted. This is only a primitive version of the methods proposed in [11] and in [12], which, as the method recently proposed in [10], may prove useful in multiple testing problems involving smaller samples of microbiome data. Incidentally, we recall that in problems involving many tests (e.g. in the hundreds) and reasonably large sample sizes (e.g. large enough to generate smooth histograms in the ‘real data shuffling’ procedure) one may benefit from using an ‘adaptive’ version of the BH method, often more powerful than the standard version (e.g. [3, pp. 11, 14]); such versions depend on a lower bound for the proportion of discoveries to be made in a study, an estimate of which is often interesting.
Finally, let us recognize that the accurate estimation of p-values of permutation tests can be computationally demanding, especially when the tests are many and the smaller p-values are very small. In order to reduce computation one may consider using large numbers of permutations only to compute p-values that are clearly small. In many cases (e.g. as with sum statistics), the asymptotic distributions of the statistics provide excellent approximations to the exact p-values except for the very small or very large ones; whether this is the case or not―and whether the approximate p-values can replace the exact ones within a certain range (say from 0.05 to 0.95) without affecting the multiple testing procedure or seriously deforming the histogram of p-values―can always be verified in each particular case by simulation and may lead to substantial savings in computing.
Illustration
In order to illustrate some of these tools and methods we use a dataset from a study on the faecal microbiome conducted by the second author and her collaborators, the details and results of which are to be published elsewhere. The participants in the study were selected from a cohort of healthy individuals 60 years old or older surveilled during the winter of 2014/15 for influenza-like illness (ILI). Faecal samples were obtained from the participants and used to characterize their microbiome in terms of 16S rRNA abundance data on so-called ‘operational taxonomic units’ to which we shall refer simply as ‘taxa’. In addition, information on basic personal characteristics, use of medication, co-morbidities, etc. and samples of blood and saliva, were collected with the purpose of studying the relations between the microbiota and certain personal and biomedical parameters. Ethical approval for the study was granted by the national ethics committee of the Netherlands (NTR4818). For our illustrations we consider the relative abundances of 833 taxa and the age, sex, BMI and record of antibiotic use of 184 patients who reported no symptoms of ILI throughout the winter.
Since BMI is related to diet, we may expect it to correlate with the relative abundance of certain taxa. Testing the association between each of the 833 taxa and BMI by means of the sum statistic with age and sex strata as blocks and applying the BH method at the nominal FDR level of 10% to the resulting p-values (estimated by 10 million permutations) yields a list of 18 taxa that are potentially correlated with BMI―among which we may expect one or two (about 10% of 18) to be independent of BMI. The histogram of the p-values, shown in Figure 1, has the expected shape of a decreasing density with a peak at zero; from it one can estimate that 10% or more of the taxa―say at least 80 of them―are associated with BMI, though we are unable to find more than 16 or 18 (which means that our ‘average power’ is no greater than about 20 or 25%). If the testing procedure is applied to the same data but with the BMI data randomly permuted then the histogram of the p-values is almost perfectly flat, like a standard uniform density, and accordingly the typical outcome is that no discoveries are made. In this case the good looks of the histograms may be attributed to the practically continuous character of BMI, so it is instructive to look at another variable that puts the mixed character of microbiome data to the test. ‘Antibiotics’, a binary variable equal to one for patients using antibiotics sometime during the month prior to sampling, may be such a variable and one that may be correlated with some taxa. Since only 21 of the 184 participants used antibiotics, one may expect the distribution of the p-values of the sum statistic (used exactly as for BMI) to deviate somewhat from the uniform. And indeed, its histogram, the second in Figure 1, reveals a slight overabundance of large p-values, which correspond to taxa detected in only a few participants. This type of deviation from the uniform distribution has no consequences for the actual FDR, and, if anything, will decrease power of detection and make it difficult to get an informative lower bound for the proportion of discoveries to be made. In this case, because the histogram does not exhibit a convincing peak near zero, one really has no right to expect more power or a more informative estimate for that proportion than zero. Still, at the nominal FDR level of 10%, the BH method selects two taxa for being potentially correlated with antibiotics, which suggests that, despite the weak ‘signal’ emitted by the histogram, there may be a few more discoveries to make.
As always, results thought to be ‘significant’ must be examined by statistical and non-statistical means. The plots in Figure 2 illustrate the strongest of the supposed associations between the taxa and BMI and between the taxa and antibiotics. Although Eubacterium rectale is normally associated with a healthy diet [13], most of the individuals of our cohort have long passed middle age, and it is those among them who have a lower BMI who tend to be less healthy. An increased abundance of Catenibacterium mitsuokai has been linked to disruptions of the microbiome by dietary interventions [e.g. 14], but its greater abundance among the participants using antibiotics is not clear to us.
Once a number of taxa have been selected based on their putative relations with medical or other variables one may find it interesting to determine groups of taxa that are more strongly correlated with each other. One way of doing this is to perform pairwise tests of association between all the taxa and apply the BH to correct for multiple testing. As an example, we use the sum statistic as before to perform the 190 pairwise tests of independence between the 20 taxa supposed to be associated with BMI and antibiotic use. The histogram of the resulting p-values, shown in Figure 3, suggests that no less than 50% of the 190 pairs of the selected taxa are dependent, and it is not surprising that at a nominal FDR level of 10% we find evidence of associations between 46 different pairs (among which five could be spurious). If one chooses to entertain such a list (or a subset of it) of pairwise associations seriously, there may follow other associations by transitivity (if taxa 1 and 2 and taxa 2 and 3 are associated then so are 1 and 3); the taxa involved can then be connected with other variables they may be associated with in a ‘map of relationships’ [3, p. 44]. Again, associations between taxa must be checked, if only because their relationships (due to the noisy and mixed character of microbiome data) are seldom straightforward. The plots in Figure 4 illustrate what should be one of the strongest associations between two taxa, namely the positive association between E. rectale and Lachnospiraceae bacterium.
When the number of tests performed is relatively small, the histogram of the p-values will tend to be more variable and therefore may not provide a completely reliable check on the correctness of the BH method. In that case the lower bound on the proportion of discoveries to be made may not be reliable and the standard version of the BH method (which is independent of such a lower bound) is preferable to the adaptive one. For instance, if we repeat the last test procedure with random permutations of the abundances of the 20 taxa in order to simulate the testing of pairwise associations under the hypothesis that no single association exists, we find that the histogram of the p-values, despite being generally quite close to a uniform density, is rather variable, as exemplified by the second histogram of Figure 3. Despite this variability, the BH method should ensure the control of the FDR, but when in doubt one can check whether this is the case by estimating the actual FDR through the exercise of simulation just mentioned; with the present data we find that at the nominal FDR level of 10% the actual FDR is about 10%.
The Benjamini–Hochberg method can help control the false discovery rate (FDR) in association studies of the microbiome.
The correctness of the models and methods used to compute p-values of tests is essential to guarantee the control of the FDR.
Appropriate statistical methods can cope with the particular characteristics of microbiome data.
Acknowledgment
We thank our colleague Hendriek Boshuizen for bringing the work of Hawinkel et al. to our attention.
Funding
The RIVM, the National Institute for Public Health and the Environment, is the principal knowledge institute in the field of public health, nutrition, safety and the environment in the Netherlands. It conducts research and performs tasks to promote both public health and a healthy and safe environment.
José A. Ferreira has a PhD in probability and statistics and has worked as an applied statistician for more than 20 years. He has been working at the RIVM since 2009 in a variety of applied statistical problems related to health and the environment.
Susana Fuentes is a microbial ecologist who has been working in the field of (gut) microbiome research for over 15 years. In her current position at the RIVM (since 2016) she works with next generation sequencing data in order to understand the role of the human microbiome and develop applications of it for public health.
