


Abstract
The pathogenesis of multiple sclerosis (MS) is significantly regulated by long noncoding RNAs (lncRNAs), the expression of which is substantially influenced by a number of MS-associated risk single nucleotide polymorphisms (SNPs). It is thus hypothesized that the dysregulation of lncRNA induced by genomic variants may be one of the key molecular mechanisms for the pathology of MS. However, due to the lack of sufficient data on lncRNA expression and SNP genotypes of the same MS patients, such molecular mechanisms underlying the pathology of MS remain elusive. In this study, a bioinformatics strategy was applied to obtain lncRNA expression and SNP genotype data simultaneously from 142 samples (51 MS patients and 91 controls) based on RNA-seq data, and an expression quantitative trait loci (eQTL) analysis was conducted. In total, 2383 differentially expressed lncRNAs were identified as specifically expressing in brain-related tissues, and 517 of them were affected by SNPs. Then, the functional characterization, secondary structure changes and tissue and disease specificity of the cis-eQTL SNPs and lncRNA were assessed. The cis-eQTL SNPs were substantially and specifically enriched in neurological disease and intergenic region, and the secondary structure was altered in 17.6% of all lncRNAs in MS. Finally, the weighted gene coexpression network and gene set enrichment analyses were used to investigate how the influence of SNPs on lncRNAs contributed to the pathogenesis of MS. As a result, the regulation of lncRNAs by SNPs was found to mainly influence the antigen processing/presentation and mitogen-activated protein kinases (MAPK) signaling pathway in MS. These results revealed the effectiveness of the strategy proposed in this study and give insight into the mechanism (SNP-mediated modulation of lncRNAs) underlying the pathology of MS.
Introduction
Multiple sclerosis (MS) is an immune-mediated neurodegenerative disease and is characterized by the inflammation and demyelination in central nervous system (CNS) [1]. Currently, the estimated number of individuals with MS has reached approximately 2.3 million worldwide according to the Atlas of MS investigation [2]. Although the etiology of MS has been extensively explored, the potential key factors contributing to MS’s pathogenesis involving genetic variants and transcriptional regulation in genomic regulatory regions remain poorly understood [3, 4].
The long noncoding RNAs (lncRNAs), defined as non-protein-coding transcripts of >200 nucleotides, are widely involved in a variety of key biological and cellular processes [5]. Previous studies showed that the expression of lncRNA is particularly abundant in CNS [6], and the lncRNAs act as the critical regulators of the neural and immune system, such as the oligodendrocyte maturation in neural cell fate determination [6, 7], differentiation of CD4+ T cells and activation of inflammatory molecules in the immune response [8]. The dysregulation of lncRNAs influences the progression of numerous nervous system disorders, including MS [6, 9–13]. For example, the lncRNA NeST affects the susceptibility of MS by regulating T-cell response [9]. The upregulation of lnc-OPC inhibits the differentiation of the oligodendrocyte cells in glial progenitors of MS [10]. The studies further reported that many lncRNAs (e.g. NEAT1, TUG1 and THRIL) are specifically expressed in the blood of MS patients [11–13].
Moreover, previous studies showed that most of the disease-related single nucleotide polymorphisms (SNPs) are located in noncoding regions (approximately 93%) and play key roles in the regulation of lncRNA expression, structure and function [14, 15]. This specific regulation is significantly associated with the pathogenesis of many complex diseases [14–18]. For MS, more than 200 risk variants in the human genome have been identified by genome-wide association studies (GWAS) [19–23], and some of these variants affect the secondary structure of RNA transcripts [24, 25]. Based on these findings, it can be hypothesized that the regulation of many MS-related lncRNAs is controlled by certain genomic variants, representing a potentially important molecular mechanism in the pathology of MS. However, to date, no systematic study has been performed to detect the influence of SNPs on the disease-related lncRNAs in MS and how this mechanism contributes to the pathogenesis of MS.
Evidence shows that the expression quantitative trait loci (eQTLs) have become an important tool for achieving this systematic research and understanding the mechanisms underlying the gene expression affected by variations [26–29]. For example, Montgomery et al. [26] selected 60 Caucasian individuals and performed eQTL analysis based on the next generation sequencing and HapMap project. They found that a substantial number of variants significantly affect the alternative splicing of the transcripts. Pickrell et al. [27] sequenced RNA from 69 lymphoblastoid cell lines of the unrelated Nigerian individuals that have been extensively genotyped by HapMap Project and further performed eQTL analysis. They also demonstrated that the genetic variants influence the expression levels or splicing of the transcripts. Lappalainen et al. [28] performed an eQTL analysis using lymphoblastoid cell line of 462 individuals from the 1000 Genomes project (GEUVADIS) and provide a deep understanding of the transcriptome variation in the cellular mechanisms. The GTEx project presented an expression analysis of 1641 samples across 43 tissues from 175 individuals and genotyped the SNPs of the samples according to 1000 Genomes Phase I. The results described the landscape of gene expression across various tissues and showed a tissue specific of the eQTL variants [29].
However, it is challenging to simultaneously obtain the data of lncRNA expression and SNP genotype from the same MS individual based on publicly available resources. Recently, next-generation cDNA sequencing (RNA-seq) has emerged as a powerful and effective tool to survey the entire transcriptome in high-throughput and quantitative manner [30, 31]. On one hand, RNA-seq is one of the most useful tools to measure the expression of lncRNAs by mapping and quantifying their transcriptomes [32–35]. On the other hand, it can also be used to genotype large-scale SNPs (tens to hundreds of thousands) in the entire human genome [30, 36]. Moreover, compared with the traditional methods (e.g. SNP arrays), RNA-seq requires fewer samples (typically tens to hundreds of individuals), is less susceptible to the heterogeneity of populations and is more likely to discover functional SNPs [36]. Herein, the differential expression of the lncRNAs was first quantified, and the SNPs on a whole-genome scale were genotyped based on the blood RNA-seq data from 51 patients and 91 controls of European descent. For the false positive of SNP calling, a series of approaches were performed to reduce it (Materials and methods). Combining the data of expression and genotype, an eQTL analysis was further performed to identify the cis-acting loci and the affected lnRNAs in MS and assess tissue and disease specificity. Then, the functional characterization of the cis-eQTL SNPs and their influence on the secondary structure of lncRNAs were explored. Finally, a weighted gene coexpression network analysis (WGCNA) and gene set enrichment analysis (GSEA) of the affected lnRNAs were conducted, and the differentially expressed protein-coding genes were identified to investigate how the influence of SNPs on lncRNAs contributes to the pathogenesis of MS. The flow chart was shown in Figure 1.
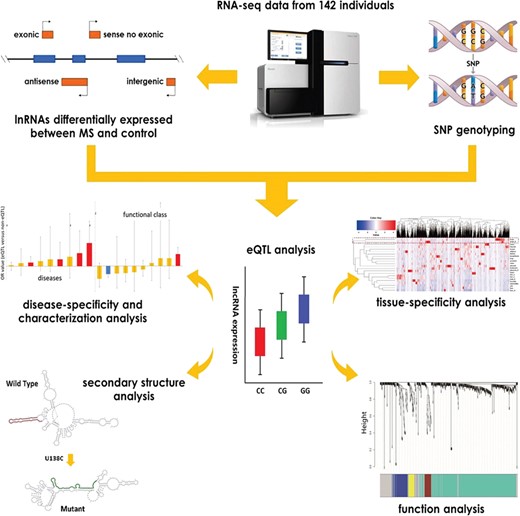
The flow chart of the study design for identification and function analysis of the eQTL lncRNAs in MS.
Summary of the 142 individuals studied in this work
| Individuals | Institution | Ethnicity | Sample size | Mean age (SD) | Male/female (%) |
|---|---|---|---|---|---|
| MS patients | VUMC | European | 51 | 46.14 (7.54) | 25.5/74.5 |
| Healthy controls | VUMC and UMCU | European | 91 | 46.92 (8.50) | 34.1/65.9 |
| Total | 142 | 46.64 (8.18) | 31.0/69.0 |
VUMC: VU University Medical Center, Amsterdam, Netherlands
UMCU: Utrecht Medical Center, Utrecht, Netherlands
Results and discussion
Quantification of the differentially expressed lnRNAs in MS
We first selected the blood RNA-seq data of 51 MS patients and 91 gender- and age-matched healthy individuals without neurological diseases (for summary statistics, Table 1 and Materials and methods) from Gene Expression Omnibus (GEO) data set GSE89843 [37]. In total, approximately 3.2 billion sequenced reads were obtained for the following steps. We next merged the FASTA format files of lncRNA transcript sequences (a total 172 216 transcript sequences of 96 308 human lncRNA genes from NONCODE v5 database [38]) and protein-coding genes transcript sequences (160 040 transcript sequences of 22 810 human protein-coding genes from Ensembl release 91 [39]) as the reference sequence. Subsequently, we calculated the transcript per million (TPM) values to measure expression levels of these transcripts in each individual by Kallisto software [40]. Then, based on the annotation file Transcript2Gene (the correspondence between lncRNAs and their transcripts) from the NONCODE database, we calculated the lncRNA expression levels by integrating transcript-level abundance using the R package ‘tximport’ [41]. Finally, after the differential gene expression analysis using the R package ‘DESeq’ with the parameters, age and gender serving as covariates [42], we identified 2383 lncRNAs significantly differentially expressed between MS and healthy subjects (fold-change (|$FC$|) |$\ge 1.5$| and |$P<0.05$|), which includes 1438 downregulated and 945 upregulated lncRNAs (Supplementary Table S1). In addition, through a Pearson’s correlation analysis, we also found that the expressions of these lncRNAs are highly positively correlated before and after adding the protein-coding genes in the quantifications (about 86.6% correlation coefficients are equal or higher than 0.9 with the |$P<0.05$|). We plotted a frequency histogram to show the distribution of these correlation coefficients (Supplementary Figure S1).
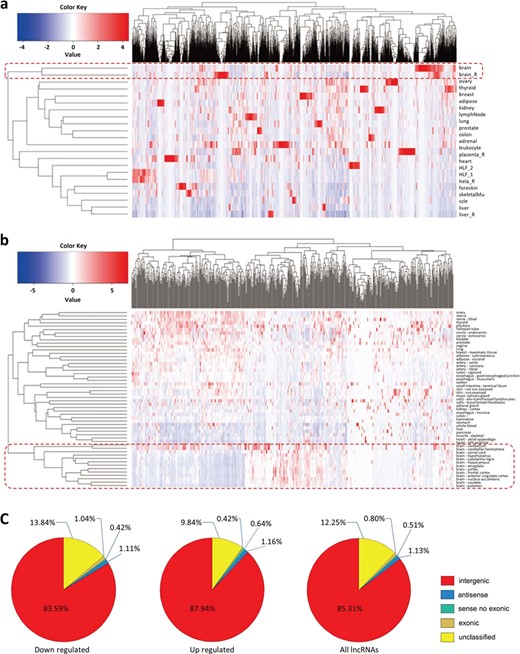
Characterization of differentially expressed lncRNAs. (a) A hierarchical clustering heatmap of the lncRNAs (significantly differentially expressed between MS and healthy subjects) expression in primary human tissues and cell lines based on NONCODE data. The abscissa represents the differently expressed lncRNAs. HLF indicates the human lung fibroblasts. The expression pattern of these lncRNAs in brain and in other tissues and cell lines is clearly classified into two different clusters. (b) A hierarchical clustering heatmap of the lncRNAs in 13 brain regions and other primary human tissues based on GTEx data. The abscissa represents the differently expressed lncRNAs. The expression pattern of these lncRNAs in the 13 brain regions and in other tissues is clearly classified into two different clusters. (c) Pie charts indicating the percentage of each type of the differentially expressed lncRNAs. Most of these lncRNAs belong to the intergenic transcripts compared with the other types, and this pattern is similar between the downregulated and upregulated lncRNAs. The details in the figure can be clearly viewed by enlarging the electronic version.
According to the categories of lncRNAs in NONCODE database, we found that these differentially expressed lncRNAs mainly belong to the four classes including intergenic, exonic, sense no exonic and antisense, and the proportion of intergenic lncRNAs is significantly increased compared with other types. Particularly, the intergenic lncRNAs account for approximately 83.59% and 87.94% of the downregulated and upregulated lncRNAs, respectively (Figure 2c). Then, to test the tissue specificity of these differentially expressed lncRNAs, we downloaded the expression data of these lncRNAs in primary human tissues and cell lines (including adipose, adrenal, brain, breast, colon, foreskin, heart, kidney, liver, lung, lymph node, ovary, placenta, prostate, skeletal muscle, thyroid, leukocyte, lung fibroblasts and HeLa cells) from NONCODE database and used these data to cluster lncRNAs based on Manhattan distance by the R package ‘gplots’ (https://CRAN.R-project.org/package=gplots). As noted in Figure 2a, although the samples are obtained from blood, these lncRNAs are still highly specifically expressed in brain tissue. To further verify these findings, we downloaded the lncRNA expression data (a gene TPM file) in a variety of human tissues from GTEx, which include adipose, adrenal gland, bladder, blood vessel, breast, cervix uteri, colon, esophagus, fallopian tube, heart, kidney cortex, liver, lung, minor salivary gland, skeletal muscle, tibial nerve, ovary, pancreas, pituitary, prostate, whole blood, skin, small intestine, stomach, spleen, thyroid, uterus, vagina and 13 brain regions (amygdala, anterior cingulate, caudate, cerebellum, cortex, frontal cortex, hippocampus, hypothalamus, nucleus accumbens, putamen, spinal cord and substantia nigra) [29]. After the lncRNA ID conversion (from NONCODE ID to Ensembl ID), a total of 648 of these differentially expressed lncRNAs exist in the GTEx gene TPM file. We calculated the average lncRNA expression levels of the GTEx individuals in each tissue and performed a cluster analysis by the same method used in NONCODE data. Similarly with our previous findings, these lncRNAs are highly specifically expressed in the 13 brain regions (Figure 2b). These findings suggest that in addition to inflammation and demyelination [1], MS also exhibits the characteristics of the CNS disorder in lncRNAs dysregulation.
SNP genotyping and lncRNA cis-eQTLs identification
To obtain the SNP genotyping data of the same samples, we first aligned the approximately 3.2 billion sequenced reads of all the individuals to human reference genome (hg19) using BWA software [43]. Then, we used these aligned reads to call variant genotypes using SAMtools [44] and BCFtools software [45]. Further, to obtain reliable variant genotypes, low-quality results (according to the common threshold of read depth (DP) |$<10$| or root mean square (RMS) mapping quality of |$<10$| or minor allele frequency (MAF) of |$<1\%$|) and variants that deviated from Hardy–Weinberg equilibrium (HWE) (|$P<5\times {10}^{-5}$|, calculated by the R package ‘Genetics’) were removed. Finally, we annotated the qualified genotype data using ANNOVAR software [46] and obtained a total of 600 872 genotyped SNPs and 19 467 indels.
Subsequently, to assess the cis-acting influence of variants on the expression of lncRNAs in MS, we used the variant genotyping data and the lncRNA expression data from the same samples to perform an eQTL analysis using the R package ‘Matrix eQTL’ [47] with the parameters, age, gender, three probabilistic estimation of expression residuals (PEER) factors and population stratification serving as covariates. Among these parameters, PEER factors were obtained by the R package ‘PEER’ based on Bayesian method [48], and population stratification was divided by source of the individuals (Amsterdam or Utrecht). Previous studies reported that the process of gene transcription is mainly affected by the SNPs located within 100 kb around the corresponding genes [49, 50]. Therefore, we established a ± 100 kb window (between the variant loci and lncRNA genes) for this eQTL analysis (see Materials and methods for details). After removing the 308 lncRNAs without genomic position information, we identified a total of 23 661 variants affecting 1141 lncRNAs of the remaining 2075 differentially expressed lncRNAs with a significance level of |$P<0.05$|.
For the more stringent identification of eQTLs, we further conducted two additional quality control procedures. First, we added the interaction terms in our eQTL analysis model by the ‘lm’ function in R. Combining the results of eQTL analysis in previous steps, we identified a total of 2552 variants affecting 868 lncRNAs only in MS and not in the healthy individuals with a significance level of |$P<0.05$|. Then, according to the previous studies [29, 51], we performed the permutation procedure to correct for multiple variants testing per gene expression and the multiple testing corrections based on the false discovery rates (FDR) using Storey approach (the threshold of q-value |$<0.05$|) (see Materials and methods for details). Finally, after removing the 12 lncRNAs influenced by the indels, a total of 1054 cis-eQTL SNPs affecting 517 lncRNAs were identified (Supplementary Table S2).
The number of the cis-eQTLs per lncRNA is from a minimum of 1 to a maximum of 23, and this distribution is in general positively correlated with the length of lncRNA and the SNP abundance in corresponding regions. Moreover, we further explored the association between the P-values of these cis-eQTLs and their distance from the transcription start site (TSS) of the corresponding lncRNAs. We provided a plot with x-axis the distance and y-axis the -log10 of P-values and found that the cis-eQTLs are generally clustered around the TSS, especially the cis-eQTLs with lower P-values (Supplementary Figure S2).
Disease specificity and functional characterization of the lncRNA cis-eQTLs
We explored the disease specificity and functional characterization of the lncRNA cis-eQTLs by comparing them with the non-eQTL SNPs. Therefore, we first selected the SNPs with eQTL |$P>0.5$| from all the 178 451 variants located within 100 kb around the lncRNAs and defined them as the non-eQTL SNPs according to the previous study [50]. Then, to avoid the influence of linkage disequilibrium (LD), we performed LD-based filtering for the cis-eQTL and non-eQTL SNPs using HaploReg (version 4) [52] based on the European data set of the 1000 Genomes Project (the threshold of |$\kern0.5em {r}^2>0.5$|) [53]. Next, we further extracted the non-eQTL SNPs with the MAF and distance from the TSS matched to the cis-eQTL SNPs data set. Finally, we obtained 803 cis-eQTL and 18 803 non-eQTL SNPs, which are matched in MAF and distance and independent of each other, after these filtering processes (Supplementary Table S3) (see Materials and methods for details).
For the disease-specificity analysis, we first downloaded the tag SNP (identified by GWAS, |$P<1.0\times {10}^{-5}$|) data from the GWASdb (version 2) database [54]. Then, we used the tag SNPs to identify the SNPs in LD with them (|${r}^2>0.4$|) by HaploReg, according to the previous study [50], and collectively defined them as the disease-related SNPs. We found that there are nine common CNS and other disorders whose disease-related SNPs are overlapped with the cis-eQTL and non-eQTL SNPs, and we selected them for the downstream analyses (see Materials and methods for details). Finally, we compared the proportions of the cis- and non-eQTL SNPs in the disease-related SNPs for each of the disorders using the two-tailed Fisher’s exact test (the threshold of |$\kern0.5em P<0.05$|). The lncRNA cis-eQTL SNPs are mainly enriched in the CNS disease-related SNPs, which include the MS (odds ratio |$(OR)=17.67,\kern0.5em P=1.1\times {10}^{-5}$|), schizophrenia (|$OR=10.32, P=1.6\times {10}^{-5}$|), Parkinson’s disease (|$OR=5.88,\kern0.5em P=8.0\times {10}^{-3}$|) and Alzheimer’s disease (|$OR=3.58,\kern0.5em P=5.6\times {10}^{-3}$|), compared with non-eQTL SNPs. In contrast, significant enrichment was not observed among the SNPs associated with the nonneurological diseases, e.g. type 2 diabetes (|$P=1.1\times {10}^{-1}$|) and rheumatoid arthritis (|$P=1.4\, \times\, {10}^{-1}$|) (Figure 3a). The results revealed the association of these lncRNA cis-eQTL SNPs with MS and suggested that the influence of lncRNA expression by genomic variants has specificity and similarity in CNS diseases.
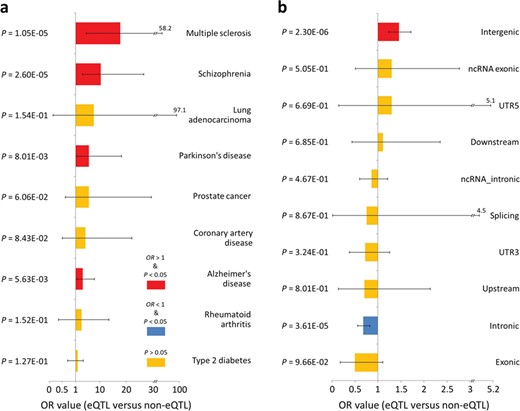
The disease specificity and functional characterization of the lncRNA cis-eQTLs. (a) The disease specificity of the lncRNA cis-eQTLs. The two-tailed Fisher’s exact test was used to explore enrichment of the lncRNA cis-eQTLs among nine common CNS and nonneurological diseases compared with non-eQTL SNPs. These lncRNA cis-eQTL SNPs are mainly enriched in the CNS disorders including MS, rather than the nonneurological diseases. (b) The functional characterization of the lncRNA cis-eQTLs. Enrichment analysis of the lncRNA cis-eQTLs among 10 functional types of variants was performed using a two-tailed Fisher’s exact test. Compared with the non-eQTL SNPs, these lncRNA cis-eQTL SNPs are significantly and uniquely enriched in intergenic region. The black bars in histogram represent 95% confidence intervals.
Further, to explore the functional characterization of the lncRNA cis-eQTLs, we compared the proportions of each functional class (including intergenic, intronic, exonic, ncRNA intronic, ncRNA exonic, 5′/3′-UTR, upstream/downstream and splicing variants; annotated by ANNOVAR software [46]; see Materials and methods) in cis- and non-eQTL SNPs with the threshold of two-tailed Fisher’s exact test |$\kern0.5em P<0.05$|. We found that the lncRNA cis-eQTL SNPs are significantly and uniquely enriched among variants in intergenic region (|$OR=1.46,\kern0.5em P=2.3\times {10}^{-6}$|) compared with the non-eQTL SNPs (Figure 3b). The results were consistent with the type distribution of the differentially expressed MS lncRNAs observed in this study (approximately 85.31% of them belong to intergenic lncRNAs) and revealed specific regulation of the lncRNAs by SNPs in MS.
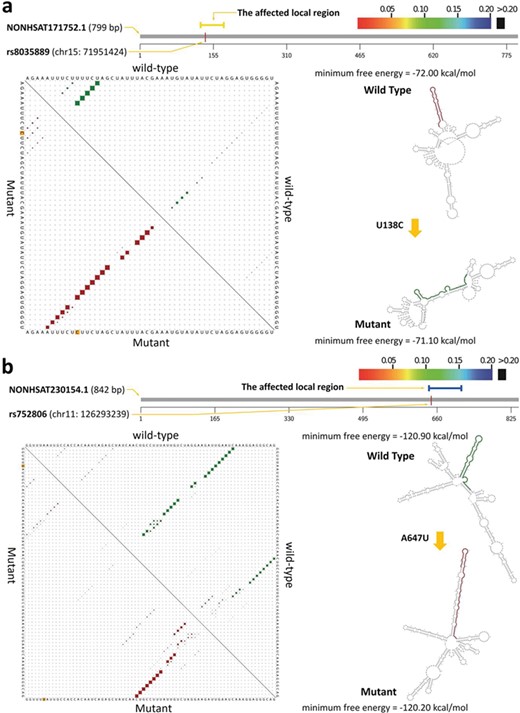
Secondary structure changes of the lncRNA transcripts by cis-eQTL SNPs. Subfigures (a) and (b) present the secondary structure of NONHSAT171752.1 and NONHSAT230154.1 affected by rs8035889 and rs752806 polymorphisms, respectively. On the top of each subfigure, the graphic summary revealed the significantly affected local region of the lncRNA transcript and the causative SNP. The affected local region detected with maximum secondary structural change is colored according to the RNAsnp P-value (threshold of significance is set at |$\kern0.5em P<0.2$|). At the bottom left, the upper and lower triangle of the matrix represents the base-pair probabilities in the affected local region of the wild-type (green dots) and mutant (red dots) sequences, respectively. At the bottom right, the planar graph displayed the secondary structure differences between wild-type and mutant lncRNA transcripts based on the MFE change.
The influence of lncRNA secondary structure by cis-eQTL SNPs
Previous studies reported that some SNPs can affect the secondary structure of noncoding RNAs in MS [24, 25]. Therefore, to explore the influence of the secondary structure of the differentially expressed lncRNAs by the cis-eQTL SNPs, we assessed the maximal structural change of the lncRNA mutant regions compared with wild type by RNAsnp software [55]. For this purpose, we first selected the 41 cis-eQTL SNPs located within 34 differentially expressed lncRNA genes and obtained 38 transcript sequences of these lncRNA genes from NONCODE FASTA files. Then, the effect of SNPs on short (|$<1000\ nt$|) and large (|$>1000\ nt$|) lncRNA transcript sequences was calculated using mode 1 and mode 2 of the RNAsnp software, respectively (see Materials and methods for details). After these processes, we found that the secondary structure of six transcripts belonging to six lncRNAs (approximately 17.6%) is significantly influenced by at least one of the cis-eQTL SNPs (|$P<0.2$|) (Supplementary Table S4). Given that secondary structure changes in RNAs are an important factor affecting their expression level, we hypothesized that a part of the lncRNA dysregulation in MS arises from secondary structure changes caused by genomic variants. Figure 4 presents the secondary structure changes of the two short lncRNA transcripts affected by the cis-eQTL SNPs. Particularly, the rs8035889 T to C allele substitution changed the minimum free energy (MFE) of local region fold (53 bp around the SNP) of NONHSAT171752.1 from −72.0 (wild type) to −71.1 kcal/mol (mutant type) (|$P=6.8\times {10}^{-2}$|). The A to T allele substitution of rs752806 led the MFE change of NONHSAT230154.1 local region fold (53 bp around the SNP) from −120.9 (wild type) to −120.2 kcal/mol (mutant-type) (|$P=0.186$|).
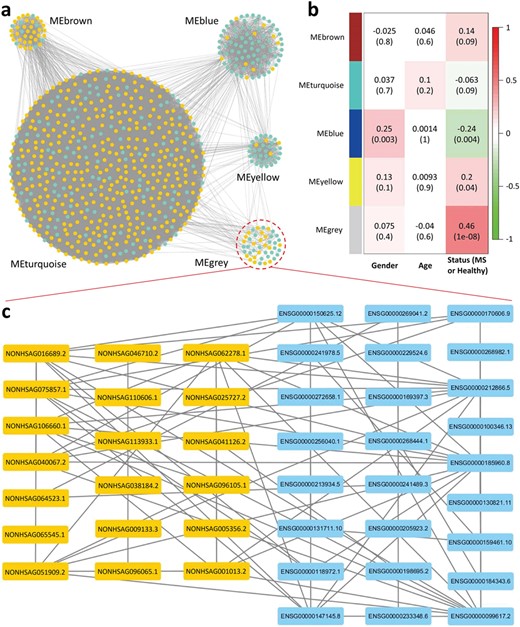
The coexpression network of eQTL lncRNAs and differentially expressed protein-coding genes. (a) Five clustered modules in the coexpression network. The scale of MEturquoise module is significantly increased compared with the others. The yellow and green nodes represent the eQTL lncRNAs and the differentially expressed protein-coding genes, respectively. (b) Heatmap of associations between modules and phenotype (including gender, age and disease status). Each row represents a module, and each cell contains the correlation |$r$| and corresponding P-value (in brackets). The MEblue is associated with gender, and the MEgrey module is most relevant to MS, while there is no module associated with age. (c) Detailed information on the MEgrey.
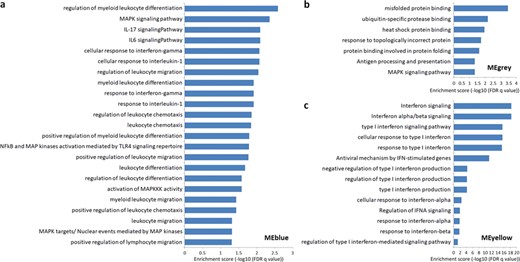
The GO, KEGG, Reactome and NetPath pathway enrichment in the different modules. (a) The enrichment for MEblue. The protein-coding genes coexpressed with the eQTL lncRNAs in this module are mainly related to the leukocyte immune functions, MAPK and IFN. (b) The enrichment for MEgrey. The coexpressed protein-coding genes in this module are mainly related to the folding and binding of the antigen processing and presentation related protein. (c) The enrichment for MEyellow. The coexpressed protein-coding genes in this module are mainly associated with the regulation of IFN. The threshold of significance is set at FDR |$q<0.05$|. More detailed information is presented in Supplementary Table S6.
Inference of the eQTL lncRNA functions by WGCNA
To explore the functions of differentially expressed lncRNAs regulated by cis-eQTL SNPs in MS, we performed WGCNA by integrating the expression data of protein-coding genes and lncRNAs and further conducted GSEA using the protein-coding genes coexpressed with the lncRNAs. First, based on the Ensembl release 91 reference sequences [39], we obtained 324 protein-coding genes significantly differentially expressed between MS and healthy subjects by the approach used to identify the differentially expressed lncRNAs (Supplementary Table S5). Then, combining the TPM values of the 517 eQTL lncRNAs and 324 protein-coding genes, we constructed a coexpression network of these genes using the R package ‘WGCNA’ [56] with the soft threshold power |$\beta =7$| (see Materials and methods for details). Finally, a total 455 lncRNAs and 262 protein-coding genes were included in this coexpression network. As shown in Figure 5a and Supplementary Figure S5, all these lncRNAs and protein-coding genes in the network were clustered into five modules (i.e. MEyellow, MEturquoise, MEgrey, MEblue and MEbrown) according to the interconnectedness of gene pairs. Among these modules, the scale of MEturquoise was significantly increased compared with the others, which included 389 lncRNAs and 123 protein-coding genes (approximately 71.41% of the total). In addition, although the highly interconnected genes existed within a module, some genes in different modules were also linked by the interaction edges, and these edges mainly existed between the MEturquoise and other small modules. Moreover, through the analysis of module significance to the physiological traits (including gender, age and disease status), we found that the MEblue module is associated with both gender and disease status, and MEyellow is associated with disease status (|$P<0.05$|), while there is no module associated with age. The MEgrey module is most relevant to MS (|$r=0.46,\kern0.5em P=1\times {10}^{-8}$|) (Figure 5b), containing 19 lncRNAs and 25 protein-coding genes (Figure 5c).
Pathway and ontology enrichment analysis of the differentially coexpressed lncRNAs
Given the strong interaction between lncRNAs and protein-coding genes within a module, we performed the GSEA of the protein-coding genes in each module to infer the eQTL lncRNA functions in MS by R package ‘clusterProfiler’ [57]. We used four common databases, Kyoto Encyclopedia of Genes and Genomes (KEGG), Gene Ontology (GO), NetPath and Reactome, as the reference. Interestingly, most of the enriched terms are associated with the pathogenesis of MS (the threshold of |$q<0.05$|). Particularly, the protein-coding genes in MEblue are mainly related to the leukocyte immune functions, mitogen-activated protein kinases (MAPK) and interferon (IFN) (Figure 6a and Supplementary Table S6). Previous studies identified the involvement of the human leukocyte antigen (HLA) complex in susceptibility to MS and numerous genomic variants in HLA gene cluster significantly associated with MS [58, 59]. Moreover, a previous study found that some subtypes of HLA occurs more commonly in females than males [60], which may explains the result of WGCNA that the MEblue module is associated with gender. In addition, other studies found that the expression of MAPK is elevated about 5-fold in MS, and the cytokines (e.g. IL-6 and IL-17A) and neuroantigen-specific Th1 and Th17 depend on MAPK to affect the pathological process of MS [61–63]. The protein-coding genes in MEgrey are mainly associated with the folding and binding of the antigen processing and presentation-related protein (e.g. ubiquitin protease and heat shock protein) (Figure 6b). Previous studies showed that ubiquitin protease and heat shock protein participate in the major histocompatibility complex (MHC)-mediated antigen processing and presentation [64–66], and the overexpressed heat shock protein has been discovered to provide a neuroprotection from ischemia-induced cell death in MS [67, 68]. Interestingly, one of our recent studies found that the drug target genes of Alzheimer’s disease are also significantly associated with T-cell antigen presentation via MHC and HLA [69], suggesting a similarity of these CNS disorders and providing new insight into the drug therapy of MS. Moreover, similarly to the MEblue, the enriched terms of MEgrey are also involved in the MAPK signaling pathway. The protein-coding genes in MEyellow are mainly associated with the regulation of IFN (Figure 6c). The previous studies reported that the IFN can reduce the serum concentration of the cytokines (such as IL-17) in MS, and it is widely used for the treatment of MS [70, 71]. The protein-coding genes in MEbrown and MEturquoise are mainly involved in the pathways of systemic arterial blood pressure and cyclic nucleotide, respectively. Given that the MEgrey module is most relevant to MS, we inferred that the dysregulation of lncRNAs caused by the genomic variants mainly influences antigen processing/presentation and MAPK signaling pathway in MS.
Conclusions
In this study, we provided a strategy to obtain simultaneously SNP genotypes and lncRNA expression levels of the same samples by RNA-seq data. A total of 600 872 SNPs are genotyped, and 2383 lncRNAs are significantly differentially expressed between MS and healthy subjects. These differentially expressed lncRNAs mainly consist of the intergenic lncRNAs and are highly specifically expressed in brain tissue. After the eQTL analysis, 1054 cis-eQTL SNPs were identified that significantly affect the expression of 517 differentially expressed lncRNAs. These cis-eQTL SNPs are specifically enriched in the CNS disease-related SNPs (including MS) and the intergenic region compared with the non-eQTL SNPs. In addition, the transcript secondary structure of approximately 17.6% of these lncRNAs is significantly influenced by the cis-eQTL SNPs. Further, WGCNA and GSEA results demonstrated that the dysregulation of lncRNAs caused by the genomic variants mainly influences antigen processing/presentation and MAPK signaling pathway in MS. In summary, our work is the first study to explore dysregulation of lncRNAs induced by genomic variants in MS. The strategy in this study may provide an idea to conduct the lncRNA eQTL analysis of many orphan diseases for which the suitable lncRNA expression and SNP genotype data are difficult to obtain directly from public databases. Further, our findings demonstrated that the influence of genomic variants on lncRNAs is specific and important to the pathogenesis of MS and would benefit MS research in the future. However, the false positive of genotype calling by RNA-seq may still exist and is a general limitation of our study because the existing approaches are imperfect for reducing the false positive. Therefore, it is necessary to develop the effective methods to solve the false positive problem, which can further increase the accuracy of our approach to explore the influence of genomic variants on lncRNAs in the orphan diseases.
Materials and methods
Blood RNA-seq data from 142 individuals
The blood samples of the 142 individuals (including 51 MS patients and 91 healthy controls) were obtained from the VU University Medical Center (VUMC) and the Utrecht Medical Center (UMCU) in Netherlands [37]. The average age of these MS patients and controls are 46.1 and 46.9 years, respectively. The sex ratios (male to female) in the two groups are 0.34 and 0.52, respectively. Then, total RNA of the samples was extracted using the mirVana miRNA isolation kit and further subjected to the cDNA synthesis and SMARTer amplification. Subsequently, the Truseq Nano DNA Sample Preparation Kit was used to prepare the sequencing libraries, and pooled sample library sequencing was performed by the Illumina Hiseq 2500 platform. Finally, RNA read quality control was conducted using Bioanalyzer 2100 with RNA 6000 Picochip, DNA High Sensitivity chips measurements and Trimmomatic [37]. We downloaded these sequence data from the NCBI Sequence Read Archive (SRA) database (SRA project accession number: SRP093349; BioProject: PRJNA353588; GEO: GSE89843) and converted them into FASTQ files using the SRA Toolkit software.
Quantification of transcript abundance and differential expression analysis
The reference sequences of lncRNAs were downloaded in FASTA format from NONCODE database (version 5). NONCODE is a systematic database dedicated to noncoding RNAs and presents the most complete collection and annotation of these RNAs, including 172 216 transcript sequences of 96 308 human lncRNA genes [38]. Similarly, the reference sequences of protein-coding genes were obtained in FASTA format from Ensembl release 91 (December 2017) [39]. Ensembl is a database and genome browser that aggregates, integrates and annotates the large-scale genome reference data from Genome Reference Consortium [72], UCSC Genome Browser [73], UniProt [74] and NCBI [75]. After removing pseudogene transcripts, we obtained a total of 160 040 transcript sequences from 22 810 human protein-coding genes. Next, we merged the two FASTA format files of lncRNAs and protein-coding genes reference sequences. Then, quantification of the lncRNA and protein-coding transcripts was performed simultaneously by mapping the RNA-seq reads to the merged reference sequences and calculating the TPM values using the Kallisto software, which is a fast and highly accurate tool to quantify transcript abundance from large-scale RNA-seq data using a k-mer lookup (instead of the traditional alignment step) [40]. The recommended parameters were used in this study according to the manual of Kallisto, i.e. the estimated average fragment length (−l) and SD of fragment length (−s) were set to 200 and 20, respectively. Subsequently, a previous study demonstrated that the quantification results of the integrated gene-level abundance are more accurate and interpretable compared with transcript-level results [41]. Therefore, we further used the R package ‘tximport’ with the default parameter settings (type = kallisto, ignoreAfterBar = TRUE) [41] to calculate the gene-level TPM values of lncRNAs and protein-coding genes by integrating their corresponding transcript-level TPM values according to the annotation files (correspondence between genes and transcripts) from NONCODE and Ensembl, respectively. Finally, the differential expressed lncRNAs and protein-coding genes between MS and healthy subjects were identified according to the common threshold of |$FC$||$\ge 1.5$| and |$P<0.05$| using the R package ‘DESeq’ with the default parameter settings (the functions in this package use the last variable in the formula for building results). We used the parameters, gender and age of each sample, as the covariates for the differential expression analysis. DESeq is a reliable differential expression analysis tool for the sequence count data based on a negative binomial distribution [42]. The P-values are corrected for multiple testing by Benjamini–Hochberg method.
SNP genotyping and annotation
RNA-seq data of all the individuals were used to genotype the SNPs on a whole-genome scale. First, the Sequence Alignment/Map (SAM) files of each sample were generated by aligning the sequenced short reads to the human reference genome (hg19) using BWA software with the default parameter settings (bwa aln hg19.fa) [43]. Second, we used the SAMtools software to convert the SAM files to the sorted Binary Alignment/Map (BAM) files, which are the SAM’s binary representation [44], and further used the BAM files to perform variant calling on these aligned reads using the BCFtools software with default parameter settings (bcftools view -vcg -D100) [45]. The results were stored in the VCF file. Third, the previous studies reported that increasing read depth can effectively reduce the false positive in SNP calling when using the RNA-Seq approach. Particularly, they found that at >10 × coverage, the false positive rate of the RNA-seq SNP calling is less than 15% [76, 77]. So, the quality control was performed according to the following criteria: the sub-fields of INFO in VCF file DP |$\ge 10,$| RMS mapping quality|$\ge 10$|, MAF |$\ge 1$|% and P-value of HWE |$\ge 5\times {10}^{-5}$|. HWE test was performed by R package ‘Genetics’ that is based on a noncontinuity correction chi-squared approach with 10 000 simulation iterations in each locus. After filtering the low-quality results, we obtained 867 961 genotyped variants.
The previous studies demonstrated that removing the results that are not catalogued in dbSNP can effectively reduce the false positive of SNP calling [78–81]. Cirulli et al. [79] found that the percent of the true positive cDNA SNVs corresponded to a dbSNP entry (about 94%) is far more than the percent of false positives (about 23%). Further, we used the annotation databases, refGene and snp138 (hg19), to annotate these genotyped variants using ANNOVAR software, which is a Perl command-line tool for rapidly and efficiently annotating the genomic variants from high-throughput sequencing data (e.g. VCF file) [46]. Particularly, the information of functional annotation was stored in the refGene database (hg19) [82]. According to the information, the variants were categorized into the following classes: intergenic, intronic, exonic, ncRNA intronic, ncRNA exonic, 5′/3′-UTR, upstream/downstream and splicing site. The snp138 (hg19) provided information about SNP genomic position and the corresponding ID based on the dbSNP database (version 138) [83]. After the annotation by snp138, we removed 247 622 unqualified results that are not catalogued in dbSNP and obtained a total of 19 467 indels and 600 872 genotyped SNPs with the corresponding ID (e.g. rs375781).
Identification of the lncRNA cis-eQTL SNPs
We considered all the lncRNA and SNP pairs if the distance between them is less than 100 kb for the eQTL analysis because previous studies reported that the process of gene transcription is mainly affected by the SNPs located within 100 kb around the corresponding genes [49, 50]. For this purpose, we first removed 308 unsuitable lncRNAs, which have no annotation about the location in genome according to the NONCODE, from all the 2383 differentially expressed lncRNAs. Then, we compared the genomic locations of all the 620 339 genotyped variants and the remaining 2075 lncRNAs (hg19) and selected 178 451 variants located within 100 kb around the lncRNAs. Subsequently, we used the TPM values of the 2075 lncRNAs in combination with the genotype data of the 178 451 variants to perform the eQTL analysis by the R package ‘Matrix eQTL’, which is based on a linear regression model [47]. Based on the expression data of the lncRNAs, we applied the Bayesian regression and factor analysis modules to perform the PEER analysis by the R package ‘PEER’ [48]. Finally, we obtained three PEER factors for each of the individuals and added them to the covariates of the eQTL analysis. All the individuals in our study are form Amsterdam (VUMC) and Utrecht (UMCU) of Netherlands. Therefore, we account for the population stratification based on the two geographic ethnicities and the information to the covariates of the eQTL analysis. We used the parameters, age, gender, three PEER factors and population stratification, as the covariates for the eQTL analysis to control for potential confounding factors. The threshold of significance was set at |$\kern0.5em P<0.05$|.
To find genetic variants that are specific to MS individuals, we added the interaction terms in our eQTL analysis model by the ‘lm’ function in R. Particularly, we first coded the ‘disease states’ factor with values 1 and 0 for MS and health. Then, we fitted the function that includes the lncRNA expression levels as dependent variable, ‘variant genotype’ and ‘disease states’ factor as independent variables and a ‘variant genotype’ × ‘disease states’ interaction term by the ‘lm’ function in R. Further, we performed a permutation procedure to further correct for multiple variants testing per gene expression according to the previous studies [29, 51]. Briefly, we calculated the permuted P-values by randomizing the sample labels (including PEER factors, population stratification, age and gender covariates) of each lncRNA expression data, while holding fixed the genotype data of the corresponding variants. The permutations are from a minimum of 1000 to a maximum of 10 000 and exited when at least 15 permuted P-values less than the nominal P-values. Then, the FDR were calculated to perform the multiple testing corrections using the Storey approach (the threshold of q-value < 0.05). Finally, we removed the lncRNAs whose expression level affected by indels and selected the cis-eQTL SNPs and corresponding lncRNAs.
Production of independent cis- and non-eQTL SNPs as well as disease-related SNPs
We first selected the SNPs with eQTL |$\kern0.5em P>0.5$|, which are unlikely to be associated with lncRNA expression, from all the 178 451 variants located within 100 kb around the lncRNAs and defined them as the non-eQTL SNPs. Then, we compared the MAF and distance from the TSS between non-eQTL and cis-eQTL SNPs data sets and extracted the 87 618 non-eQTLs with the MAF and distance from the TSS matched to the cis-eQTL data set. Then, to generate a set of the cis-eQTL SNPs that affect the expression of the lncRNAs independently of each other, we used the HaploReg (version 4) to remove the SNPs in strong LD with each other (|${r}^2>0.5$|) from all the 1054 lncRNA cis-eQTL SNPs. HaploReg is an LD information discovery tool for variants from the four ancestral super-populations, i.e. African, American, Asian and European ancestry, based on the 1000 Genomes Project Phase 1 release [52, 53]. We selected the European reference data set for this LD analysis to be consistent with the ethnicity of the samples in this study. Finally, according to the same procedure used for generating the independent cis-eQTL SNPs, we performed the LD analysis to obtain the independent non-eQTL SNPs.
To generate the disease-related SNPs, we first downloaded the tag SNPs data from the GWASdb (version 2) database [54]. The GWASdb database provides comprehensive information about genomic variants associated with human traits and diseases, and the association of these variants with corresponding phenotypes was limited to GWAS |$\kern0.5em P<1.0\times {10}^{-5}$|. Then, a previous study reported that the variants in LD with tag SNPs are potentially associated with the corresponding diseases [52]. Therefore, to ensure completeness of the data, we extended the tag SNPs based on their LD information according to the previous study [50]. Briefly, the HaploReg was used to select the SNPs in strong LD with the tag SNPs based on the European data set of the 1000 Genomes Project Phase 1 release, and these tag SNPs and SNPs in LD were collectively defined as disease-related SNPs. Finally, we selected four CNS diseases, i.e. MS (tag SNPs |$N=913$|), Alzheimer’s disease (|$N=7717$|), Parkinson’s disease (|$N=2294$|) and schizophrenia (|$N=2537$|) and five nonneurological diseases, i.e. type 2 diabetes (|$N=13\ 982\Big)$|, rheumatoid arthritis (|$N=2495$|), prostate cancer (|$N=1710$|), lung adenocarcinoma (|$N=522$|) and coronary artery disease (|$N=1176$|), whose disease-related SNPs are overlapped with the cis-eQTL and non-eQTL SNPs.
The influence of lncRNA secondary structure by cis-eQTL SNPs
To assess whether the lncRNA secondary structure can be affected by the corresponding cis-eQTL SNPs, we first mapped the location of all the cis-eQTL SNPs to the regulated lncRNAs according to annotation information of the NONCODE BED format files [38] and dbSNP snp138 (hg19) [83]. Then, we selected the cis-eQTL SNPs located within the lncRNAs and the corresponding lncRNA transcript sequences from the NONCODE FASTA files [38]. Finally, combining the alleles of the selected cis-eQTL SNPs and the lncRNA transcript sequences, we performed lncRNA secondary structure analysis using RNAsnp software [55]. RNAsnp uses the Boltzmann ensemble to assess the maximal structural change between mutant and wild-type RNAs, which makes it more stable and reliable than traditional methods [55]. Particularly, mode 1 of RNAsnp used a global folding method to calculate the impact of SNPs on the Boltzmann ensemble of secondary structure for short (|$<1000\ nt$|) RNAs, whereas mode 2 used the local-folding approach with the default parameters (−W 200 and −L 120) to calculate this impact for large (|$>1000\ nt$|) RNAs [55]. Therefore, we used modes 1 and 2 of the RNAsnp to assess the effect of the cis-eQTL SNPs on the lncRNA transcript sequences |$<1000\ nt$| and |$>1000\ nt$|, respectively. According to the manual and the original article of RNAsnp, if the P-value is less than 0.2, this means that a significant RNA secondary structural change is caused by the corresponding SNPs [55]. So, the threshold of significance was set at |$\kern0.5em P<0.2$|.
WGCNA and GSEA
We performed WGCNA to construct a coexpression network of the eQTL lncRNAs and differentially expressed protein-coding genes. Based on the TPM values of the lncRNAs and protein-coding genes, we first conducted a sample clustering for the quality control using the ‘hclust’ function of R package ‘WGCNA’ [56] and removed four outlier samples (GSM2390870, GSM2390800, GSM2390738 and GSM2390848) (Supplementary Figure S3). Then, we chose the satisfactory soft threshold power |$\beta$| to ensure that the coexpression network follows scale-free topology criterion using the ‘pickSoftThreshold’ function of R package ‘WGCNA’. When the |$\kern0.5em \beta \kern0.5em$| value equals seven, the model fitting index R-squared reaches 0.87 for the first time, and simultaneously the mean connectivity approaches zero [56] (Supplementary Figure S4). Further, to identify the coexpression modules where genes have high topological overlap with each other, we calculated the weighted correlation of gene pairs using Pearson’s method with the parameter |$\beta =7$| to generate an adjacency matrix and used it to construct the hierarchical clustering dendrogram using a dynamic cut-tree algorithm [56] (Supplementary Figure S5). The visualization of these modules in the coexpression network was realized by Cytoscape software [84]. Finally, we measured the average correlation of the genes in each module with the disease states (MS or healthy), gender (male or female) and age of the 138 individuals to assess the module significance by the functions ‘moduleEigengenes’, ‘cor’ and ‘corPvalueStudent’ in R package ‘WGCNA’ [56].
To investigate the functions of the eQTL lncRNAs in MS, we further used the protein-encoding genes coexpressed with these lncRNAs in each module to perform the GSEA. The data of two common signaling pathway databases (KEGG [85] and NetPath [86]) and two ontology-based databases (GO [87] and Reactome [88]) were first downloaded for the GSEA. Particularly, KEGG provided information about human disease, organism system, cellular processes and signaling pathways [85]. NetPath is a public resource of curated human signal transduction pathways [86]. GO is an ontology database of genes organized by biological process, molecular function and cellular component [87]. Reactome offers the molecular details of signal transduction, transport, metabolism and other cellular processes [88]. Then, we used the R package ‘clusterProfiler’ [57] to conduct the GSEA of each module in the four reference databases. The threshold of significance was set at |$q<0.05$|.
This study provided a strategy to identify lncRNA eQTLs in MS only based on RNA-seq data.
We observed a specific expression of the eQTL lncRNAs in brain-related tissues and a significant enrichment of the cis-eQTL SNPs among neurological disease-associated loci (including MS).
We also found that the cis-eQTL SNPs are substantially and specifically enriched in intergenic regions, which is consistent with distribution of the eQTL lncRNAs types in MS.
We demonstrated that the dysregulation of lncRNAs induced by genomic variants mainly influences antigen processing/presentation and MAPK signaling pathway in MS.
Funding
National Natural Science Foundation of China (81872798), National Key Research and Development Program of China (2018YFC0910500), Innovation Project on Industrial Generic Key Technologies of Chongqing (cstc2015zdcy-ztzx120003) and Fundamental Research Funds for Central Universities (2018QNA7023, 10611CDJXZ238826, 2018CDQYSG0007, CDJZR14468801, CDJKXB14011).
Zhijie Han is PhD candidate of the College of Pharmaceutical Sciences at Zhejiang University, China and jointly cultivated by the School of Pharmaceutical Sciences in Chongqing University, China. He is interested in the area of bioinformatics.
Yan Lou is a professor of the First Affiliated Hospital at Zhejiang University, China. She is interested in the area of clinical pharmacology, precision medicine and bioinformatics.
Yunqing Qiu is a professor of the First Affiliated Hospital at Zhejiang University, China. He is interested in the area of precision medicine, diagnosis and treatment of liver disease and system biology.
Feng Zhu is a professor of the College of Pharmaceutical Sciences at Zhejiang University, China. His research lab (https://idrblab.org/) has been working in the fields of bioinformatics, OMIC-based drug discovery, system biology and medicinal chemistry. All are welcome to visit his personal website at: https://idrblab.org/Peoples.php.
