


Abstract
Peripheral blood gene expression intensity-based methods for distinguishing healthy individuals from cancer patients are limited by sensitivity to batch effects and data normalization and variability between expression profiling assays. To improve the robustness and precision of blood gene expression-based tumour detection, it is necessary to perform molecular diagnostic tests using a more stable approach. Taking breast cancer as an example, we propose a machine learning–based framework that distinguishes breast cancer patients from healthy subjects by pairwise rank transformation of gene expression intensity in each sample. We showed the diagnostic potential of the method by performing RNA-seq for 37 peripheral blood samples from breast cancer patients and by collecting RNA-seq data from healthy donors in Genotype-Tissue Expression project and microarray mRNA expression datasets in Gene Expression Omnibus. The framework was insensitive to experimental batch effects and data normalization, and it can be simultaneously applied to new sample prediction.
Introduction
Breast cancer is typically diagnosed based on clinical features, medical imaging, biochemical tests, the pathological examination of clinical samples and molecular diagnostic tests. Early detection of breast cancer is critical for achieving good survival rates, with mammographic screening being the most reliable method. However, mammography is often ineffective when the tumour size is small or when breast tissue is dense. To overcome these limitations, several peripheral blood-derived materials are increasingly being used for liquid biopsies, including circulating DNA [1–4], circulating tumour cells (CTCs) [5] and exosomes [6, 7]. These materials—which can be obtained non-invasively—nonetheless have shortcomings, such as the heterogeneity of the CTC population and the inability to specifically isolate circulating tumour DNA [8]. Thus, more sensitive and specific analytical methods are needed to effectively detect trace amounts of these materials.
Plasma [9] and peripheral blood cell (PBC) gene expression profiling has been used to detect markers related to disease [10, 11] and drug response [12]. Cancer is a systemic disease associated with the perturbation of blood homeostasis resulting in detectable alterations in gene expression in erythrocytes [13], circulating leukocytes [14, 15] and tumour-educated platelets [16] that have potential applicability to cancer diagnostics. Previous studies have compared gene expression profiles in blood cells from cancer patients and healthy controls either by the direct detection of differentially expressed genes or by a machine learning approach, such as the support vector machine (SVM). However, current normalization approaches have limited capacity for batch-effect correction and may even distort biological signals [17, 18]. Therefore, signature genes or models established in a specific study cannot be directly transferred to other datasets, which hinders the applicability of public data as well as model cross-validation. To overcome this problem, the use of gene expression order has been proposed as an alternative to signal intensity since it is more stable against outliers, batch effects and different normalization algorithms [19–21] for tissue in a particular state. Given its superiority to absolute quantification methods, we propose a rank-based machine learning method to distinguish breast cancer and healthy donor blood samples and to investigate its potential for blood-based companion diagnostics (Figure 1).
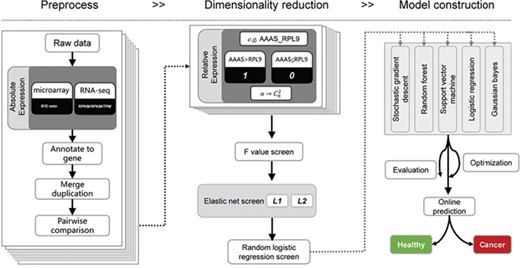
Schematic overview of the relative expression-based model for liquid biopsies. First, expression intensity from either microarray or RNA-seq is pre-processed for pairwise comparison between any of the two genes. Then, the relative expression value (0/1) is recorded as new variables are presented for dimensionality reduction. Lastly, a prediction model was constructed based on relative expression value.
Methods
Sample collection
Peripheral blood samples were obtained from 37 women with breast cancer. Before blood sampling, signed consent forms were obtained from all participants and the protocol of the study was approved by the ethics committee of the Affiliated Hospital, Academy of Military Medical Sciences. For each case, 5 ml of peripheral blood was collected into a QIAGEN PAXgeneTM blood RNA tube and immediately stored at −80°C. RNA was extracted with a QIAGEN PAXgene Blood RNA Kit using standard operating procedures.
Whole transcriptome sequencing and analysis
After total RNA extraction, mRNA libraries were constructed using the Illumina mRNA-Seq library preparation kit according to the manufacturer's protocol and 2 × 150 bp paired-end runs were performed on a Novaseq System. Sequencing quality analysis of the raw data was performed using FASTQC software (http://www.bioinformatics.babraham.ac.uk/projects/fastqc). The human GRCh37 reference genome was downloaded from iGenome (http://ccb.jhu.edu/software/tophat/igenomes.shtml), and the associated .GTF files were downloaded from the Ensembl website (http://asia.ensembl.org/index.html). Reads were then aligned to the reference genome using HISAT2 with default parameters, and the aligned reads were assembled and quantified by StringTie software [22]. The gene expression was represented by the fragments per kilobase of exon model per million mapped reads value of each sample. The RNA-seq raw data are deposited in the Genome Sequence Archive [8] with accession number PRJCA001108 (private link for review: http://bigd.big.ac.cn/gsa/s/qYELd91n).
Data and pre-processing
Multiple gene expression datasets generated from the ABI (ABI Human Genome Survey Microarray v.2) and Affymetrix (Affymetrix Human Exon 1.0 ST Array) platforms, Illumina HiSeq 2500 and Broad Institute Human L1000 epsilon were downloaded from Gene Expression Omnibus (GEO) [23] (Table 1). For microarray data, we used processed data from GEO. For RNA-seq data, GSE68086 read counts were normalized to reads per kilobase of transcript per million mapped reads (RPKM) values and GSE92743 RPKM values were downloaded from the GTEx website.
Data from cancer patients and healthy subjects used in this study
| GEO accession no. | Number of healthy subjects | Number of cancer patients | Platform | Source |
|---|---|---|---|---|
| GSE16443 | 63 | 67 | ABI Human Genome Survey Microarray v. 2 | Peripheral blood cells |
| GSE47862 | 163 | 158 | Affymetrix Human Exon 1.0 ST Array | Peripheral blood cells |
| GSE11545 | 9 | 11 | ABI Human Genome Survey Microarray v. 2 | Peripheral blood cells |
| GSE92743 | 137 | RNA-seq (Broad Institute Human L1000 epsilon) | Peripheral blood cells | |
| PRJCA001108 | 0 | 37 | RNA-seq (Illumina Novaseq) | Peripheral blood cells |
| GSE68086 | 54 | 40 | RNA-seq (Illumina HiSeq 2500) | Platelets |
Transformation of gene expression intensity to rank information
where n is the total number of genes expressed in a sample.
Dimension reduction
Feature selection techniques do not alter the original representation of the variables but merely select an optimal subset of them. Pruning irrelevant and redundant features can improve the learning efficiency and avoid the curse of dimensionality.
Model selection
Rank-based features were input to predict the status of cases whose value was 1 (cancer) or 0 (healthy). We used stochastic gradient descent (SGD), random forest (RF), SVM, logistic regression (LR) and Gaussian Naive Bayes algorithms in the scikit-learn package (0.18.1) to construct classifiers; GridSearchCV package to adjust the hyper-parameters; and 10-fold cross-validation to construct models.
Performance evaluation
Results
The schematic of breast cancer liquid biopsies using PBC gene expression data
We first used two types of single datasets (GSE68086 and GSE16443, which are RNA-seq and microarray data, respectively) to evaluate whether the rank-based model has the power to distinguish cancer and healthy subjects. Then, we validated the strategy on intra- and inter-platform datasets. Finally, we integrated much more microarray data in the model construction process and tested the applicability of the model in both microarray and RNA-seq data. For the validation process, we performed peripheral blood RNA-seq for 37 breast cancer patients and collected other public data (normal peripheral blood RNA-seq data from GTEx, normal and cancer peripheral blood microarray data from GSE11545 and GSE47862) (Figure 2).
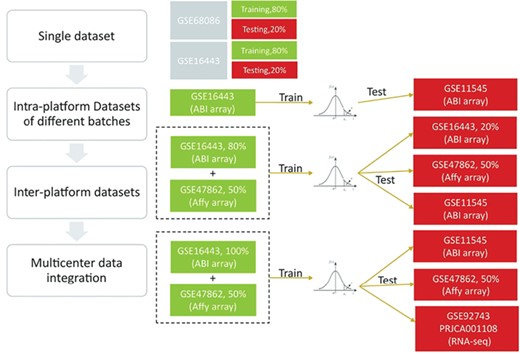
Overview of the study design. We first used single datasets to confirm that a rank-based model has the power to distinguish cancer and healthy subjects. Then, we validated the strategy on intra- and inter-platform datasets. Finally, we concluded that the prediction performance was improved by including independent datasets and that a microarray-originated model can be applicable for RNA-seq data.
Rank-based features do not reduce the classification power of cancer patients versus healthy control subjects
To facilitate the comparison of datasets from different platforms and/or batches, we transformed gene expression intensities to relative information according to any two of the expressed genes. Since there was undoubtedly some information loss during the transformation, we selected two datasets to test the classification power of the transformed data, including gene expression profiles from PBCs in healthy donors and breast cancer patients detected by microarray (GSE16443) and platelet cell expression profiles from breast cancer patients and healthy subjects detected by RNA-seq (GSE68086). For each dataset, 80% of samples were used for training and the remaining 20% were used for validation. After transforming the expression intensity of microarray data to pairwise gene order information, we obtained 22 885 995 features, of which 6 were retained after a three-step feature reduction approach. For RNA-seq data, we selected genes with RPKM > 1 in more than 95% of the samples. The RPKM value was then transformed to obtain pairwise gene order information. After the transformation, there were 1 103 355 features; among them, 16 were retained after a three-step feature reduction. A comparison of different models showed that the RF model had better predictive power in these two datasets (Supplementary Figure S1). The model distinguished cancer and healthy samples with an accuracy of 80.77% and 94.74% in GSE16443 and GSE68086, respectively (Figure 3A and C). The AUC reached 0.87 and 0.97 (Figure 2B and D), which is better than the intensity-based classification method [16, 24] and is significantly higher than the value for the randomly selected 6 and 16 features (Supplementary Figure S2). The performance of the prediction models remains stable when changing the rank-based features (Supplementary Figure S3). We also tried to use fold change (FC) to describe the difference between genes, and we found that the FC follows an approximate negative binomial distribution in RNA-seq and a normal distribution in microarray data (Supplementary Figure S4), which is not suited for integration and training.
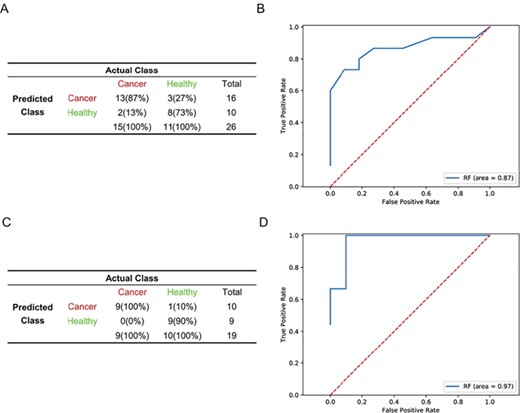
Prediction of performance of the rank-based model in GSE16443 and GSE68086 datasets. (A, C) Confusion matrices of diagnostics of healthy donors (healthy) and breast cancer patients (cancer) from GSE16443 (A) and GSE68086 (C). (B, D) Receiver Operating Characteristic (ROC) curves of RF diagnostics of healthy donors and breast cancer patients from GSE16443 (B) and GSE68086 (D).
Performance of the model in cross-validations between intra-platform datasets from different batches
To test whether the rank-based model was sensitive to differences in laboratory conditions, reagent lots and personnel, we used the GSE16443 dataset as a training cohort (n = 130) and GSE11545 as an independent validation cohort. A total of 138 features were selected after a three-step dimension reduction. The LR and SVM model produced the same performance. Both of them outperformed the RF, linear classifiers with SGD training, Gaussian Naive Bayes models, and they completely discriminated cancer from healthy samples. They performed well when applied to an independent validation cohort (GSE11545), with a sensitivity of 81.82%, specificity of 66.67%, accuracy of 75.00% (Figure 4A) and an AUC of 0.80 (Figure 4B). To test whether there are batch effects between these two datasets, we randomly selected normal and cancer samples from them, normalized them using z-scores and performed correlation analysis. The result showed that the expression consistency between the two datasets was very poor (Supplementary Figure S5). Furthermore, we compared the performance of our method with two most frequently used rank-based methods, the top scoring pair (TSP) [20] and k-top scoring pairs (k-TSP) [21], in selecting top gene pairs and distinguishing cancer and healthy subject in an independent study. We used the GSE16443 data as a training cohort to build classifiers and GSE11545 data as an independent validation cohort. The optimal value of k was determined by a 5-fold cross-validation, representing five pairs of genes achieving top scores. Two of the five gene pairs were surrogated with median value due to LRRC37B and SRSF2 were not detected in the GSE11545 data. However, k-TSP–based model showed poor performance in predicting GSE11545 subjects, with a sensitivity of 100% and a specificity of 0%. When k = 1, the k-TSP algorithm is referred simply as TSP. We got the same performance as k-TSP when used anyone of the three gene pairs to validate the model in the GSE11545 data. To look into the gene pairs in detail, we found that the expression of ACBD6 is higher than RPL37, MARS is higher than NGLY1 and NGLY1 is higher than GMFG in healthy subjects in training cohort (GSE16443) (Supplementary Figure S6A, C and E); however, the tendency did not exist in the validation cohort (GSE11545) (Supplementary Figure S6B, D and F).
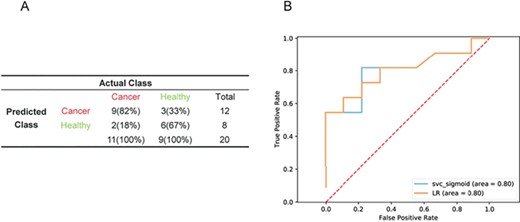
Performance of the LR and SVM models in datasets from different batches. Performance of the models in the validation cohort in GSE11545 data (n = 20). (A) ROC curves of LR and SVM diagnostics of the validation cohort in GSE11545 data (B).
Performance of the model in cross-validations between inter-platform datasets
To determine whether the rank-based model could be used to predict datasets from different expression quantification platforms, we combined datasets from ABI Human Genome Survey Microarray v.2 (GSE16443) and Affymetrix Human Exon 1.0 ST Array (GSE47862). To equalize sample numbers across platforms, we randomly selected 50% (n = 160) of GSE47862 samples and 80% (n = 104) of GSE16443 samples as the training set, with the remaining samples and an independent dataset from ABI microarray platform (GSE11545) constituting the validation set. A total of 108 features were retained after the dimension-reduction step. The SVM model outperformed the others based on the training set. Validation was subsequently performed with independent validation cohorts that were not involved in feature selection or model training. In GSE16443 (n = 26 samples), sensitivity, specificity and accuracy were 80.00%, 81.82% and 80.77%, respectively (Figure 5A), with an AUC of 0.88 (Figure 5B), which is better than the model from the single ABI microarray platform (Figure 3A and B). In GSE47862 (n = 161 samples), sensitivity, specificity and accuracy were 70.59%, 80.26% and 75.16%, respectively (Figure 5C), with an AUC of 0.84 (Figure 5D). In contrast, random classifiers generated from multiple rounds of random selection of gene pairs during the SVM training process had no predictive power. In GSE11545 (n = 20 samples), sensitivity, specificity and accuracy were 81.82%, 77.78% and 80.00%, respectively (Figure 5E), with an AUC of 0.84 (Figure 5F).
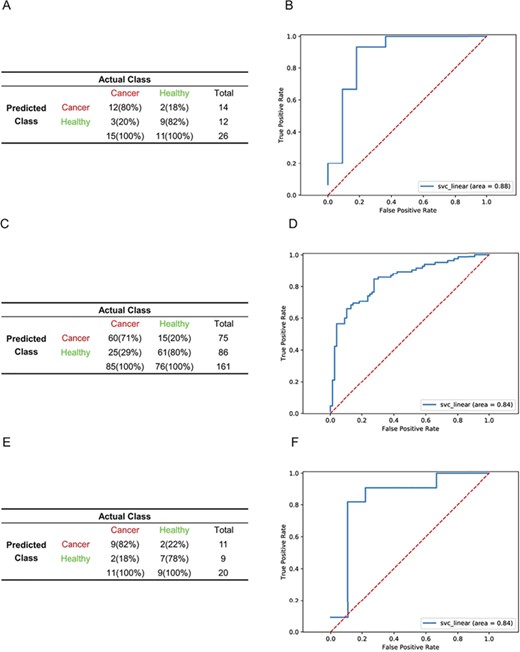
Performance of the SVM model in datasets from different platforms. (A, C, E). Performance of the SVM model in the validation cohort in GSE16443 (n = 26) (A), GSE47862 (n = 161) (C) and GSE11545(n = 20) (E) data. ROC curves of SVM diagnostics of the validation cohort in GSE16443 (B), GSE47862 (D) and GSE11545 (F) data.
Improvement in the predictive performance of the model by integrating multicentre data
We integrated a larger number of PBC gene expression datasets from different platforms to assess whether the algorithm could improve the predictive performance of an independent dataset in cancer detection. Due to the differences in sample size between ABI Human Genome Survey Microarray and Affymetrix Human Exon Array training sets, we selected 100% of GSE16443 samples (n = 130) and 50% of GSE47862 samples (n = 160) to avoid bias introduced by platforms. A total of 52 features (Supplementary Table S1) were selected after a three-step dimension reduction. The RF model outperformed other algorithms. The model performed well when applied to an independent validation cohort (GSE11545) with a sensitivity of 90.91%, specificity of 100%, accuracy of 95% (Figure 6A) and AUC of 0.93 (Figure 6B), which is better than a model trained with less data in Figure 4 and 5. In the remaining 50% of GSE47862 (n = 161), sensitivity, specificity and accuracy were 76.47%, 80.26% and 78.26%, respectively (Figure 6C), with an AUC of 0.84 (Figure 6D).
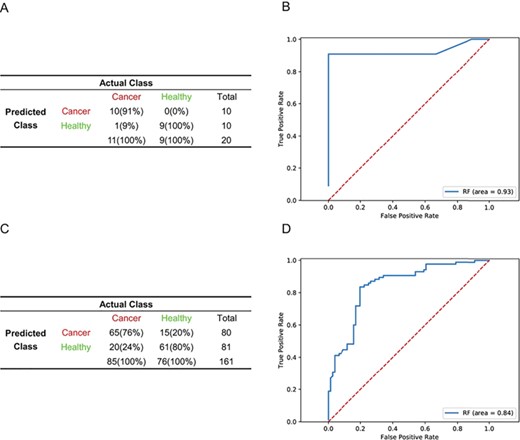
More samples from multicentre data from different platforms improve the detection of cancer samples. (A, C) Confusion matrices of the RF model generated from GSE16443 (100%) and GSE47862 (50%) integrated data in an independent validation cohort in GSE11545 data (A) and the remaining 50% of the GSE47862 (n = 161) data. (C) ROC curves of RF diagnostics of an independent validation cohort in GSE11545 data (n = 20) (B) and the remaining 50% of the GSE47862 data (D).
Application of the model generated from multiple microarray platforms to RNA-seq samples
To further test the generalizability of the model generated from ABI Human Genome Survey Microarray and Affymetrix Human Exon Array expression data, we applied the RF model to RNA-seq data. From the GTEx project, we selected the whole blood expression dataset from females whose RNA samples were prepared with a PAXgene kit and obtained 137 healthy samples. For the breast cancer samples, we performed RNA-seq for peripheral blood from 37 patients. In the validation process, we used mode to represent the value of LOC100128076_MT1X because it neither exists in GTEx nor our RNA-seq data. In the combined RNA-seq data, sensitivity, specificity and accuracy were 83.78%, 67.15% and 70.69% (Figure 7A), respectively, with an AUC of 0.80 (Figure 7B).
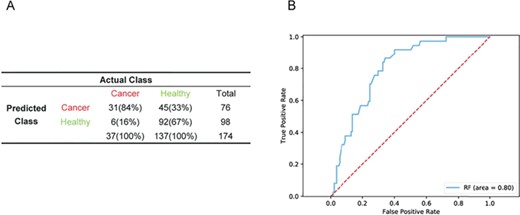
Performance of the RF model generated from multiple microarray platforms in RNA-seq samples. Performance of the RF model in a validation cohort of combined RNA-seq data (n = 174) (A) and ROC curves of RF diagnostics of the validation cohort in combined RNA-seq data (B).
Detection of prognostic markers in tumour tissue based on surrogate blood mRNA profiles
For the 52 gene pairs (92 unique genes) identified with the RF model, we obtained the expression profiles of individual genes from The Cancer Genome Atlas (TCGA) breast cancer tissue samples (1091 cases). A multivariate analysis showed that 18 gene pairs were significantly associated with breast cancer patient survival (Figure 8). We randomly selected 92 genes and generated 52 gene pairs, and we repeated the process 60 times and found that the number of gene pairs that was significantly associated with patient survival approximately followed the Poisson distribution (λ = 2), and the probability is <<0.001 for k ≥ 18.
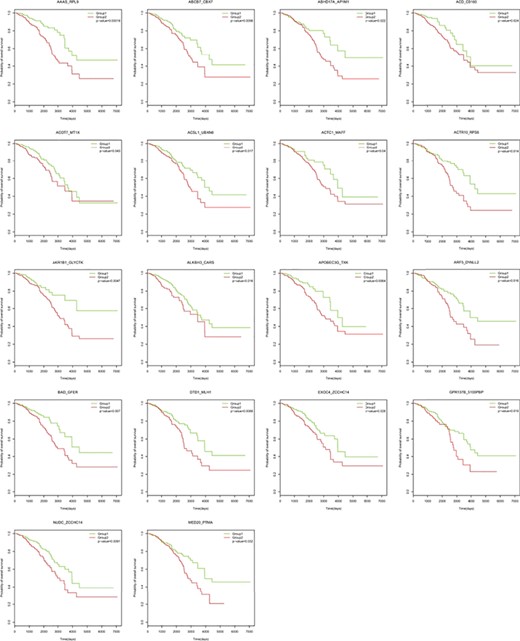
Kaplan–Meier overall survival analysis of breast cancer based on gene pairs using mRNA signatures from TCGA.
Web service implementation
To facilitate the implementation of the prediction model, we constructed a web interface that can be accessed at http://bigd.big.ac.cn/rankDetect. Users can simply upload their expression matrix file, and the server will give the predicted status (healthy/cancer) of each sample. In addition, we hope the users will help refine the model by submitting the actual labels (if known) of their samples on the results page.
Discussion
Blood-based liquid biopsies are a non-invasive and accessible method for cancer diagnosis, therapeutic decision-making, prognostic determination and monitoring of clinical progression and treatment response [25, 26]. To date, there are no expression-based methods that can extract multicentre data for cancer diagnostics [27, 28], hindering early cancer detection. In this study, we propose a machine learning–based method that distinguishes breast cancer patients from healthy individuals based on pairwise rank transformation of gene expression intensity in each sample. The rank-based self-learning model can offer valuable information for breast cancer diagnosis and is insensitive to batch effects and data normalization. Our results suggest that a relative ordering-based method can make direct use of microarray data from different sources, thereby expediting research on human diseases. Furthermore, the model trained from microarray data can also be applied to RNA-seq data, highlighting the clinical relevance of relative gene expression levels in blood.
Gene regulatory networks—and consequently, gene expression profiles [19]—differ between normal and disease states [29]. Cancer can alter the gene expression in blood. PBCs comprise erythrocyte, white blood cell and platelet populations that are dynamic throughout cancer initiation and progression [30]. Gene expression changes in circulating leukocytes can serve as an indicator of infection or diseases such as cancer [9]. Additionally, the number of monocytes with a typical myeloid-derived suppressor cell surface phenotype was increased during breast cancer progression and was correlated with metastasis to lymph nodes and visceral organs [31]. A blood transcriptome-based diagnosis may also be applicable to different species. One study established a classifier from genes identified as differentially expressed in mouse PBCs that showed good accuracy and high stability when applied to human breast tumour prediction based on gene expression in peripheral blood mononuclear cells [32].
We propose a human breast cancer predictor based on PBC mRNA signatures. Our approach overcomes many of the constraints of previous models by using the relative expression orders of genes to reduce noise and to identify genes associated with breast cancer over other potentially confounding factors. By integrating datasets from different platforms and/or batches, we identified 52 stable gene pairs that could be important markers representing different patterns between breast cancer patients and health controls. In addition, based on these markers, a refined model was constructed, which was applicable in both sequencing and microarray platforms. However, the results presented here have limited application in clinical settings for various reasons. First, the model with the best predictive power is not definitive; we cannot exclude the possibility that a sufficient number of expression datasets can lead to the generation of a convergent model. Second, due to the scarcity of expression data from cancer blood samples, our analysis used only microarray data for model training, although the model from microarray data also performed well in normal blood RNA-seq data. These results serve as a proof-of-concept for using a rank-based model to develop a liquid biopsy and provide a statistical framework for constructing predictors in the context of not only breast cancer but also other malignancies. The rank-based normalization methods could also be expanded to other intensity-based features like miRNA expression and DNA methylation levels to remove batch effect from either different platforms or laboratories. Based on the principle of relative information, we plan to integrate more omics signatures such as blood DNA methylation to improve the algorithm. In addition to potential early cancer detection, our methods of normalization, feature selection and model construction also indicated new application scenarios in multi-cancer subtypes determination or even other disease diagnosis in the future.
Gene expression intensity order is relatively stable in specific tissues of specific status.
Given the pairwise gene expression ranks from peripheral blood transcriptome as training data, supervised machine learning methods can be used to distinguish breast cancer patients from healthy donors.
The prediction model is robust in tackling both microarray and RNA-seq data.
We constructed a web-based tool named rankDetect that allows users to upload peripheral blood expression data and returns the predicted status of cancer/health.
Acknowledgements
The authors would like to thank the support and advice from present and past members of Dr Fang’s laboratory and would also like to thank the GEO database and TCGA Project Consortium for making their data publicly available.
Funding
National Key R&D Program of China (2016YFC0901701, 2016YFC0901603); ‘863 Projects’ of Ministry of Science and Technology of China (2015AA020101 and 2015AA020108); Key Research Program of the Chinese Academy of Sciences (KJZD-EW-L14).
Yadong Yang is a research assistant at the CAS Key Laboratory of Genome Sciences and Information, Beijing Institute of Genomics, Chinese Academy of Sciences; University of Chinese Academy of Sciences, Beijing 100049, China; he now works in GloriousMed Technology Co., Ltd., Beijing 100102. His research focuses on genomics data mining.
Tao Zhang is an MS student at the BIG Data Center, Beijing Institute of Genomics, Chinese Academy of Sciences. His research focuses on big data analysis and machine learning.
Rudan Xiao is an MS student at the CAS Key Laboratory of Genome Sciences and Information, Beijing Institute of Genomics, Chinese Academy of Sciences. Her research focuses on disease omics analysis and translational medicine research.
Xiaopeng Hao is an associate professor in the Breast Oncology Department, The Fifth Center Affiliated PLA General Hospital. His research focuses on diagnosis and treatment of breast diseases.
Huiqiang Zhang is a doctor in the Breast Oncology Department, The Fifth Center Affiliated PLA General Hospital. His research focuses on clinical diagnosis and basic breast cancer research.
Hongzhu Qu is an associate professor at the CAS Key Laboratory of Genome Sciences and Information, Beijing Institute of Genomics, Chinese Academy of Sciences. Her research focuses on genomics data mining.
Bingbing Xie is a PhD student at the CAS Key Laboratory of Genome Sciences and Information, Beijing Institute of Genomics, Chinese Academy of Sciences. His research focuses on genomics data mining.
Tao Wang is a professor in the Breast Oncology Department, The Fifth Center Affiliated PLA General Hospital. Her research interests include comprehensive treatment and basic research of breast cancer.
Xiangdong Fang is a professor at the CAS Key Laboratory of Genome Sciences and Information, Beijing Institute of Genomics, Chinese Academy of Sciences; University of Chinese Academy of Sciences, Beijing 100049, China. His research interests are clinical omics and translational medicine for stem cells and complex diseases.
References
Author notes
Yadong Yang, Tao Zhang, and Rudan Xiao contribute equally to this study.
