


Abstract
Drug repositioning has become a prevailing tactic as this strategy is efficient, economical and low risk for drug discovery. Meanwhile, recent studies have confirmed that small-molecule drugs can modulate the expression of disease-related miRNAs, which indicates that miRNAs are promising therapeutic targets for complex diseases. In this study, we put forward and verified the hypothesis that drugs with similar miRNA profiles may share similar therapeutic properties. Furthermore, a comprehensive drug–drug interaction network was constructed based on curated drug-miRNA associations. Through random network comparison, topological structure analysis and network module extraction, we found that the closely linked drugs in the network tend to treat the same diseases. Additionally, the curated drug–disease relationships (from the CTD) and random walk with restarts algorithm were utilized on the drug–drug interaction network to identify the potential drugs for a given disease. Both internal validation (leave-one-out cross-validation) and external validation (independent drug–disease data set from the ChEMBL) demonstrated the effectiveness of the proposed approach. Finally, by integrating drug-miRNA and miRNA-disease information, we also explain the modes of action of drugs in the view of miRNA regulation. In summary, our work could determine novel and credible drug indications and offer novel insights and valuable perspectives for drug repositioning.
Introduction
With the impressive advances in genomics, proteomics and systems biology, drug research and development technology has developed rapidly in the past 30 years. However, the whole process of drug discovery is still time-consuming, costly and often inefficient [1–3]. Approximately 90% of experimental drugs are unable to survive phase I clinical trials, as drugs with new structures tend to induce unpredictable adverse reactions [4]. Since repositioned candidates have already passed all the necessary tests common for de novo drug discovery, drug repositioning provides an effective way to speed up the process of new drug development and reduce risk [5, 6]. For example, sildenafil was first discovered to treat angina [7]. However, additional studies have proven another effect—prolonged penile erections in human volunteers [8]—and have shown that low doses of sildenafil can also be utilized to treat the rare pulmonary hypertension [9].
Currently, many computational approaches have been proposed to high-throughput predict the potential or new indications of small-molecule compounds. Most of the existing in silico drug repositioning approaches can be roughly categorized into the disease-based and the drug-based groups [10]. The disease-based methods usually hypothesized that similar diseases might be indicated by the same drugs [11–13]. Because different diseases might be caused by dysfunction of the same genes or same pathways, they might have similar pathogenesis and might be indicated by the same drugs [11–14]. The similarity of diseases can be measured from many aspects, such as molecular profile [15], transcriptional response [16] and therapeutics spectrum [17]. Then, `guilt by association’ role can be used to predict the novel indications. If two diseases have high similarity, the drugs used for only one of the two diseases might also be therapeutics for the other disease [17]. For example, Hu et al. [18] used gene expression profiles to construct a disease–disease network and discovered that at least 60% of the disease–disease pairs were in the same disease categories as determined by the Medical Subject Headings (MeSH) disease classification tree. Then the authors applied molecular profiles and drugs targets in the network to obtain drug repositioning opportunities and provided molecular targets and mechanisms underlying drug effects [18]. However, due to the complexity and diversity of disease pathology, the challenge of these methods is developing novel models or strategies to precisely evaluate the disease similarity.
For drug-based methods, the similar hypothesis that similar drugs might be used to treat the same diseases was applied. The similarity of drugs can be assessed based on chemical structure [19], target protein [20], side effect [21], gene expression profile [22, 23] and anatomical, therapeutic and chemical classification code [24]. For example, Ye et al. [25] constructed a drug–drug network by calculating side effects similarities of drugs and predicted novel indications for 1234 drugs through the enriched approved functions of their neighboring drugs in the network. The method achieved good performance at predicting Food and Drug Administration (FDA)-approved indications of drugs in the top five positions. They finally identified 5337 drug–disease associations across 584 diseases [25]. Additionally, drug-perturbed gene expression profiles, such as connectivity map [23], provide the opportunity to directly infer the associations between drugs and diseases by comparing the similarity of transcriptional responses of drug treatment and diseases. Furthermore, molecular docking can be used to discover novel relationships between ligands and targets through simulating and modeling their direct physical interaction [26]. If the target proteins contribute to the pathogenesis of one disease, the interacted ligands might have the potential to treat this disease. However, due to the inadequate information of drugs and diverse drug effects in different conditions, selecting the optimum properties to evaluate the similarity of drugs is still an important challenge.
The pathogenesis of complex diseases is usually the interplay of multiple molecular processes rather than the consequence of the abnormality of a single molecular process [27]. With the emergence of heterogeneous data resources of drugs and diseases, network techniques can provide systematic analysis for the mechanisms of drugs and diseases. Therefore, network-based approaches have become an increasingly viable option for drug repositioning and have satisfactory outcomes by focusing on biomolecular interactions [25, 28, 29]. Biological molecular networks consist of various associations between components (such as drugs, genes, proteins, diseases, etc.), and distinct biological molecular networks depend on the nature of these associations. Currently, the molecular networks used for drug repositioning mainly involve gene regulatory networks, metabolic networks, drug–target interaction networks, drug–drug interaction networks, disease–disease interaction networks and so on [28]. Additionally, many network algorithms have also been applied to multiple molecular networks to identify newly relationships between drugs and diseases [25, 30, 31]. For example, Wang et al. [30] developed a computational framework to filter coherent subnetworks that grouped biological function-related drugs, diseases and genes by integrating differential expression profiles of 418 drugs and 84 diseases. The identified coherent subnetworks were further utilized to detect novel drug indications and highlight their molecular basis [30].
At present, miRNAs are a kind of small noncoding RNA that are approximately 22 nucleotides long on average and play critical roles in drug development and disease treatment [32–34]. A large number of works have discovered that the modulation of aberrantly expressed miRNAs could be regarded as a feasible therapy strategy for many diseases [35], and many kinds of miRNA modulators have been applied for preclinical and clinical trials, such as small molecules, antisense oligonucleotides, miRNA sponges and miRNA mimics [36, 37]. Accordingly, targeting dysregulated miRNAs is a potential therapeutic regimen to develop miRNA-specific drugs [38]. Furthermore, some studies have been devoted to designing high-throughput methods to screen small-molecule regulators of miRNAs, which may provide a new direction for miRNA-targeting therapies [39, 40]. For example, we have proposed a novel algorithm to detect the biological links among small molecules and miRNAs in 23 different cancers based on transcriptional response similarities [41]. Additionally, the SM2miR [42] and Pharmaco-miR [43] databases have been constructed to provide fairly comprehensive repositories of the influences of small molecules on the expression of miRNAs. In summary, detecting potential relationships between drugs and miRNAs could be a promising method for the identification of novel drug indications.
In summary, the integration of information on drugs, miRNAs and diseases has great potential in the field of drug repositioning. In this study, we assumed that drugs with similar miRNA profiles may share analogous therapeutic properties [41, 44]. Accordingly, a drug–drug interaction network was first constructed based on the curated drug-miRNA associations from the SM2miR and Pharmaco-miR databases. Systematically topological analysis and module extraction revealed that the closely linked drugs in the network tend to treat the same diseases. Furthermore, we applied a random walk algorithm on the drug–drug interaction network to predict novel indications for drugs. After collecting additional drug indications from the ChEMBL database, both internal and external validation were performed to demonstrate the reliability of the proposed approach. Specifically, many predicted drug–disease associations could be supported by previous works. Additionally, we attempted to explain the modes of action of drugs from the perspective of miRNA regulation by integrating drug-miRNA and miRNA-disease associations (Figure 1). In summary, our miRNA-based drug–drug interaction network and network-based drug repositioning approach achieved good performance in predicting indications for approved drugs and elucidated the roles of miRNAs in new drug–disease associations.
Framework overview. Step 1: We collected the validated drug-miRNA and drug–disease associations and validated the hypothesis that if two drugs regulate more common miRNAs, they are more likely to be associated with the same diseases. Step 2: We constructed the drug–drug interaction network based on common miRNAs and performed topological analysis. Step 3: We predicted the novel drug–disease associations using RWR and evaluated the performance. Step 4: We explained the modes of action of drugs from the perspective of miRNA regulation.
Results
Construction of drug–drug interaction network based on curated drug-miRNA associations
Recent studies have observed that pair of drugs that are associated with the common miRNAs are inclined to indicate the same diseases [41, 44]. Therefore, if two drugs regulate multiple common miRNAs, they might have potential associations, such as synergistic action and structural similarity. To further verify this hypothesis, we first collected comprehensive drug-miRNA associations that were validated by experiments from the SM2miR and Pharmaco-miR databases. After the standardization of curated miRNAs and drug names (as mentioned in the `Materials and methods’ section), a total of 2652 drug-miRNA associations were acquired for the following analysis, which included 184 small-molecule drugs and 706 miRNAs (Table 1).
Statistics for the validated drug-miRNA and drug–disease associations
| Category | Resource | No. of node | No. of edge | No. of total edges |
|---|---|---|---|---|
| Drug-miRNA | SM2miR | 158 drugs and 673 miRNAs | 2329 | 2652 |
| Pharmaco-miR | 62 drugs and 161 miRNAs | 356 | ||
| Drug–disease | CTD | 112 drugs and 1131 diseases | 3852 | 4006 |
| ChEMBL | 31 drugs and 108 diseases | 154 |
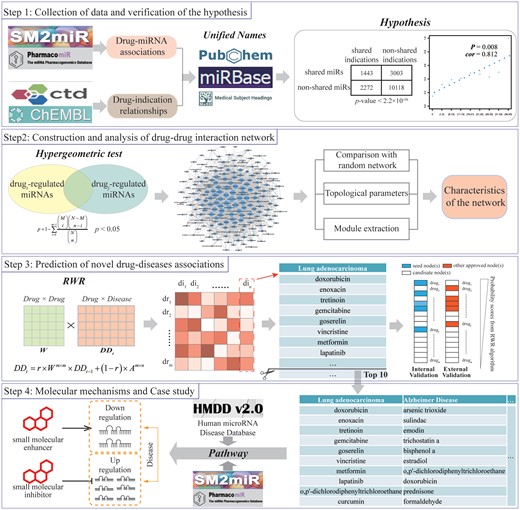
Based on the curated drug-miRNA relationships, drug pairs indicating the same diseases were found to be significantly enriched among the drug pairs that affect the expression of common miRNAs (chi-square, P < 2.2 × 10⁻¹⁶; as shown in Figure 2A). The results revealed that if two drugs share the common miRNA, they likely treat the same diseases. On the other hand, for a pair of drugs, if they regulate more common miRNAs, these two drugs are more likely to be associated with the same diseases (Pearson correlation coefficient, 0.812 and P = 0.008; Figure 2B). In summary, all these findings strongly supported the assumption that drugs with similar miRNA profiles would display similar modes of action; this would also demonstrate the feasibility of our miRNA-based method to construct a drug–drug interaction network.
Validation of our hypothesis. (A) The chi-square test was used to determine the association between drug pairs with common miRNAs and drug pairs with the same diseases. (B) Correlation between the number of miRNAs that drug pairs shared and the proportion of drug pairs with the same diseases.
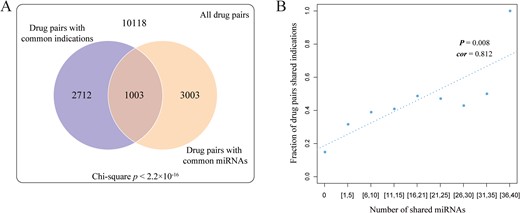
To systematically uncover the potential associations among drugs, we enumerated all the possible drug pairs across the entire 184 drugs (total of 16836 drug pairs). In the next step, a hypergeometric test was performed to identify the drug pairs that significantly shared common miRNAs. As a result, a total of 1888 significant drug–drug associations (hypergeometric test, P ≤ 0.05) were extracted to construct the drug–drug interaction network (Figure 3A), which covered 88 FDA-approved drugs and 87 experimental bioactive small molecules. We first proposed an miRNA-based drug–drug interaction network, which provided a new perspective for drug discovery.
Characterization of the drug–drug interaction network. (A) Global view of the drug–drug interaction network. The size of the node represents the levels of the node degree. (B) The node degree distribution of the drug–drug interaction network. (C) The comparison between the number of drug–drug pairs with the same diseases in our constructed drug–drug interaction network and random networks. (D) Nine modules were identified based on the MCODE method in the drug–drug interaction network (the red edges represent associations between two drugs that shared the same diseases).
Characterization of the drug–drug interaction network via topology analysis and module extraction
In the miRNA-based drug–drug network, we expected that the number of drug pairs that indicate the same diseases is greater than that in a random drug–drug network. In our drug–drug network, 623 drug pairs were related to the same diseases. Furthermore, we constructed 10000 random drug–drug networks by keeping the basic structure unchanged and counted the number of drug pairs with the same diseases for each random drug–drug network. As a result, 460 drug pairs on average were discovered as treating the same diseases in the random drug–drug networks. As shown in Figure 3C, only 23 random networks possessed more drug pairs with the same disease than real network. In other words, the number of drug pairs that were linked with the same diseases is significantly larger in the real network than in the random networks (permutation test, P = 0.0023). All these results supported that the drug–drug pairs in our network were more likely to treat the same diseases.
We also computed some topological parameters from the drug–drug interaction network, including the distributions of the node degrees, betweenness centrality, closeness centrality and so on (Figure 3B; Table 2). For this network, the clustering coefficient is 0.498 and the characteristic path length is 2.229, which indicates that the constructed drug–drug network possesses small-world properties. Furthermore, 20 hub drugs (degree, ≥50) were found in the drug–drug network, with most of these drugs having been used for clinical cancer treatment (Supplementary Table S1). Taking tretinoin (degree, 65) as an example, a large number of studies have demonstrated that this hub drug could effectively treat multiple cancers by regulating the expression of key miRNAs or genes, such as breast cancer [45], leukemia [46] and Graves' disease [47]. For instance, Chen et al. [48] discovered that tretinoin could induce glioblastoma cell apoptosis by upregulating the expression of miR-302b and reducing E2F3 levels. In summary, hub drugs could affect the expression of multiple miRNAs that play key roles in the development of disease and therefore may have a wider range of therapeutic properties and benefits in clinical treatment.
Topological parameters for the constructed drug–drug interaction network
| Topological parameter | Description | Value |
|---|---|---|
| No. of nodes | Number of drugs in the network | 175 |
| No. of edges | Number of drug pairs in the network | 1888 |
| Connected components | A set of vertices in a graph that are linked to each other by paths | 1 |
| Diameter | Length of the longest shortest path between each pair of nodes in the network | 6 |
| Density | The ratio of actual connections and potential connections in the network | 0.124 |
| Centralization | Network centralization | 0.345 |
| Clustering coefficients | A coefficient used to describe the degree of clustering between vertices in a graph | 0.498 |
| Shortest paths | Sum of length of all shortest paths in the network | 30450 (100%) |
| Characteristic path length | Network characteristic path length | 2.229 |
| Avg. number of neighbors | Average degree of drugs in the network | 21.577 |
Furthermore, we applied the molecular complex detection (MCODE) method to screen the subnetworks in our drug–drug interaction network. The MCODE is an effective method to detect densely connected regions in networks based on vertex weighting by local neighborhood density and outward traversal [49]. As a result, 9 nonempty subnetworks were identified, which include 94 drugs and 614 drug–drug associations (Figure 3D). In these subnetworks, 62.0% of drug pairs were reported to show common indications (Table 3). Meanwhile, we also observed that a large proportion of drugs (average 59.2%) in each subnetwork have been proven to be linked with the same diseases (Table 3). Taking the no. 4 subnetwork as an example, we discovered that 8 out of 9 drugs were utilized in the clinical treatment of breast cancer [(6)-gingerol [50], disulfiram [51], calcitriol [52], cyclophosphamide [53], tanshinone IIA [54], celecoxib [55], dexamethasone [56] and mitoxantrone [57]]. The only uncharacterized drug, daidzein, has also been used to treat another kind of cancer—endometrial neoplasm [58]. Taken together, these findings revealed that densely connected drugs tend to share similar therapeutic effects, and our drug–drug interaction network could be utilized for the prediction of drug–disease associations.
Common characteristics for the identified modules in the drug–drug interaction network
| No. | Score | No. of drugs | No. of Dta | No. of Mddb | n-Ratioc | No. of IDtd | No. of IDtDte | e-Ratiof |
|---|---|---|---|---|---|---|---|---|
| 1 | 27.622 | 38 | 29 | 13 | 44.8% | 312 | 192 | 61.5% |
| 2 | 5.176 | 18 | 12 | 7 | 58.3% | 19 | 11 | 57.9% |
| 3 | 5.091 | 12 | 8 | 6 | 75% | 4 | 4 | 100% |
| 4 | 3.25 | 9 | 9 | 8 | 88.9% | 13 | 10 | 76.9% |
| 5 | 3 | 5 | 3 | 2 | 66.7% | 2 | 2 | 100% |
| 6 | 3 | 3 | 3 | 1 | 33.3% | 3 | 2 | 66.7% |
| 7 | 3 | 3 | 3 | 2 | 66.7% | 3 | 1 | 33.3% |
| 8 | 3 | 3 | 2 | 1 | 50% | 1 | 0 | 0 |
| 9 | 3 | 3 | 2 | 2 | 100% | 1 | 0 | 0 |
| Total | - | 94 | 71 | 42 | 59.2% | 358 | 222 | 62.0% |
aDt means drugs that have known therapeutic function in one module.
bMdd means maximum number of drugs, which treat the same disease in one module.
cn-Ratio shows the radio of no. of Mdd and no. of Dt in one module.
dIDt means all interactions between Dt and other drugs in one module.
eIDtDt means two Dts in Dt–Dt interactions were approved to indicate the same diseases in one module.
fe-Ratio shows the radio of no. of IDtDt and no. of IDt in one module.
Prediction of drug–disease associations with the RWR algorithm in the drug–drug interaction network
We next aimed to utilize the drug–drug interaction network to predict novel drug–disease relationships. First, we acquired 3852 approved drug–disease associations across 112 drugs and 1131 diseases from the CTD database [59]. Furthermore, random walk with restarts (RWR) algorithm was performed on the drug–drug interaction network to identify potential drug–disease associations. Briefly, for each disease, its therapeutic drugs would be defined as the restart set (seed nodes) to obtain an equilibrium probability distribution on all the nodes in the network. In the next step, the probability for each node is used as a ranking criterion. For each disease, we excluded seed nodes and extracted the top 10 drugs with the highest scores as the potential drug–disease associations. Finally, a total of 11 310 drug–disease associations were predicted, which included 148 drugs and 1131 diseases (Supplementary Table S2). Notably, 42 small molecules without explicit indications have been predicted through drug–disease associations.
Furthermore, taking Alzheimer's disease (AD) as an example, we discovered that 7 out of 10 predicted small molecules have been reported to be associated with AD by reviewing the literature. For instance, estradiol (random walk rank is 6th) is commercially available in several hormone therapy products for managing conditions associated with reduced estrogen production and sometimes adopted for the palliative treatment of some hormone-sensitive cancers (such as breast and prostate cancers). Recent studies have proposed that the beneficial effects of estradiol on AD are directly linked to its ability to reduce amyloid-β peptides and tau aggregates, two hallmark lesions of AD [60]. Meanwhile, many works have discovered that estradiol treatment could reverse the expression levels of multiple AD-related miRNAs, such as miR-9, miR-124, miR-107 and so on [61–63]. Specifically, Micheli et al. [64] demonstrated that estradiol treatment protected neurons from amyloid-β peptide induced neurotoxicity by increasing the expression of miR-125b and then decreasing the expression of the proapoptotic proteins Bak1 and p53.
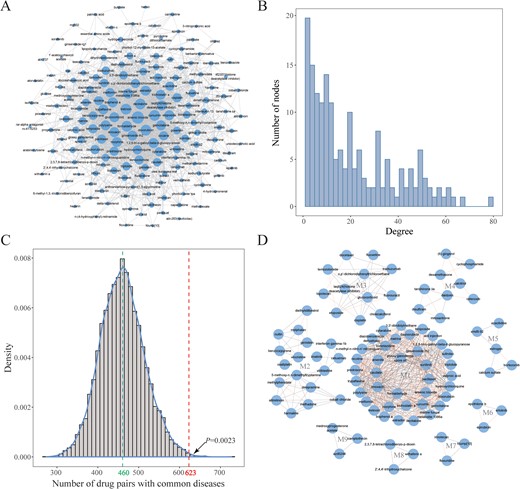
In addition, for a disease with at least 2 approved therapeutic drugs (total of 606 diseases), we applied a leave-one-out cross-validation (LOOCV) method to evaluate the performance. Concretely, for each disease and its validated drugs, one drug was left out as a testing set and other drugs were regarded as a training set. Next, we calculated the sensitivity and specificity for each threshold and then obtained the area under the receiver operating characteristics curve (AUROC). The AUROC values were computed for the 606 diseases and the average AUROC value was 0.62 (Figure 4A). Similarly, an independent testing set was utilized to validate our predicted drug–disease associations. As mentioned in the method, we collected 154 external drug–disease pairs (including 31 drugs and 108 diseases) from the ChEMBL database [65]. Considering these external drug–disease associations as a validated data set, AUROC values were calculated for 108 diseases (the mean AUROC is 0.68; Figure 4B). Additionally, the recall-based metric, mean percentile ranking (MPR), is a good evaluation criterion for one class data set [66, 67]. Here, the average MPR value for all kinds of disease in LOOCV and independent data set validation is 0.39 and 0.32.
Performance evaluation. (A) The distribution of AUROC values of internal validation (LOOCV, data set from CTD). (B) The distribution of AUROC values of external validation (independent data set validation, data set from ChEMBL).
The above AUROC and MPR values were not very outstanding because the diseases used here are more specific. Thus, for one drug–disease relationship, if the predicted disease belongs to the same category with a specific approved disease, we hypothesized that this inferred association between the drug and disease might be credible. Here, we first transformed all the used disease items into the 1st level of MeSH hierarchy item, which was defined as the disease category (DC) for the following analysis. As a result, we found that 52.6% of the predicted drug–disease associations, including 96 out of 102 drugs, conformed to the criteria for the same category. For instance, a potential relationship between arsenic trioxide and hemangioblastoma was predicted (random walk rank: 1st). Even though there is no direct evidence, arsenic trioxide has been proven to treat leukemia [68], ovarian cancer [69], liver cancer [70] and lymphoma [71] (belongs to the same DC with hemangioblastoma), which indicated that arsenic trioxide has a wide range of anticancer effects. Thus, we predicted that arsenic trioxide had the potential to treat hemangioblastoma. Additionally, for each drug, the Meet/Min score was calculated to measure the common categories of predicted diseases and approved diseases. As a result, 89 out of 102 drugs achieved a relatively high Meet/Min score (larger than 0.5). In summary, the good performance for the internal validation, external validation and DC annotation demonstrated the reliability and validity of our proposed method.
MiRNA-based regulatory mechanism
Previous studies have confirmed that small molecules could selectively modulate the expression of key miRNAs to treat diseases, such as cancers [72], nervous system diseases [73] and cardiovascular diseases [74]. In this study, 13 868 miRNA-disease associations across 1045 miRNAs and 288 predicted diseases were obtained from HMDD v2.0 [75]. Similarly, 2305 relationships between 148 predicted drugs and 629 miRNAs were extracted from the SM2miR and Pharmaco-miR databases. By integrating these experimentally validated miRNA-disease and drug-miRNA associations, we discovered 1788 drug–disease associations that share at least 1 miRNA in our predicted results. Specifically, 1037 predicted drug–disease associations significantly shared common miRNAs (hypergeometric test, P < 0.05). Therefore, we could attempt to explain the molecular mechanisms of the predicted drug–disease associations in the view of miRNA regulation.
To demonstrate the potential modes of action of the candidate drugs that were used in the disease treatment from the perspective of miRNA regulation, we aimed to detect drug-miRNA–disease regulatory pathways based on curated miRNA-disease and drug-miRNA associations. Briefly, all predicted drug–disease associations would be transformed into drug-miRNA–disease regulatory pathways if the drugs and diseases shared the common miRNAs. As a result, we achieved 10813 drug-miRNA–disease regulatory pathways, which covered 98 drugs, 341 miRNA and 288 diseases (Supplementary Table S3). Through further construction of the drug-miRNA–disease regulatory network (Supplementary Figure S1), we could visualize the miRNA-based therapeutic process intuitively and systematically.
Taking lung adenocarcinoma as an example, it is the most common subtype of nonsmall cell lung cancer, leading to the largest number of cancer-related deaths worldwide [76, 77]. As shown in Table 4, we identified 10 candidate drugs for the potential treatment of lung adenocarcinoma, among which 8 drugs (doxorubicin [78], gemcitabine [79], vincristine [80], lapatinib [81], curcumin [82], tretinoin [83], goserelin [84] and metformin [85]) have been demonstrated to control lung adenocarcinoma cells. Moreover, our predicted results could explain the modes of action of these drugs in view of miRNA regulation, which has been confirmed by previous studies (Figure 5). For example, Zhang et al. [86] discovered that curcumin could promote human lung adenocarcinoma cells apoptosis by reducing the expression of miR-186* and affecting the related signaling pathway. Meanwhile, by inducing the expression of miR-192-5p and then suppressing the PI3K/Akt signaling pathway, curcumin could inhibit cell proliferation and contribute to lung cancer cells apoptosis [87]. In addition, based on the identified drug-miRNA–disease associations, we speculated that curcumin might impact lung adenocarcinoma cells by mediating lung adenocarcinoma-related miRNA, such as miR-200b [88] (Figure 5; Supplementary Figure S2). In summary, our predicted drug-miRNA–disease relationships provide a novel strategy to elucidate drug mechanism and offer strong evidence for drug repositioning.
Predicted drugs for lung adenocarcinoma
| Rank | Drug name | Score |
|---|---|---|
| 1 | Doxorubicin | 0.013745301 |
| 2 | Enoxacin | 0.007430069 |
| 3 | Tretinoin | 0.00656881 |
| 4 | Gemcitabine | 0.006380536 |
| 5 | Goserelin | 0.006210347 |
| 6 | Vincristine | 0.006187986 |
| 7 | Metformin | 0.005504185 |
| 8 | Lapatinib | 0.005411213 |
| 9 | O,p′-dichlorodiphenyltrichloroethane | 0.005316775 |
| 10 | Curcumin | 0.005212752 |
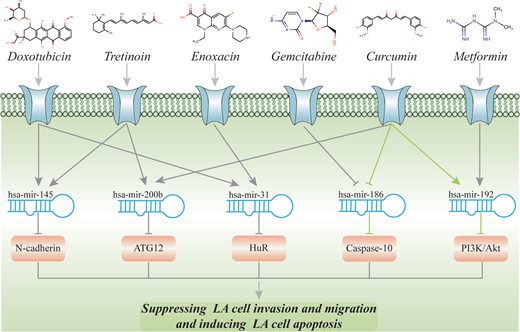
The validated and potential pathways for lung adenocarcinoma. (The green one represents that the whole regulatory cascade has been validated. For the gray one, only the binary drug-miRNA or miRNA-disease association has been validated.)
Discussion
Recent evidence indicates that miRNAs play crucial roles in multiple human diseases and could be regarded as potential targets of small-molecule drugs. Therefore, it is promising to detect novel drug–disease relationships in view of miRNA pharmacogenomics. In this study, a drug–drug interaction network was first constructed by integrating comprehensive drug–miRNA associations that were validated by biological experiments. Additionally, we implemented the random walk algorithm on the drug–drug interaction network to discover novel indications for drugs and achieved good performance for both internal and external validation. Furthermore, based on the curated drug-miRNA and miRNA-disease associations, the modes of action of drugs were exposed from the perspective of miRNA regulation. As a result, our miRNA-based drug–drug interaction network and network-based drug repositioning approach provided novel insights into the prediction of reliable drug–disease associations.
In this study, we proposed and confirmed the hypothesis that if two drugs regulate multiple common miRNAs, these two drugs may be related. Accordingly, a miRNA-based drug–drug interaction network was constructed for the 1st time. Furthermore, we discovered that drug pairs in our network are more inclined to indicate the same diseases than random networks. Similarly, the detection of network modules revealed that densely connected drug groups in the drug–drug interaction network tend to possess the same therapeutic effects. Thus, immediate similarities and the transitivity of similarity among drugs could be uncovered in our miRNA-based drug–drug interaction network.
Additionally, the data sets used in this study, including the drug-miRNA and drug–disease associations, were extracted from highly reliable databases that have been supported by published works [42, 43]. The RWR algorithm was well defined and widely used and has been proven to be successful in previous studies [29, 89]. The internal validation (LOOCV), external validation (independent test set) and DC validation demonstrated the reliability of the predicted drug–disease relationships. Specifically, some of our predictions have been verified by recent experiments. Take lung adenocarcinoma as an example, 8 of the 10 predicted drugs were approved to play significant roles in the treatment of lung adenocarcinoma, including two noncancer drugs (metformin and enoxacin). All these results stated that our predictive model is effective for the discovery of novel drug–disease associations.
Despite the encouraging results, the drug-miRNA and drug–disease associations in this study are still not sufficient, which may influence the performance of our model. As increasing validated drug-miRNA and drug–disease associations, our predictive model of novel drug–disease associations could be further improved. In conclusion, we provided an efficient network-based approach for drug repositioning and obtained a series of reliable relationships between drugs and diseases. Furthermore, molecular mechanisms underlying the actions of drugs were elucidated in view of miRNA regulation, which offered novel insights and valuable perspectives for drug repositioning.
Materials and methods
Drug-miRNA associations
Experimentally validated relationships between small molecules or drug compounds and miRNA were obtained from the SM2miR [42] and Pharmaco-miR Verified Sets [43]. We restricted the species to Homo sapiens, unified drug identifiers according to the PubChem Compound ID [90], converted the miRNA name into a Mature ID manually based on the miRBase (release 21) and deleted duplicate records. Finally, 2652 drug-miRNA associations were collected, which included 184 drugs and 706 miRNAs (Table 1).
Construction of the drug–drug interaction network
Comparison with random drug–drug network
Topology analysis of drug–drug interaction network
The comprehensive topological parameters for the drug–drug interaction network were computed with the Cytoscape plugin NetworkAnalyzer [91]. We calculated the clustering coefficient, network density, shortest paths, characteristic path length, average number of neighbors and network diameter for the constructed drug–drug interaction network. Specifically, the clustering coefficient and characteristic path length were usually used as global and local features, respectively, to measure the complex network, and the network density depicted the network connectivity.
Extraction of modules from drug–drug interaction network
Network modules were identified by the MCODE method, which detects densely connected regions in the drug–drug interaction network. The method applied vertex weighting through the local neighborhood density and outward traversal from a locally dense seed to extract the dense regions according to given parameters [49]. We used the MCODE tools (adopted default parameters) on the Cytoscape platform (version 3.6.0) and selected the network module with a score larger than 3.
Drug–disease associations
We downloaded complete drug–disease associations that were supported by published papers from the CTD [59] and ChEMBL databases [65]. A total of 3852 drug–disease associations (consisting of 112 drugs and 1131 diseases) from the CTD were applied as seeds for the RWR algorithms. Additionally, as an independent testing set, we collected another independent set of 154 drug–disease associations that included 31 drugs and 108 diseases from the ChEMBL to evaluate the performance of drug–disease predicted model (Table 1).
Prediction of novel drug–disease relationships based on the RWR algorithm
Internal validation: LOOCV
We applied LOOCV to systematically evaluate the performance of our predicted model based on an internal data set. For each disease, in each cross-validation trial, one approved drug was taken as the testing drug and the remaining drugs were selected as training drugs. Additionally, regarding of the training drugs as seed drugs, we performed the RWR algorithm on the drug–drug interaction network to calculate a predicted score for each drug. All drugs were ranked according to the final predicted scores. For a specified rank threshold, the true-positive rate (TPR) is the fraction of known associations that are correctly predicted, while the false-positive rate (FPR) is the fraction of unknown associations that are predicted. By varying the rank threshold, we can compute various TPR and FPR values. Then, a receiver operating curve (ROC) can be drawn based on the measured values to show the performance of the drug–disease predicted model for internal validation.
External validation: independent test set
Furthermore, we also investigated the performance of the predicted model on an independent test set. The curated drug–disease associations from the ChEMBL database were regarded as an independent test set. After removing the associations that exist in the data set from CTD database, our independent test set included 154 novel drug–disease pairs that covered 31 drugs and 108 diseases. Moreover, we trained the predicted model on the data set from CTD database and then tested this predicted model with the independent test set. Finally, for each disease, a ROC can be plotted based on the measured values to validate our drug–disease predicted model through external validation.
DC annotation
We demonstrated that drugs with similar miRNA profiles shared the similar therapeutic properties.
We constructed a drug–drug interaction network based on drug-miRNA associations for the 1st time.
Novel drug indications were predicted by RWR algorithm based on the curated drug–disease relationships and the constructed drug–drug interaction network.
We elucidated the modes of action of drugs from the perspective of miRNA regulation.
Funding
Foundation for the National Natural Science Foundation of China (61571169); Fundamental Research Funds for the Central Universities (NE2018101).
Xu Zhou is a master student at the College of Bioinformatics Science and Technology at Harbin Medical University.
Enyu Dai is a PhD student at the College of Bioinformatics Science and Technology at Harbin Medical University.
Qian Song is a master student at the College of Bioinformatics Science and Technology at Harbin Medical University.
Xueyan Ma is a master student at the College of Bioinformatics Science and Technology at Harbin Medical University.
Qianqian Meng is a master student at the College of Bioinformatics Science and Technology at Harbin Medical University.
Yongshuai Jiang is an associate professor at the College of Bioinformatics Science and Technology at Harbin Medical University.
Wei Jiang is a principal investigator and professor at the Department of Biomedical Engineering, College of Automation Engineering, Nanjing University of Aeronautics and Astronautics.
References
Author notes
The authors wish it to be known that, in their opinion, the first two authors should be regarded as joint First Authors.
