


Abstract
Protein kinases have been regarded as important therapeutic targets for many diseases. Currently, a total of 41 kinase inhibitors have been approved by the Food and Drug Administration, along with a large number of kinase inhibitors being evaluated in clinical and preclinical trials. Among all, allosteric inhibitors, such as type II kinase inhibitors, have attracted extensive attention owing to their potential high selectivity. Nowadays, molecular docking has become a powerful tool to search for novel kinase inhibitors. However, as for type II kinase inhibitors, their allosteric characteristics may exert a deep influence on docking accuracy. In this study, a comprehensive assessment was conducted to evaluate the effectiveness of nine docking algorithms towards type II kinase inhibitors. The calculation results showed that most tested docking programs, especially Glide with XP scoring, LeDock and Surflex-Dock, succeeded in the accurate identification of near-native binding poses, with the success rates ranging from 0.80 to 0.90, and the scoring functions in GOLD and LeDock outperformed the others in the prediction of relative binding affinities. In terms of the P-values, areas under the curve and enrichment factors, Glide with XP scoring, Surflex-Dock, GOLD with Astex Statistical Potential scoring and LeDock had better screening power to discriminate between active compounds and decoys. However, the screening power is sensitive to different initial conformations of the same target. It is expected that our study can provide some guidance for docking-based virtual screening to discover novel type II kinase inhibitors, as well as other allosteric inhibitors.
Introduction
Protein kinases belong to the family of phosphate transferases that can alter the conformation or activity of a protein or enzyme by catalyzing the transfer of the γ-phosphate of adenosine triphosphate (ATP) to the hydroxyl groups of serine, threonine or tyrosine residues of their substrates [1]. Currently, more than 500 protein kinases have been encoded in the human genome, which can be roughly divided into conventional and atypical protein kinases [2]. According to their sequence similarity in the catalytic domains, the conventional protein kinases consist of eight main groups, including TK, TKL, STE, CMGC, CK1, CAMK, AGC and others [3]. The protein kinase family has been proven to be involved in a series of essential cellular signaling pathways and modulate almost all basic cellular functions [4, 5]. Besides, plenty of evidence shows that overexpression or dysregulation of some kinases is related to a variety of diseases, such as cancer [6–8], inflammation [9–11], neurodegenerative disorders [12, 13], etc. Thus, protein kinases have emerged as one of the most important classes of drug targets [14]. Up to now, a total of 41 drugs targeting kinases have been approved and a large number of kinase inhibitors are currently in clinical and preclinical trials [15, 16].
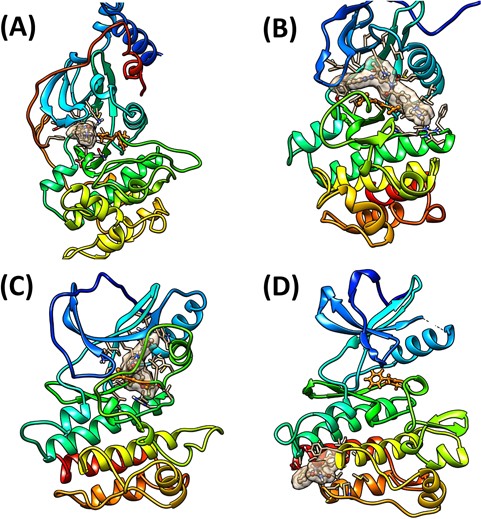
Representative binding structures for (A) type I, (B) type II, (C) type III and (D) type IV inhibitors. The ligands and DFG (DLG) motifs are colored in brown and orange, respectively. The binding sites are showed as surfaces.
![(A) Distribution of the kinases with the DFG-out conformations found in the KLIFS database by mapping onto the human kinome phylogenetic tree. Image is generated by KinomeRender [72]. (B) Workflow of the collection and preparation processes for dataset I. (C) Workflow of the construction process for dataset II.](https://oup.silverchair-cdn.com/oup/backfile/Content_public/Journal/bib/21/1/10.1093_bib_bby103/4/m_bby103f2.jpeg?Expires=1749145192&Signature=4wTSxw8EiUm-wzriwAEzS1gNWsq3w-BVxjvD9CRgfNDNSK7XAqNBs0iQ53Xi~qhaZHp~qal45mX4uDS6Q~2HSNsXwB5zzU4Eb4eKGPS5W3mKrX-UEa07Vz7RDzhkbcz08liB37rrudSHGz75scRWU9MuLWsrMZ2uWSbEHhi5~AqvX3GH4ybHJMkwmJLDlvTE1yHcx~QwPVzGZFuMXW2Gh3jMFWy2~6T0GPe9I9uttY8~ZDHWbTjMSe7bTz5EjTN0zPuCsO-dCoHQ23Km~w~RjmgiIssvppXhRA2HJQVY-NfH9GG8ip63sQ92MJPWHMuj~Bq5pPw5~wMd8oOctfePkg__&Key-Pair-Id=APKAIE5G5CRDK6RD3PGA)
(A) Distribution of the kinases with the DFG-out conformations found in the KLIFS database by mapping onto the human kinome phylogenetic tree. Image is generated by KinomeRender [72]. (B) Workflow of the collection and preparation processes for dataset I. (C) Workflow of the construction process for dataset II.
Since the first crystal structure of protein kinase domain was solved in 1991 [17], extensive process has been achieved in the field of kinase structural biology [18]. Until now, more than 4000 kinase crystal structures have been deposited in the Protein Data Bank (PDB) [19], thus greatly accelerating the design and discovery of novel kinase inhibitors. According to the binding modes of ligands and the conformations of essential residues in the binding pockets, the reversible kinase inhibitors can be roughly categorized into four types: type I, II, III and IV (Figure 1) [20]. Type I inhibitors are ATP-competitive inhibitors, also known as ATP mimetic inhibitors, which just bind to the ATP-binding pocket in the active DFG(Asp-Phe-Gly)-in conformation. Type II inhibitors not only bind to the ATP-binding pocket but also occupy an adjacent hydrophobic pocket in the inactive DFG-out conformation [21]. Type I1/2 inhibitors are a combination of type I and type II inhibitors, which bind to the DFG-in conformation but extend into a back pocket [22]. Type III inhibitors belong to allosteric inhibitors, which are not ATP competitive and only bind to the allosteric pocket adjacent to the ATP-binding pocket [23]. Type IV inhibitors bind to an allosteric site remote from the ATP-binding pocket such as the myristate pocket [24, 25]. Type I inhibitors, which represent most of the available kinase inhibitors, are often thought to lack selectivity because the targeted ATP-binding pockets are highly conserved across the entire human kinome. Hence, design and discovery of inhibitors targeting the inactive DFG-out state or other allosteric sites, which may have a better chance to achieve improved kinase selectivity, are urgent [26–28].
With the rapid advances on computational chemistry and computer technology, docking-based virtual screening (VS) has become one of the most commonly used approaches in structure-based drug design [29, 30]. In the past four decades, a large number of protein–ligand docking programs, such as AutoDock [31], AutoDock Vina [32], LeDock [33], Glide [34] and GOLD [35], have been developed and continually updated. However, because different sampling algorithms and scoring functions are employed by different docking programs and various parameters need to be tuned in most programs, it is hard to judge which one is the best choice for a specific protein or protein family. Therefore, based on different datasets, a number of studies have been reported to assess the performance of docking algorithms and scoring functions under some specific circumstances by examining the sampling power to recognize near-native ligand binding poses, scoring power to rank binding affinities and screening power to discriminate active compounds from decoys [36–42]. In order to guarantee the reliability of an assessment study, an extensive dataset with a large number of targets and ligands was necessary [43]. Nevertheless, the results of an assessment study could only represent the overall docking performance on the specific dataset. In other words, if we attempt to conduct a docking-based VS for a specific protein or protein family, it may be necessary to evaluate the applicability of the used docking algorithms to the studied targets [44].
Compared with conventional ligand binding pockets, such as the ATP-binding sites of protein kinases, allosteric pockets appear to be more flexible because the binding of a ligand can induce the conformational change of surrounding residues [45]. As a result, whether a docking program works well for allosteric inhibitors, such as type II kinase inhibitors, remains to be elucidated. In this study, a number of popular docking programs, including Autodock [31], Autodock Vina [32], DOCK [46], Glide [34], GOLD [35], LeDock [33], rDock [47], MOE Dock [48] and Surflex-Dock [49], were assessed towards type II kinase inhibitors in terms of sampling power, scoring power and screening power. Through this study, we attempt to solve the following puzzles: (1) Compared with type I inhibitors, type II kinase inhibitors occupy an additional allosteric pocket, so does a small increase of molecular weight or the number of rotatable bonds of ligands affect the docking accuracy of a certain program? (2) Allosteric sites are more flexible than the ATP-binding pockets so that the binding modes of type II inhibitors with different scaffolds may vary a lot, and then are the commonly used semi-flexible docking algorithms (rigid protein and flexible ligand) adaptable for the VS of allosteric inhibitors. (3) In some widely accepted benchmarks such as DUD/DUD-E [50, 51], type I and type II kinase inhibitors are mixed and broadly classified as the same type. However, docking a type I inhibitor into a DFG-out conformation or in turn docking a type II inhibitor into a DFG-in conformation may not yield reasonable prediction. Furthermore, in a so-called benchmark study, for each target, a single representative crystal structure was usually used, but there is no doubt that the docking results based on different protein conformations for the same target might be different to a certain degree. Therefore, in this regard, can these so-called benchmarks be considered as golden standards for docking assessment?
Materials and methods
Data set collection and structure preparation
The Kinase–Ligand Interaction Fingerprints and Structures (KLIFS) database is a resource of the protein structures of catalytic kinase domains and the binding modes of kinase ligands, and it offers a consolidated kinase repository for systematic mining of kinase–ligand interaction information [52, 53]. Taking DFG-out as the keyword, 324 PDB structures were extracted from KLIFS, and the kinases confirmed to own the inactive conformations were distributed in almost all groups of the whole kinome (Figure 2A). Then, the PDBbind database (version 2017) [54] was searched and 222 structures were found in both KLIFS and PDBbind. Nevertheless, the category in KLIFS or the binding data obtained from PDBbind might be not correct, and each structure was checked manually. Finally, the incongruous structures with covalent ligand binding, multiple binding models for the same ligand or ligand binding in just the ATP-binding pocket or other allosteric pockets were eliminated, and the final dataset (referred to as dataset I) contains 201 protein–ligand complex structures (the composition of dataset I is shown as Figure 3). The distributions of the experimental binding affinities and five important physicochemical properties calculated by Discovery Studio 3.1 [55], including molecule weight (MW), octanol–water partitioning coefficient (AlogP), molecule solubility (logS), number of rotatable bonds (nrot) and polar surface area (PSA) of the 201 type II inhibitors, are illustrated in Figure 4. Obviously, the average MW and nrot of dataset I are significantly larger than those of the ordinary kinase dataset tested by Cross et al. [38].
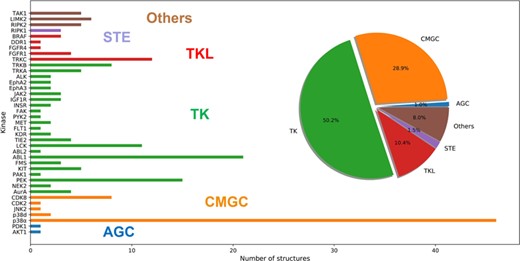
Distribution of the protein kinase targets in dataset I grouped by kinase sub-families.
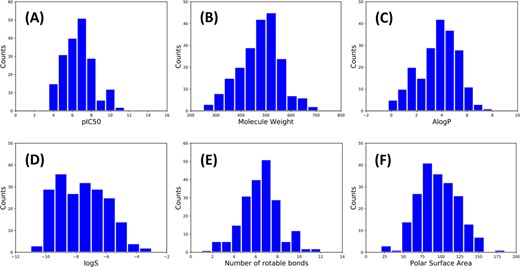
Distributions of (A) pIC50, (B) molecular weight, (C) AlogP, (D) logS, (E) number of rotatable bonds and (F) PSA of the 201 ligands in dataset I.
The coordinates of these 201 structures were downloaded from the PDBbind database [54]. For each complex, a protein structure file with the PDB format and two ligand structure files with the SD format and Mol2 format were generated. The missing loops in many proteins were added by the Module/Refine Loops module in Chimera [56]. Then, all the structures were processed by the Protein Preparation Wizard [57] module in Schrödinger 2017, including removing waters and redundant chains, assigning bond orders, adding hydrogens, filling in missing side chains, optimizing H-bond network and minimizing the system with the OPLS2005 force field until the root-mean-square deviation (RMSD) of heavy atoms converged to 0.30 Å. The protonation states of residues at pH = 7.0 were determined by PROPKA [58]. If the assessed docking program has its own protein preparation function, its own function would be used. Besides, when we conducted molecule docking calculations, the initial coordinates of the ligands sketched by ourselves or extracted from a compound library are always random. Thus, to mimic the real scenario, all the ligands in the dataset were successively rotated around the z axis by 180° and minimized with the OPLS2005 force field by using an in-house script based on the Python API available in Schrödinger 2017.
To test the screening power of a docking algorithm to distinguish known type II inhibitors from decoys, an additional validation dataset, named dataset II, was constructed (Figure 2). Because some targets in dataset I have very few actives, three representative targets (ABL1, BRAF and p38α) with more than 100 type II inhibitors from three different groups (TK, TKL and CMGC) were chosen for assessment. As far as we know, different initial protein conformations may have great effect on docking [22, 59–62], so for each target, three different crystal structures (PDB entries: 2HYY, 2HZ0 and 3QRI for ABL1, 3IDP, 3II5 and 4KSP for BRAF, and 1WBT, 2YIW and 3K3I for p38α) were selected based on the diversity of the co-crystalized ligands represented by the Tanimoto coefficient calculated using the FCFP_4 fingerprint by the Find Diverse Molecule module in Discovery Studio 3.1[55]. It was found that the classes of the known kinase inhibitors in the existing databases are not clearly categorized, and then we collected the known type II inhibitors for each target by searching literature manually. As a consequence, 105, 370 and 320 type II inhibitors were collected for ABL1, BRAF and p38α, respectively, and 50, 100 and 100 most diverse actives were extracted by the Find Diverse Molecule module for ABL1, BRAF and p38α, respectively. The corresponding decoys were generated with a ratio of 1:50 by DUD-E [51]. Finally, all the molecules in dataset II were processed by the LigPrep [63] module in Schrödinger. The ionized states and tautomers/stereoisomers at pH = 7.0 were generated by using Epik [64, 65]. The maximum number of the stereoisomers for each molecule was set to 4, and the other parameters for Ligprep were set to the default settings.
Docking programs
Nine docking programs were assessed towards type II kinase inhibitors, including AutoDock (version 4.2.6) [31], Autodock Vina (version 1.1.2) [32], DOCK (version 6.8) [46], Glide (version 7.7) [34], GOLD (version 5.3.0) [35], LeDock (version 1.0) [33], rDock (version 2013.1) [47], MOE Dock (version 2016.8) [48] and Surflex-Dock (version 4221) [49]. The basic information of these programs is summarized in Table 1. In docking calculation, the binding site was defined by the co-crystalized ligand. The maximum number of the docking poses for each ligand and the RMSD cutoff for clustering were set to 20 and 0.5 Å, respectively. All the other parameters were set with no tuning of the optional parameters, unless otherwise noted as followed.
AutoDock
Proteins and ligands were firstly preprocessed by AutoDockTools 1.5.6, including format conversion, addition of hydrogens, assignment of Gasteiger charges and cleanup of unwanted elements. The grid points and grid point spacing were set to 60 and 0.375 Å, respectively. The Lamarckian genetic algorithm (LGA) was employed to search the binding conformation of flexible ligand. The generations in the LGA calculation and the iterations of Solis & Wets local search were set to 27 000 and 300, respectively. The final poses were scored with the default scoring function.
Basic information of the nine assessed docking programs
| Program | Sampling algorithm | Scoring function | Website |
|---|---|---|---|
| AutoDock | LGA | Force field-based scoring function | http://autodock.scripps.edu/ |
| Autodock Vina | Iterated local search global optimizer | Empirical scoring function | http://vina.scripps.edu/ |
| DOCK | Anchor-and-Grow Algorithm | Grid-based Score, Continuous Score, Zou GB/SA Score, Hawkins GB/SA Score and so on | http://dock.compbio.ucsf.edu/ |
| Glide | Extensive conformational search or anchor and refined growth strategy | GlideScore or GlideScore XP empirical scoring function | http://www.schrodinger.com/ |
| GOLD | GA | GoldScore, ChemScore, ASP and Piecewise Linear Potential (CHEMPLP) | http://www.ccdc.cam.ac.uk/ |
| LeDock | A combination of evolution algorithm and simulated annealing search | Empirical scoring function | http://lephar.com/ |
| rDock | A combination of GA, low temperature MC and Simplex minimization (MIN) | Empirical scoring function | http://rdock.sourceforge.net/ |
| MOE Dock | Alpha Triangle, Alpha PMI, Proxy Triangle, Triangle Matcher and so on | ASP Score, Affinity dG Score, Alpha HB Score, London dG Score and GBVI/WSA dG Score | http://www.chemcomp.com/ |
| Surflex- Dock | Fragmentation | Empirical Hammerhead scoring function | http://www.tripos.com/ |
AutoDock Vina
The preprocessing protocols for proteins and ligands were the same as those used in AutoDock. The size of the search space was set to 30 Å × 30 Å × 30 Å, and the maximum energy difference between the best and the worst binding modes was set to 10 kcal/mol.
DOCK
Given the poor computational efficiency of most scoring functions implemented in DOCK, only the traditional grid-based scoring function was used in this study. Firstly, the AM1-BCC and ff99SB partial charges were assigned to ligands and proteins by Chimera [56], respectively, and then the solvent accessible surface of each protein was generated by the DMS program with a probe radius of 1.4 Å. The negative image of the surface was created by sphen_cpp, and the spheres within 10.0 Å of the given ligand were chosen by sphere_selector to represent the binding pocket on the protein. Next, a box with 8.0 Å length and a grid with 0.3 Å grid spacing were generated by showbox and grid.
Glide
Three different scoring modes, including high throughput VS (HTVS), standard precision (SP) and extra precision (XP), are supported in Glide based on the so-called docking precision. Due to relatively low accuracy of HTVS, SP and XP were used in our study. By using the Receptor Grid Generation utility of Glide, the binding box with the size of 10 Å × 10 Å × 10 Å centered on the co-crystallized ligand was generated for each protein structure. Then, based on this grid, Glide docking calculations with the SP and XP scoring were carried out.
GOLD
Proteins were prepared by the built-in protein preparation module including adding hydrogens and deleting unnecessary waters. Then, the binding site was defined as the residues within 10 Å around the co-crystalized ligand. The genetic algorithm (GA) search efficiency was set to ‘automatic’, and the four scoring functions implemented in GOLD were used for scoring, including Piecewise Linear Potential (CHEMPLP), GoldScore, ChemScore and Astex Statistical Potential (ASP).
LeDock
The conformations of each ligand were sampled by a combination of simulated annealing and evolutionary optimization algorithm. After the given protein was processed by the lepro utility, docking calculation was performed with the default parameters.
rDock
A combination of stochastic and deterministic search techniques was used to generate low-energy ligand binding poses in rDock. In detail, the standard docking protocol contains three stages of GA search (GA1, GA2 and GA3), a low temperature Monte Carlo (MC) stage and a Simplex minimization stage. All the parameters for binding site determination, pose sampling and scoring were set to default.
MOE Dock
Four sampling algorithms (Alpha Triangle, Alpha PMI, Proxy Triangle and Triangle Matcher) and five scoring functions (ASE Score, Affinity dG Score, Alpha HB Score, London dG Score and GBVI/WSA dG Score) are supported in MOE Dock. Here, all the above 20 pairs of sampling algorithms and scoring functions were evaluated and the best one was presented in the final results. The proteins were preprocessed by the built-in QuickPrep module, and the parameters of the sampling algorithms and scoring functions were set to default.
Surflex-Dock
In docking calculations, the ligand fragments were generated and superimposed to the binding site, defined by a protomol derived from the protein–ligand complex, and then scored by a modified empirical scoring function based on Hammerhead. Protomol was determined by the ‘proto’ mode, and docking was carried out with the ‘-pgeom’ mode.
Evaluation metrics
The performance of each docking program was assessed by the sampling power to recognize near-native ligand binding poses, scoring power to rank binding affinities and screening power to discriminate active compounds from decoys.
Sampling power
Sampling power represents the capacity of a docking program (sampling algorithm and scoring function) to recognize the correct ligand binding poses. In our study, the native ligands were extracted from the crystal complexes and then redocked into the corresponding proteins. The heavy-atom RMSD between the experimentally observed native pose and each docking pose was calculated by the obrms utility in OpenBabel [66]. If the RMSD is less than 2.0 Å, the docking pose was considered as near-native. Based on the RMSDs of all molecules in dataset I, an overall success rate for each docking program was obtained.
Scoring power
Scoring power represents the ability of a docking program (or a scoring function) to rank the binding affinities. In this study, Pearson’s correlation coefficient (r) was used to evaluate the linear correlation between the scores predicted by each docking program and experimental binding data, and Spearman’s ranking coefficient (ρ) was used to evaluate the Pearson correlation between the rank values of the two variables. Besides, to assess the performance of a given scoring function alone, each ligand in the crystal structure was just refined and scored, thus excluding the influence of conformational sampling.
Screening power
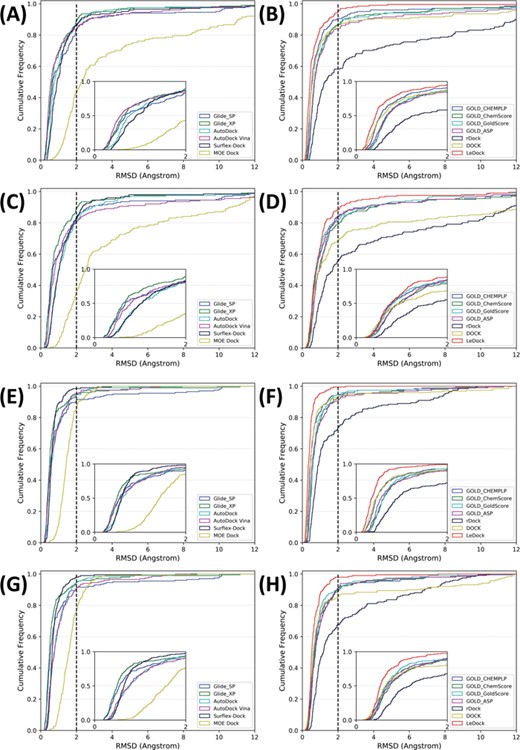
RMSD cumulative distribution of the results predicted by different docking programs (or scoring functions). (A–D) The best-scored poses were selected as the best poses and (E–H) the best-matched poses (lowest RMSD) were selected as the best poses. (A), (B), (E) and (F) depict the docking results based on the native ligands, and (C), (D), (G) and (H) depict the docking results based on the minimized ligands. Dashed lines indicate a 2.0 Å RMSD cutoff, and small images highlight the RMSD range of 0–2.0 Å.
Results and discussion
Assessment of sampling power on dataset I
The sampling power of the tested docking programs (or scoring functions) was evaluated first. The cumulative occurrence frequency of the docking poses under a given RMSD threshold is illustrated in Figure 5. In terms of the success rates for the best-scored poses, most docking programs could achieve good performance. If the best-RMSD poses were used, the success rates of some docking programs could even be close to 1.0, suggesting that most tested programs can take a successful sampling towards type II kinase inhibitors. As reported in the previous studies, MW or nrot of ligands might have a great impact on docking. [44, 67] However, compared with our previous assessment [36] on an ordinary benchmark dataset or another study reported by Cross et al. [38], the sampling power of the docking algorithms tested in this study towards type II kinase inhibitors is even better, implying that, compared with type I kinase inhibitors, the effect of a small increase of MW or nrot of type II inhibitors on docking is not too significant. Based on the success rates for the best-scored poses, the performance of the tested programs follows the following order: GOLD_CHEMPLP (0.905) > LeDock (0.900) > Glide_XP (0.891) > AutoDock (0.876) > GOLD_ChemScore (0.866) > GOLD_GoldScore (0.861) ≈ Surflex-Dock (0.861) > DOCK (0.856) > GOLD_ASP (0.841) > AutoDock Vina (0.836) > Glide_SP (0.831) > rDock (0.582) > MOE Dock (0.428). To give a more realistic evaluation of the tested docking programs, the minimized ligands were redocked into the corresponding proteins, and the success rates were calculated. As shown in Figure 5, for the minimized ligands, the success rates of most docking programs (especially DOCK) decreased, suggesting that the docking results may be sensitive to the initial geometries of the input ligands, and therefore the preparation and minimizations of ligands for docking need to be handled carefully [68]. Based on the minimized ligands, the performance of the tested programs has the following rank: Glide_XP (0.891) > LeDock (0.866) > GOLD_CHEMPLP (0.846) > GOLD_ASP (0.836) > Glide SP (0.831) > Surflex-Dock (0.826) > AutoDock (0.816) > GOLD_GoldScore (0.811) > AutoDock Vina (0.806) > GOLD_ChemScore (0.791) > DOCK (0.682) > rDock (0.592) > MOE Dock (0.353). In many cases, combination of molecule docking with a rapid scoring scheme and a more rigorous method, such as Molecular Mechanics/Poisson-Boltzmann Surface Area and Molecular Mechanics/Generalized Born Surface Area [69, 70], was used to improve the accuracy of docking. In these situations, multiple poses of a single molecule were generated by molecular docking, and then the docking results were rescored by a more rigorous method. Here, the success rates of the tested docking programs for the top 1, top 2, top 3 and top 20 best-scored poses were calculated. As illustrated in Figure 6, when more poses were used, the success rates could be improved, especially for Glide_SP (0.831, 0.886 and 0.896 for the top one, top two and top three poses, respectively), AutoDock Vina (0.836, 0.896 and 0.920) and Surflex-Dock (0.861, 0.905 and 0.935).

Success rates of different docking programs (or score functions). The top one (blue), top two (orange) and top three (green) best-scored poses and best-RMSD poses (top 20 best-scored poses) (red) were compared with the native poses. If the RMSD between the native pose and either one of the selected poses is less than 2.0 Å, it is considered as a successful prediction. (A) and (B) describe the results for the native ligands and minimized ligands, respectively.
Pearson’s correlation coefficients and Spearman’s ranking coefficients of different docking programs towards type II kinase inhibitors
 |
|
aAn absolute value.
bGreen and red represent the maximum and minimum, respectively, and yellow represents a medium. The colors are based on the values of Pearson’s correlation coefficient.
cNot tested due to the lack of this option.
Pearson’s correlation coefficients and Spearman’s ranking coefficients of different docking programs towards type II kinase inhibitors
|
|
aAn absolute value.
bGreen and red represent the maximum and minimum, respectively, and yellow represents a medium. The colors are based on the values of Pearson’s correlation coefficient.
cNot tested due to the lack of this option.
In summary, except for several programs such as rDock, MOE Dock and DOCK, most tested docking programs illustrate satisfactory sampling power towards type II kinase inhibitors. If we want to identify the correct binding poses for type II inhibitors, Glide_XP, LeDock or GOLD_CHEMPLP may be a good choice. Besides, it should be noted that LeDock, a recently developed free docking tool, performed excellently on predicting correction binding poses for dataset I and a larger dataset in our previous study [36]. Just as explained in our previous study, a combination of evolutionary algorithm and simulated annealing search adopted in LeDock may mainly account for its surprising sampling power. As far as we know, evolutionary algorithm, especially its basic branch, GA, is an efficient global optimization method and widely applied to handle optimization problems [71]. In addition, LeDock uses SA search rather than conventional random search as a tool to generate the first generation of docking poses, thus greatly enhancing the probability to detect the right conformations. We believe that the sampling strategy employed by LeDock should have its own superiority and may provide some guidance for the exploitation of novel sampling algorithms.
Assessment of scoring power on dataset I
The Pearson’s correlation coefficients (r) and Spearman’s ranking coefficients (ρ) for the tested programs are summarized in Table 2. Some representative scatter plots of the experimental binding affinities (pIC50) versus docking scores predicted by several well-performed programs are illustrated in Figure 7. As the r and ρ display a similar trend, only the r values were used in the following discussions.
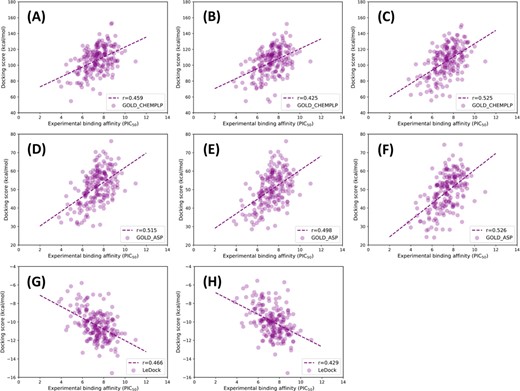
Scatter plots of experimental binding affinities (pIC50) versus docking scores predicted by several representative docking programs, including (A–C) GOLD_CHEMPLP, (D–F) GOLD_ASP and (G–H) LeDock. (A), (D) and (G) represent the results for the best-scored poses predicted based on the minimized ligands; (B), (E) and (H) represent the results for the best-RMSD poses predicted based on the minimized ligands; and (C) and (F) represent the results for the refined binding poses based on the native ligands. The regression line is indicated by the blue dashed line, and R represents the absolute value of Pearson correlation coefficient.
The assessment of the scoring power was conducted on both the native and minimized ligands. Overall, similar to the sampling power, the scoring power for the minimized ligands is also worse than that for the native ones. For most docking programs, r obtained from the best-RMSD poses is not always better than that obtained from the best-scored poses. However, when excluding the inhibitors with unsuccessful predictions (RMSD > 2.0 Å), r obtained from the best-scored poses can gain a remarkable improvement, highlighting the importance of the accurate predictions of binding poses. When the minimized ligands were used in docking, based on the Pearson’s correlation coefficients for the best-scored poses, the performance for the individual docking programs has the following order: GOLD_ASP (0.515) > LeDock (0.466) > GOLD_CHEMPLP (0.459) > GOLD_ChemScore (0.452) > GOLD_GoldScore (0.437) > Glide_XP (0.397) > AutoDock Vina (0.390) > AutoDock (0.370) > Glide_SP (0.370) > MOE Dock (0.328) > Surflex-Dock (0.269) > DOCK (0.228) > rDock (0.127). Among all the tested programs, the score functions implemented in GOLD and LeDock have the best scoring power.
As has been stated above, some ligands, of which neither the best-scored pose nor the best-RMSD one has a satisfactory match with the native pose due to insufficient sampling, may have a great influence on the final results. Hence, to reduce the effect of sampling, the docking calculations with only a local refinement on the native poses were also conducted. In this situation, the correlation coefficients for most docking programs improve a lot, such as Glide_SP (from 0.374 to 0.486), Glide_XP (from 0.397 to 0.454), AutoDock Vina (from 0.385 to 0.453) and MOE Dock (from 0.293 to 0.452). Interestingly, some programs that even performed not so well on the accurate prediction of ligand binding poses (such as DOCK and MOE Dock) could also yield acceptable results. Thus, maybe except a few score functions (such as rDock) that really have some intrinsic defects, most tested score functions do not work too badly towards type II kinase inhibitors.
Assessment of screening power on dataset II
As rDock and MOE Dock do not perform so well in the assessments of sampling power or scoring power, their screening powers were not evaluated anymore. Therefore, only the other seven docking programs were tested in this section.
Firstly, we evaluated the overall performance of VS in terms of two criteria: the P-values given by the student’s t-test and the AUC of the ROC curve (Table 3). The distributions of the docking scores of the actives and decoys and the ROC curves are plotted in Figure 8. Among all the 33 AUCs for the same target, there are 25 and 14 values larger than 0.9 for ABL1 and BRAF, respectively, while the number is reduced to 0 for p38α. An interesting finding is that the impact of the different initial protein conformations of the same target on the screening power is significant. Taking ABL1 as an example, the AUCs for 2HYY or 3QRI range from 0.92 to 0.99 (except the values produced by DOCK), but those for 2HZ0 are much lower, and only three of them are higher than 0.90 (GOLD_ASP, AutoDock and Vina). According to the structural alignment of 2HYY, 2HZ0 and 3QRI (Figure 9), we can observe that the three bound ligands adopt very similar configurations in the ATP-binding pocket while their orientations in the allosteric pocket are quite different, thus inducing the substantial conformational changes of some surrounding residues. As a result, initial protein conformation may have a great influence on docking, and it is of vital importance to choose an appropriate crystal structure before carrying out a docking-based VS.
Results of the assessment of screening power towards different docking programs and different crystal structures of three different targets. The P-values, AUCs and EFs (EF1%, EF5%, EF10%) are enumerated
 |
|
aThe average of the P-values is calculated from the geometric mean of all the nine values produced by the same docking program, while the other criteria are got from the mean.
bP-value is obtained from the student’s t-test with a 95% confidence interval when the variance homogeneity is assumed.
cAUC represents the area under the ROC curve.
dGreen and red represent the best and worst results, respectively, and yellow represents the medium.
Results of the assessment of screening power towards different docking programs and different crystal structures of three different targets. The P-values, AUCs and EFs (EF1%, EF5%, EF10%) are enumerated
|
|
aThe average of the P-values is calculated from the geometric mean of all the nine values produced by the same docking program, while the other criteria are got from the mean.
bP-value is obtained from the student’s t-test with a 95% confidence interval when the variance homogeneity is assumed.
cAUC represents the area under the ROC curve.
dGreen and red represent the best and worst results, respectively, and yellow represents the medium.
When it comes to the performance of each individual docking program, it is difficult to determine which one has the best screening power due to the sensitivity to different target conformations. According to the AUCs for BRAF, GOLD_ASP (0.983), LeDock (0.971) and Glide SP (0.971) perform the best for 3IDP, while AutoDock Vina (0.933) becomes one of the top three for 4KSP. Therefore, in consideration of the complexity to make a comparison, we roughly took the average of the nine AUC values and nine P-values for each target, where the mean of AUCs and the geometric mean of the P-values were obtained. According to the averaged AUCs, LeDock (0.906), GOLD_ASP (0.897) and Surflex-Dock (0.891) perform relatively better, and AutoDock Vina (0.883) and GOLD_CHEMPLP (0.881) have a satisfactory performance as well. Furthermore, except for the ridiculous data towards 2HZ0, where the AUCs are remarkably poorer than the average, Glide_SP (from 0.855 to 0.894) and Glide_XP (from 0.858 to 0.881) can also yield acceptable results. Then, when the P-values were regarded as the criteria, another order can be obtained: Glide SP (3.05 × 10−79) > GOLD_ASP (1.01 × 10−78) > LeDock (1.56 × 10−75) > Glide_XP (3.21 × 10−70) > GOLD_CHEMPLP (1.45 × 10−63) > AutoDock Vina (3.64 × 10−58) > Surflex-Dock (1.76 × 10−56) > AutoDock (2.51 × 10−54) > GOLD_ChemScore (1.13 × 10−46) > GOLD_GoldScore (4.54 × 10⁻²⁷) > DOCK (2.18 × 10−07). Similarly, Glide_SP, GOLD_ASP and LeDock show good screening powers in terms of the P-values.
As indicated above, Glide, GOLD and LeDock may be the most applicable programs for the docking-based VS towards type II kinase inhibitors. However, both the P-values and AUCs may be easily affected by some extreme samples in the benchmark dataset, especially these molecules that cannot be docked into the pockets, so enrichment factors (EFs) were also used in the assessment, and EF1%, EF5% and EF10% are listed in Table 3. Based on the averaged EF values, Glide_SP (EF1% = 32.202, EF5% = 11.395 and EF10% = 6.592), Surflex-Dock (28.889, 11.807 and 7.000), GOLD_ASP (27.744, 12.064 and 7.158) and LeDock (26.481, 11.856 and 7.283) have the most comprehensive performance, which is generally consistent with the results obtained above.
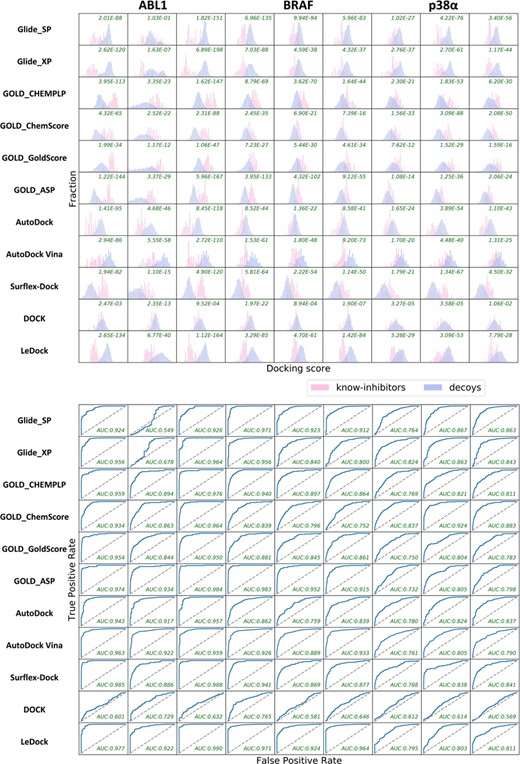
Distributions and ROC curves of the docking scores given by different docking programs for the known inhibitors and decoys towards nine different crystal complexes of three representative targets (ABL1, BRAF and p38α). The results from left to right are successively based on 2HYY (ABL1), 2HZ0 (ABL1), 3QRI (ABL1), 3IDP (BRAF), 3II5 (BRAF), 4KSP (BRAF), 1WBT (p38α), 2YIW (p38α) and 3K3I (p38α).
![Structural comparison of different ligand-ABL1 complexes. (A) The 3D structures of the aligned protein–ligand complexes. 2HYY, 2HZ0 and 3QRI are colored in cyan, magenta and green, respectively. (B–D) The 2D protein–ligand interaction diagrams for 2HYY, 2HZ0 and 3QRI, respectively, are shown. The ligand is colored in sea green, and the structures of the other two complexes are colored in gold. Red circles represent the structures aligned well in at least two complexes. The picture is produced by LigPlus [73].](https://oup.silverchair-cdn.com/oup/backfile/Content_public/Journal/bib/21/1/10.1093_bib_bby103/4/m_bby103f9.jpeg?Expires=1749145192&Signature=XlJZwRJkutWlxejvctWTytnrqO0ifG-nLy6LjLnHbnbhYUPtzN6gwTeqwF-WEDwsQSUMtmGbZ3P7IqIw5-fvCbrB8cGKe92TFiKNB~ilCYD5H7HEJ7-M06KuJiO4yEKVoeF07yBaks4KnTIvrJT3H-d9ARainPGyB2s83wBeB9lfiwKcaosYmGwia7o2wSf2XfQuyGnsXdQoC4TcbfKMEM1DHvtKSKexqHY~zBC4E4I5GC9cu4KPsjJpQHhM0LXXrgJNKBIf6OdzV0m6Jc35jSGClbZ8boADDWtQ9TuxbbRb8eR40UneqvNregyny5eawnFJA136EocHjKtxJLs-KQ__&Key-Pair-Id=APKAIE5G5CRDK6RD3PGA)
Structural comparison of different ligand-ABL1 complexes. (A) The 3D structures of the aligned protein–ligand complexes. 2HYY, 2HZ0 and 3QRI are colored in cyan, magenta and green, respectively. (B–D) The 2D protein–ligand interaction diagrams for 2HYY, 2HZ0 and 3QRI, respectively, are shown. The ligand is colored in sea green, and the structures of the other two complexes are colored in gold. Red circles represent the structures aligned well in at least two complexes. The picture is produced by LigPlus [73].
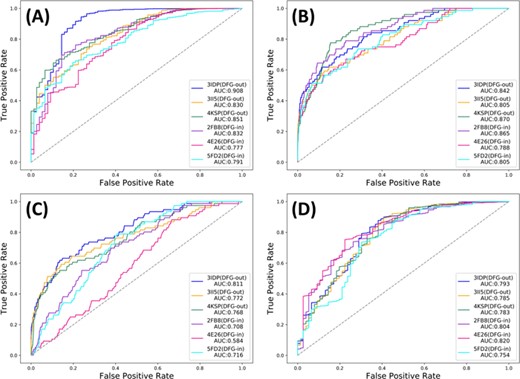
ROC curves based on different docking programs and different crystal structures of BRAF. (A) Glide_SP, (B) GOLD_ASP, (C) Surflex-Dock and (D) LeDock.
Discrimination of type II and type I kinase inhibitors in VS
To further explore the discrimination of type II and type I kinase inhibitors in VS, a pre-existing benchmark dataset containing both the type II and type I inhibitors was extracted from DUD-E and a decoy dataset was generated correspondingly. Then, taking BRAF as a case, three DFG-out conformations (3IDP, 3II5 and 4KSP) and three DFG-in ones (2FB8, 4E26 and 5FD2) were chosen, and four well-performed docking programs, including Glide_SP, GOLD_ASP, Surflex-Dock and LeDock, were used to dock all the molecules in the dataset to the six selected BRAF structures. The ROC curves and associated AUCs of each combination are shown in Figure 10.
As we can see, because the inhibitors in the dataset used here have not been categorized clearly in advance and the effects of type I inhibitors cannot be ignored, the AUCs obtained here are significantly smaller than those just based on the dataset with only type II inhibitors. Similar to the results shown in the previous section, the screening powers for the different conformations of a same target vary a lot. It is so surprising to observe that the results based on the DFG-out conformations are not always better than those based on the DFG-in conformations. According to our initial hypothesis, the ATP-binding site in a DFG-out conformation should be still accessible for most type I inhibitors, but the conventional ATP-binding pocket in a DFG-out conformation is not large enough to accommodate many type II inhibitors, thus potentially leading to the superiority of a DFG-out conformation in the VS of kinase inhibitors. After manual inspections, we found that the excessive numbers of oxygen and nitrogen atoms of type II inhibitors may lead to their acceptable docking scores for some wrong binding poses. Anyway, there is no doubt that type II and type I kinase inhibitors have almost completely different binding characteristics even they both occupy the same ATP-binding pocket. Therefore, when constructing a benchmark to assess a newly exploited docking program, it should be cautious if the kinase-related data are the component of the dataset.
Conclusion
An extensive assessment has been conducted to evaluate the performance of nine docking programs towards type II kinase inhibitors. In terms of sampling power, most tested docking programs can achieve satisfactory predictions towards type II kinase inhibitors with the success rates ranging from 0.80 to 0.90. Among all, Glide_XP, LeDock and GOLD_CHEMPLP perform the best based on the best-scored poses, whereas LeDock and Surflex-Dock have the best capability to find the best-matched poses among the several top-ranked poses. As for the scoring power, the score functions in GOLD and LeDock achieve the best correlations with the experimental data. When docking with only a local refinement is adopted, correlation coefficients of most programs can be improved obviously, suggesting that the overall performance of each program deeply depends on the sampling accuracy. From the perspective of type II inhibitors, based on the assessment of both the sampling power and scoring power, it seems that a small increase of molecular weight or the number of rotatable bonds of the ligands does not have remarkable effect on docking accuracy. As for the screening power, the initial protein conformations play a more important role than docking programs, and therefore it is difficult to compare different docking programs just based on a certain crystal structure. Roughly, in terms of P-values, AUCs and EFs (EF1%, EF5% and EF10%), Glide_SP, Surflex-Dock, GOLD_ASP and LeDock may have relatively better screening performance towards type II inhibitors. Besides, based on our dataset and another one extracted from DUD-E, we found that type II and type I inhibitors may affect each other severely in the assessment of a certain program, so it is necessary to distinguish them clearly when constructing a benchmark dataset. In conclusion, type II kinase inhibitors indeed have their own docking characteristics and the assessment results are significantly different from the ones conducted previously. These findings are expected to provide some valuable insights into the discovery of novel type II kinase inhibitors, as well as other allosteric inhibitors.
Nine popular docking programs were extensively assessed towards type II kinase inhibitors in terms of sampling power, scoring power and screening power.
Most tested docking programs succeeded in the accurate identification of near-native binding poses with the success rates ranging from 0.80 to 0.90.
The scoring functions in GOLD and LeDock outperformed the others in the prediction of relative binding affinities.
Glide with XP scoring, Surflex-Dock, GOLD with ASP scoring and LeDock had better screening power to discriminate between active compounds and decoys.
The screening power of the tested docking programs is sensitive to different initial conformations of the same target.
Funding
The National Key R&D Program of China (2016YFA0501701, 2016YFB0201700) and the National Science Foundation of China (81603031, 21575128, 81773632).
Chao Shen is currently a PhD student in the College of Pharmaceutical Sciences, Zhejiang University, China. His research interests lie in the area of computer-aided drug design, including the development of structure-based virtual screening methodologies and the design of small molecule inhibitors of several important targets.
Tingjun Hou received his PhD degree in 2002 from Peking University, China. He is currently a professor in the College of Pharmaceutical Sciences, Zhejiang University, China. His research interests include (1). development of structure-based virtual screening methodologies, (2). prediction of ADMET and drug-likeness, and (3). design and discovery of small molecular inhibitors of important protein targets. More information can be found at the web site of his group: http://cadd.zju.edu.cn.
References
