


Abstract
Analysis of DNA copy number profiles requires methods tailored to the specific nature of these data. The number of available data analysis methods has grown enormously in the last 5 years. We discuss the typical characteristics of DNA copy number data, as measured by microarray technology and review the extensive literature on preprocessing methods such as segmentation and calling. Subsequently, the focus narrows to applications of DNA copy number in cancer, in particular, several downstream analyses of multi-sample data sets such as testing, clustering and classification. Finally, we look ahead: what should we prepare for and which methodology-related topics may deserve attention in the near future?
INTRODUCTION
In the late 1990s, array comparative genomic hybridization (aCGH) technology was developed for the investigation of copy number changes on a genome-wide scale and at sub-megabase resolution in one single experiment [1]. In such an experiment, genomic DNA from test and reference sample are hybridized together on a glass slide containing an array of genomic sequences. When measured intensity log2-ratios are plotted according to the physical position of their corresponding probe on the genome, a genomic profile is obtained. Here, the log-scale is used to symmetrize positive and negative signals. Such a profile can be viewed as a chain of contiguous genomic regions in which probes share the same copy number, which can be inferred from the log2-ratio data.
Array CGH is applied primarily in clinical and tumor genetics. In clinical genetics, chromosomal aberrations and germ-line variations in patients or healthy individuals are studied [2]. In tumor genetics, the emphasis is usually on somatic copy number aberrations in individual cases or in series of profiles. Although this review discusses many analysis methods that apply to both research areas, it focuses on cancer applications, which require dedicated analytic tools.
DNA copy number may also be measured by single-channel arrays, such as provided by single nucleotide polymorphism (SNP) platforms [3]. The ‘comparative’ part (as in aCGH) is introduced after the hybridization, when the intensity signals obtained are ‘compared’ to normals on another array hybridized with normal DNA or pool of normal arrays. SNP arrays measure another dimension in addition to DNA copy number: loss of heterozygosity (LOH). Array CGH misses copy number-neutral LOH (also called acquired uniparental disomy in tumors), because such an LOH results in two copies, yet of identical origin. Array CGH is ubiquitously applied though, because it often outperforms SNP arrays for determination of copy number [3] and can be applied to formalin-fixed paraffin-embedded (FFPE) material, which is often the only material available. Copy number data from single-channel arrays may be analyzed very similarly to aCGH data, although performance of some of the preprocessing modules may be platform dependent. Hence, many methods discussed in this article are appropriate for both one- and two-channel data; if not, we mention the platform to which the method applies.
DNA copy number detection plays an increasingly important role in cancer research. The ultimate goal is to identify and narrow down chromosomal regions associated with tumor progression, survival and treatment success [4]. The current high-quality and high-resolution arrays provide the technical means for this purpose. Equally important are up-to-date analysis methods tailored to this data type. Many methods have become available since 2004. In the beginning, these methods mostly concerned analysis of individual profiles, e.g. segmentation. Later, multi-sample analysis approaches, such as testing and clustering, were considered. The consensus on analysis of copy number array data is not as strong yet as it is for the analysis of mRNA gene-expression data [5], probably due to the longer history of the latter. Care should be taken when transferring methods from one data type to the other. Where appropriate, we mention crucial differences between mRNA and copy number data plus the consequences for data analysis.
We aim to cover many aspects of DNA copy number analysis. We look back to the developed analysis procedures with a focus on methods that are relevant for the state-of-the art high-resolution copy number data. We distinguish preprocessing and downstream analysis. Preprocessing comprises all preliminary operations on the data necessary to arrive at the quantity of interest, being the copy number of a genomic segment for these data. It includes normalization, segmentation and calling of copy number aberrations. Downstream analysis comprises all operations on the pre-processed data, whether it be a simple descriptive analysis, hypothesis testing, clustering or prediction. Many preprocessing techniques are relevant for both clinical and tumor genetics, whereas downstream analysis is more specific. For tumor profiles, such analysis focuses on combining copy number data with other (clinical) data such as subtypes, tumor progression stadia, survival and treatment success.
Finally, we look ahead to data-analysis challenges which may emerge from new types of high-resolution copy number data and discuss a few unresolved methodological issues.
PRELIMINARY ISSUES
The chromosomal unit of interest
In DNA copy number experiments, there is no a priori unit of interest, as opposed to the majority of mRNA experiments, for which the genes as coding regions for proteins are a natural unit. By nature, the crucial DNA copy number events, aberrations, arise when a piece of DNA is either deleted or gained. Such a piece can be an entire chromosomal arm, but also just 1/106 of an arm. Chromosomal banding is available as well, but most aberrations take place within or across these bands. Depending on the desired resolution, an array with several thousands (cDNA or BAC clones) or even millions of elements (oligos) is used. We refer to those array elements as ‘probes’. The unit used is then often defined by the design of the array. Alternatively, a data-driven, variably sized unit, as discussed in the section on dimension reduction, may be preferred.
Design of the experiment
Most DNA arrays are dual channel, using normal tissue as reference material. As opposed to the mRNA normal reference, it is known what DNA reference material should reflect: copy number equal to 2, apart from the sex chromosomes and germ-line variations. This knowledge is useful for the identification of aberrant DNA parts. The reference material may be a pool of normal DNA or, for tumors, normal tissue DNA of the same person. The latter strategy implies that germ-line variations cancel out, but normal from the same tissue as the tumor may not always be available. These and other design issues such as choice of the array platform and collection of sample material are discussed in [6].
PREPROCESSING
Preprocessing is typically more complex for DNA copy number data than for mRNA data. Almost all researchers agree that at least some form of quality control, within array normalization and smoothing/segmentation, is needed. Whether additional steps are applied depends on data quality and planned downstream analysis.
Feature extraction, quality control and visualization
State-of-the-art copy number arrays deliver high-quality spots. Many researchers opt not to filter flagged spots as provided by feature extraction software. Otherwise, simple techniques such as K-nearest neighborhood imputation, where the neighborhood may be restricted to genomically close probes, may be used to impute the created missing values. Note that imputation is usually a matter of convenience, because many downstream multi-sample analysis modules require matrix input without missings.
Assessing the quality of copy number profiles is possibly the most subjective step in array analysis. Visual inspection of the data is still the most common practice. While mRNA array data are usually visualized by MA-plots, DNA copy number data are mostly displayed as profile plots such as Figure 1a, because these take the genomic order into account. A commonly used quality measure is the median absolute deviation (MAD), which is robust against outliers. Alternatively, the median of MADs or standard deviations as computed over a moving window may be reported. The latter is a more local assessment of the noise than the global MAD.
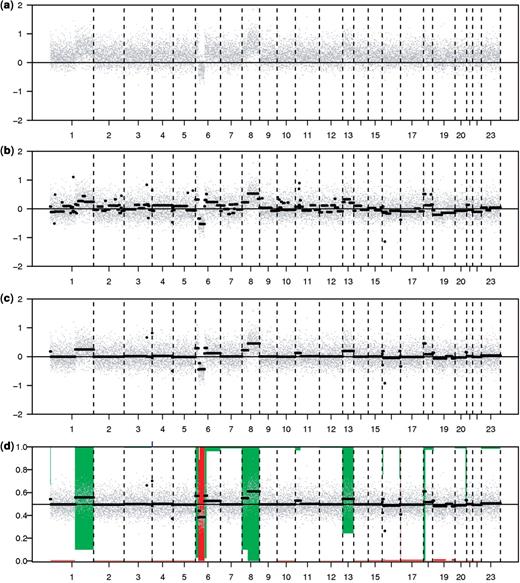
Preprocessing an aCGH tumor profile. (a) Raw data, (b) mode-normalized data. Segmentation shown for comparison with (c) de-waved plus segmented data, (d) called data. (a–d) genomic order on the x-axis. Chromosome 23 refers to the X-chromosome, while the Y-chromosome (24) is not shown. Grey dots indicate log2-ratios, segments are black horizontal lines. (a–c) log2-ratio sample/reference on the left axis. (d) Bars indicate posterior loss and gain probabilities. Probability scale on the left axis; reversed (“1”) for the gains. Amplifications are indicated by tick marks on the top axis.
Removing artifacts from genomic profiles
Artifacts may be caused by several technical and biological parameters such as: GC content, i.e. the local density of G and C nucleotides in probes or DNA hybridized; DNA sample quantity and quality; labeling efficiency of the dyes and cellularity, i.e. the percentage of normal cells in the biopsy. Subsequently, we discuss several methods to remove those artifacts.
High-resolution aCGH profiles may show wavy patterns (see Figure 1b). These waves appear to correlate with GC-content [7]. Presence of waves may hamper detection of (small) aberrations. Therefore, algorithms have been devised to remove waves for tumor profiles, either by regression on GC-content [8] or by regression on calibration profiles [9]. The first does not rely on calibration, while the second also removes artifacts not related to GC-content.
The assumptions of symmetry in the number of over- and under-expressed genes and of the majority being non-differentially expressed are the basis of most within-array normalization methods for mRNA data. These assumptions are not sustainable for aCGH data (see Figure 2 and [10]). Assuming that the bulk of probes corresponds to the 2-copy state, mode-subtraction is the best simple option, although the mode may be biased upward when a sample contains many gains. Alternatively, more advanced normalization methods are available [10, 11]. The first method fits a Lowess curve using a preliminary estimate of the most predominant copy number class, and applies the resulting correction curve to all the data. The second method detects a ridge—a two-dimensional mode—in the two-channel intensity density plot and then calibrates the two-channel signal on this ridge.
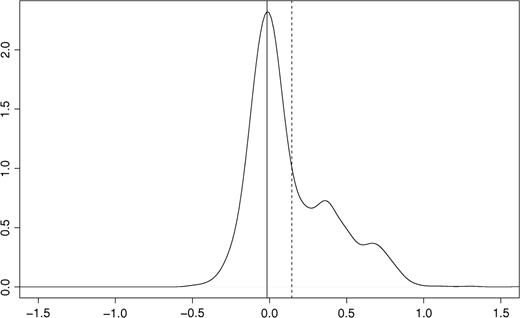
Density plot (smoothed histogram) for one tumor profile. Raw log2-ratios on the x-axis, relative frequency on the y-axis. Solid and dashed vertical lines correspond to mode and mean, respectively. Assuming that the largest mode corresponds to the normal two copy number state, gains are clearly present as opposed to losses.
Between-array normalization (quite common for mRNA arrays), such as scaling by the standard deviation or variance modeling, may do more harm than good for aCGH, given the potentially large proportion of aberrations in a DNA sample. However, in cancer data sets, it is wise to correct for cellularity, because normal cells dilute the signal of the cancer aberrations. Basically, for the measured ratio M, proportion tumor cells c and true ratio T we have: M = 1 − c + cT, because normal cells result in a ratio equal to 1. So, T = (M − (1 − c) / c.
Segmentation and calling of normalized copy number profiles
Recovering the segmental structure (Figure 1c) and the hidden discrete copy number values (Figure 1d) from the raw data are specific and well-studied preprocessing steps for the analysis of copy number data. While some consider ‘calling’ of chromosomal copy number as the ultimate goal, others concentrate on segmentation only. Calling may be performed after segmentation, or directly on the log2-ratio data. The latter approach is discussed first.
Calling consists of the assignment of discrete copy number states to probes. The number of states may vary, but covers, for diploid samples, at least ‘deletion’ (or ‘loss’; <2 copies), ‘normal’ (=2 copies) and ‘gain’ (>2 copies). Deletion may be further stratified as homozygous (0 copies) and heterozygous (1 copy), while gain includes single gain (3 copies), double gain (4 copies) and amplification (>4 copies). If {Y(xt)} denotes the sequence of ‘observed’ log2-ratios at coordinates {xt} on the genome, the aim is to recover {Z(xt)}, the corresponding ‘hidden’ sequence of copy number states. This task would resume to clustering if the data where not spatially ordered, but when interested in the copy number at xt it is likely that neighboring positions (xt−1, xt+1) provide information as well. As a consequence, many different modeling strategies have been considered to cluster genome-ordered data. An intuitive way to account for spatial dependency is to model the sequence {Z(xt)} as a Markov Chain, leading to hidden Markov chain models (HMM) with Gaussian emissions. Using HMMs leads to a probabilistic segmentation of the chromosomes into regions of homogeneous posterior probabilities for the ‘hidden’ states using Pr{Z|Y}. Such models have shown large flexibility to handle aCGH data-specific characteristics. For instance, the inter-clone physical distance is introduced to account for heterogeneities in the resolution of the investigated regions [12]. Clone overlap can also be accounted for in continuous-time models [13]. However, the corresponding computational strategies use iterative algorithms that may be prohibitive on large signals, especially for their fully Bayesian version [14].
Most alternative methods have not focused on the recovery of the ‘hidden’ sequence {Z(xt)}, but rather on the structure of the ‘observed’ data {Y(xt)}. Such segmentation methods assume that the data is organized into segments with homogeneous means. Consequently, segmentation methods have focused on the identification of breakpoints in the distribution of {Y(xt)} to delimit chromosomal aberrations. Circular binary segmentation (CBS) was one of the first-proposed methods, and was shown to be very robust and effective [15]. It is based on a sequential dyadic split of the data, using a statistic similar to the Student statistic and a P-value which gives information on the strength of the split. Bayesian segmentation has also been proposed to estimate the true level of segments with better accuracy [16]. All segmentation models are based on the assumption that chromosomal aberrations are delimited by abrupt changes in the signal. However, some data show more smooth transitions, possibly due to cell-to-cell variability in copy number [17]. In [17, 18], heavy-tailed random effects and wavelets are applied, respectively, for smoothing profiles. From the computational point of view, smoothing methods are very competitive. In addition, smoothing may result in a larger signal-to-noise ratio than segmentation, but tends to be less precise on segment boundaries [19].
One limitation of segmentation methods is that these do not provide information about the sequence {Y(xt)} of copy number states. ‘Merging’ steps have been proposed as a posteriori calling on segment level. These strategies are based on statistical tests [20] or on mixture models [21, 22], which also return posterior call probabilities. This downstream step was shown to be of ‘paramount importance’ when using segmentation for aCGH [20]. The merging step only constitutes a second-stage procedure. Segmentation can, however, also learn from the calling step in a unified model to detect breakpoints that correspond to changes in copy number states and not only to changes in the mean of the signal [22]. Most current calling methods do not result in an estimate of the actual copy number. Copy number arrays that also contain probes for interrogating SNPs provide allele specific frequencies. These were shown to be useful in estimating a more exact copy number [23]. Tumor heterogeneity, referring to the presence of different cell subpopulations in a sample, may hamper accurate estimation of copy number. In [24] tumor heterogeneity is accounted for by modeling the observed log2-ratio as a function of two calibrated parameters and a weighted sum of subpopulation contributions.
A comparison of 11 segmentation methods showed that these perform consistently well on simulated and real data sets [19]. However, these methods ignore inter-clone distance, and their computational burden is O(n2) when n is the number of probes. In practice, this is partly solved by applying the methods to subparts of the profiles (such as chromosome arms). Combining wavelet-denoising and segmentation appears to be very promising from detection and computational efficiency perspective [25].
Overall, every strategy has its advantages and drawbacks. Initiatives such as ADaCGH [26], which combines many detection algorithms, are very valuable. Because >30 competitive methods have been published since the useful comparison studies [19, 20], an update to these studies that also accounts for computational efficiency will be welcomed by the community.
Sample measured on multiple platforms
Recently, existing preprocessing methods have been challenged by the availability of multiple DNA copy number profiles of the same sample measured on different platforms. Issues such as resolution/coverage, signal (intensities versus log2-ratios) and platform-specific artifacts need to be resolved before such data can be combined. Papers on this subject recently appeared [27, 28]. In the first, a normalization method to make such data from different platforms more comparable is proposed, while in the latter CBS [15] is extended to arrive at a sample’s consensus segmentation profile from its multiple DNA copy number profiles.
DOWNSTREAM ANALYSIS
Copy number log2-ratios data undergo several preprocessing steps, each of which yields a different data type: normalized log2-ratios, segmented log2-ratios, (discrete) calls or call probabilities. There appears to be little consensus on which is most appropriate for what downstream analysis method. Below we discuss such methods and we specify the data type to which the method is applicable.
Dimension reduction for identifying copy number units
Dimension-reduction techniques, such as principle component analysis, are commonly used for creating more stable features in mRNA array data analysis, e.g. for the purpose of sample classification. For aCGH data, dimension reduction serves many more purposes.
The increasing resolution of the DNA copy number arrays enables us to detect very small (focal), but nevertheless relevant, aberrations [29]. Large aberrations may cover entire chromosomes in tumor profiles. Generally, the length of an aberration does not determine its importance. If one leaves the data dimension unchanged, large aberrations will mainly drive multivariate downstream analyses like clustering. In addition, a high number of probes may severely challenge multiple testing corrections, which are usually too conservative for such highly positively correlated data. Therefore, it is useful to apply data-driven dimension reduction.
In [30], regions of consecutive probes are determined that have (nearly) the same call-signature, which is the vector of calls over the samples. The acceptable amount of information lost by this operation is set a priori. The size of the regions varies: the algorithm adapts the resolution to the number of locally observed copy number changes. The data is then reduced to these regions and the medoid signature of all probes in the region. The advantage of using regions instead of calls was demonstrated for testing [30] and clustering [31].
Statistical testing for association with clinical data
An immediate question for multi-sample cancer profiles is: which probes or DNA regions are significantly associated with clinical outcome, such as survival, tumor progression stadia, relapse, treatment success, etc? The assumption of Gaussian distributions is often used for mRNA data. However, implicit to the nature of copy number data, this assumption can not be maintained, irrespective of the data type used (see Figure 3). For non-discretized data, one may consider using standard rank tests such as Wilcoxon–Mann–Whitney, although these are designed to have power for shift rather than multi-modality. A tailored nonparametric test for detecting multi-modality may be more suitable [32]. For calls, common nonparametric tests like chi-square or log-rank tests (survival data) may be used. It is wise to propagate uncertainty of the calls into the testing by using call probabilities, thereby achieving superior power [33].
![Visualizations of unsegmented, segmented and called data for clone CTD-2371A5 (16p-arm) in ER+ and ER− breast cancer samples [35]. Density plots indicate the smoothed relative frequencies of log2-ratios (x-axis) in the ER+ (solid) and ER− (dashed) groups. (a) Normalized, unsegmented data and (b) segmented data and call frequencies (loss, normal and gain) as vertical bars.](https://oup.silverchair-cdn.com/oup/backfile/Content_public/Journal/bib/12/1/10.1093/bib/bbq004/2/m_bbq004f3.jpeg?Expires=1750261414&Signature=qPORJssGH5naXikUS3QeuLJAjdb0tgfAgV7Q~EJWHAlmkPddmvNQx1PoGK5s~eiMhY1ELIFWholEGWA~aiqHjVM397jsIdx6OHKMrLcDadJRrP5ViaUxJmSrSGphi67LFvvAncggqyfdSVWiNavpXmG~MzU2vaEgaIF~cIv9-xlI7WJXUOornDFZ8NcW-vXSdSB2-T-CCxyVAcK8O7xNvn9LbiaB-ScVDpwpw4SgIPGyPHE3i7HnVh0JsnXgd04wUHi8qlkr8WzGAiO-Zo0uqXjyHDcRXs169VbPPaY2O8NqOtTUb546tQtS-UZhGvyedzzzVvGLEOwFDpflgP44gQ__&Key-Pair-Id=APKAIE5G5CRDK6RD3PGA)
Visualizations of unsegmented, segmented and called data for clone CTD-2371A5 (16p-arm) in ER+ and ER− breast cancer samples [35]. Density plots indicate the smoothed relative frequencies of log2-ratios (x-axis) in the ER+ (solid) and ER− (dashed) groups. (a) Normalized, unsegmented data and (b) segmented data and call frequencies (loss, normal and gain) as vertical bars.
Correction for multiple testing is essential, as for all high-throughput data. Powerful methods to control False Discovery Rate (FDR) and Family Wise Error Rate (FWER) for discrete data such as the calls are provided in [34].
Clustering of samples for subtype discovery
The discovery of subtypes is the aim of cluster analysis. It seeks meaningful data-determined groupings of samples, such that the samples within groups are more ‘similar’ than the samples across groups. Cancer of a particular tissue type is often a collection of multiple different diseases. This may be reflected in DNA copy number profiles of samples of such a cancer. In fact, DNA copy number data have been successfully used to identify molecular subtypes.
Subtype identification on the basis of DNA copy number data was initially done using clustering approaches designed for analysis of mRNA data (e.g. [36, 37], using normalized and segmented DNA copy number data, respectively). More recently, tailor-made clustering methods for DNA copy number data have been published. Roughly, these can be divided in distance and model-based approaches, both are discussed below.
At present only a few distance-based approaches, tailor made for clustering of called copy number data, have been published: a K-means approach [38] and WECCA, a hierarchical clustering method [31]. Each method develops similarity measures to deal with the discrete nature of called data, with the similarity measure in [38] being a special case of those proposed in [31]. Reducing the calls to (minimal common) regions before clustering causes a desired effect of small amplifications (focals) contributing equally to the similarity measure as long ‘dull’ chromosomal areas with normal DNA copy number [31]. A similar approach is taken in [39]. Use of (minimal common) regional copy number data in combination with a similarity measure tailor made for discrete data yields clusterings with the best stability (I. Brito et al., manuscript in preparation).
Alternatively, subgroups of samples have also been discovered by the use of dimension-reduction techniques such as principal component analysis (PCA; [40, 41]). Clusters are identified from the resulting low-dimensional PCA plot by visual inspection for groups of samples that occupy well-separated subspaces of the plot.
Subtypes discovery is also done using model-based clustering. Given the number of clusters k, a mixture of k HMMs is used in [42]. Each HMM models the observed log2-ratios arising from an underlying aberration profile. The HMM mixture model is fit by iterative application of a coordinate ascent algorithm. The number of clusters is determined by optimizing the Silhouette coefficient over models with different numbers of clusters. Finally, for each cluster the latent vector of calls, that represents the pre-dominant DNA copy number aberration profile of the samples in the cluster, is estimated.
No studies have been performed yet that quantitatively compare distance- and model-based methods alongside. Distance-based methods may be favored for their philosophical simplicity and visualization by means of dendrogram and heatmap. A model-based approach has the advantage of a statistical model with (interpretable) parameters at its core. Without such comparison studies the method that yields the most stable identified subtypes (to be assessed, e.g. by bootstrapping) may be preferred.
Classification by genomic profile for prognosis and diagnosis
Classification aims to construct a rule (classifier) which assigns objects (e.g. tumors) to pre-specified classes on the basis of measurements (e.g. their genomic profile) on these objects. Classifiers constructed from mRNA profiles have been successfully used in the prognosis of clinical outcome and disease diagnosis. DNA copy number profiles may potentially be used for the same purpose. If this potential is fulfilled, DNA copy number-based classifiers have a major advantage over their gene expression-based counterparts. The DNA molecule is much more stable than the mRNA molecule. Moreover, unlike mRNA expression, DNA copy numbers are not sensitive to environmental and circadian rhythms. Finally, the number of independent dimensions in the data is lower than for mRNA, which may result in more stable classifiers and features. DNA copy number classifiers (when shown to be specific and sensitive) are thus more practical to use in clinical practice.
Neither the application of, nor methodology for, prediction analysis using high-throughput DNA copy number profiles is abundant. Support vector machines (SVM) with a pre-specified number of features (to be optimized a posteriori) are used to classify tumors from normalized aCGH data [43, 44]. An SVM is also used in [45] (modified in [46]), but with a pre-selected set of genomic intervals consistently exhibiting an excessive signal (rather than the probes themselves) as features. When comparing three traditional classifiers (k-nearest neighbor, naive Bayes and SVM) on one aCGH data set, SVM was found to perform the best [47].
Two tailor-made copy number classifiers have been proposed [48, 49]. We discuss the former: a ‘fused SVM’ for classification with normalized aCGH data. The fused SVM is a regular SVM with a hinge loss function subject to two parameter constraints (penalties). The first is the standard LASSO penalty that shrinks feature contributions toward zero, whereas the second shrinks the difference of the contributions of two successive features. The latter is desirable for aCGH data due to extremely high correlation between successive features. The SVM is fitted with a convex optimization procedure using cross-validation to tune penalty parameters. Application to bladder and melanoma tumors shows promising results.
No independent, full-scale comparison study of the classification methods above has been published. The advantage (as opposed to clustering), however, for classification is that true labels are known for at least a subset of the samples and, hence, cross-validation and/or bootstrapping may be used to select the most promising classifier.
Detection of recurrently aberrated regions in tumor profiles
Identifying aberrations that are present in a large proportion of samples in a tumor set may narrow down the search for causal genes. Consequently, an important research direction is the identification of recurrent regions of alteration, i.e. genomic regions that are aberrated in a substantial proportion of the samples. Despite an apparent simplicity in the notion, there is no consensus on a formal definition of recurrent regions as many scenarios may correspond to relevant biological situations [50]. For instance, gains and losses may be considered separately or not, and determination of a relevant threshold for the fraction of samples containing the aberration is difficult. An attempt has been to add the condition for a recurrent region to be more frequently aberrated than neighboring regions, leading to the concept of ‘minimal regions of overlap’, which is a recurrent region that does not contain any smaller recurrent region [51]. Algorithms for detecting recurrent regions differ by several properties such as: input (unsegmented, segmented, called data, etc.), output (P-values available or not), use of biological knowledge and ability to detect sample subsets. Considering called data as input has the advantage of reducing noise, but it may result in a decrease in the sensitivity of prediction [52]. An alternative is to use call probabilities in the computation of recurrent regions. The advantage of using these probabilities rather than log2-ratios is that inter-array differences in those log2-ratios are avoided [53]. Finally, a different strategy that accounts for the amplitude of aberrations in the raw data is the use of hierarchical HMMs to jointly model patient-specific alterations and shared alterations using a ‘master’-process [54]. These algorithms and the corresponding software have been extensively reviewed in [50, 52].
OUTLOOK AND DISCUSSION
Many existing methods for downstream analysis do not make full use of the richness of high-resolution data and available data bases. Subsequently, we consider types of information other than (relatively large) aberrations which deserve attention when developing new analysis methodology.
Germ-line copy number variations (CNVs) are small parts of the genome of which the copy number can vary between healthy individuals. These CNVs can be as large as 3 Mb [55] and cover 12% of the human genome [56]. The extent of CNVs was only recently discovered due to the increasing resolution of aCGH (≤100 kb resolution). High-resolution aCGH not only exposed the extent of these germ-line variations, but also that of focal aberrations (≤3 Mb) in cancer, which are thus somatic [57].
CNVs are immediately observed when healthy individuals are directly hybridized against each other, as gains or losses in a flat background. CNVs and focal aberrations add new dimensions to the analysis of aCGH experiments. For cancer samples, one prefers to detect germ-line and somatic mutations separately. Germ-line CNVs can be indicated by using public databases like http://projects.tcag.ca/variation/. Better still, tumors are now frequently hybridized against normal DNA from the same individual, such that only chromosomal aberrations are detected [57]. When normal DNA is available for a subset of samples only, candidate locations of focal aberration can be extracted from this set, after which recurrence can be calculated for the entire set [29].
The impact of CNVs and focal aberrations on tumorigenesis needs to be evaluated. Inherent to their size, such aberrations encompass only one or few genes. This makes integration with mutation, clinical variables and/or expression data enormously attractive since driver genes are relatively easy to identify [29]. For incorporation in downstream analysis, proper dimension-reduction techniques are essential, such that these small aberrations do not disappear against the background of large tumor aberrations. Alternatively, separate analysis modules are applied to CNVs and somatic aberrations. CNVs can also be implemented in genome-wide association studies, using methodology developed for the analysis of SNP-association studies [56]. Yet the amount of CNVs is lower than the amount of SNPs rendering less severe multiple-testing corrections.
The ultimate resolution for detecting CNVs or focal aberrations is next-generation sequencing, termed digital karyotyping when used for copy number detection [58]. Note that digital karyotyping is still more costly than aCGH. Moreover, the same and more focal aberrations are detected in a small series of tumors by using arrays as with digital karyotyping [29]. Digital karyotyping requires different preprocessing techniques, because it provides count data rather than intensities. Moreover, computational efficiency is extremely important. To make optimal use of the information provided by digital karyotyping, data-adaptive dimension-reduction techniques like [30] need to be further developed, possibly leading to a multi-resolution representation of the data. Such a representation is necessary to allow identification of very small markers, while maintaining power at a coarser scale. Dimension reduction may also be necessary to relieve the computational burden for downstream analysis. We anticipate that, when digital karyotyping data are properly preprocessed and compressed, only limited adjustments to the methodology used for the analysis of copy number-array data are needed.
A large advantage of next-generation sequencing with respect to arrays is that it provides more information than copy number alone using a single measurement device, such as mutations, SNPs, unbalanced translocations and inversions. Therefore, an enormous challenge is the development of efficient downstream-analysis methods for these data that integrate those sources of information. Integrative analysis is also needed for experiments, where alongside DNA copy number data other high-throughput measurements (e.g. gene expression, methylation, microRNA expression) are generated from the same individuals. Integration is a vast area, requiring specific methods for the type of molecular markers studied. From the methodological point of view, integration involving copy number data is a young field, likely to extend quickly in the near future.
The field of copy number data analysis has received a lot of attention the last few years, resulting in a large variety of preprocessing algorithms (in particular, segmentation) and algorithms for determining recurrent regions. To a lesser extent, dedicated methods for downstream analysis, such as testing, clustering and classification, have been developed. One important topic that is missing in the current literature is sample-size determination for aCGH experiments. Several sources are available for mRNA and SNP experiments, but the breakpoint nature of copy number data does not allow the use of such methods directly. Moreover, while exploratory analysis for determining co-aberrated regions in a set of tumors is quite common, we believe a structural, multivariate approach to this problem may lead to promising hypotheses on tumorigenesis. To account for the extra dimensions added by CNVs and focal aberrations, a completely new class of analysis methods for high-resolution copy number data of tumor samples is needed. Inclusion of prior information from the CNV databases in the downstream analysis could be valuable. To this extent, model-based strategies could be particularly efficient to estimate the probability for an aberration to be somatic or germ-line.
In short, methodology for the analysis of high-resolution copy number data has grown toward a substantial research field. However, many challenges remain, in particular, to account efficiently for the increasing resolution and to unravel the role of copy number in the context of multiple genomic data types.
Inherent to its nature, copy number data requires dedicated analysis methods
For several types of analyses such as segmentation/smoothing, clustering and classification, full-scale comparisons studies would be highly valuable.
Data-adaptive dimension-reduction methods are essential for dealing with the increasing resolution of copy number data.
Joint analysis of copy number variations and aberrations of (highly) variable sizes may lead to new insights on tumor biology.
References
Appendix: software
We present two tables of software resources for array CGH data analysis. We mostly cite R software from the repositories CRAN [59, http://cran.r-project.org/] & Bioconductor [60, http://www.bioconductor.org]. Additional R-software for aCGH analysis is discussed in [61]. For software references on recurrent regions refer to [50].
Software for preprocessing aCGH profiles
| Reference | Source | Name | Platform |
|---|---|---|---|
| Removing wave-like artifacts | |||
| Diskin et al. [8] | http://www.openbioinformatics.org/penncnv/ | PennCNV-gcmodel | Stand-alone |
| Van de Wiel et al. [9] | http://www.few.vu.nl/∼mavdwiel/nowaves.html | NoWaves | R |
| Normalization | |||
| Staaf et al. [10] | CRAN | popLowess | R |
| Chen et al. [11] | http://ntumaps.cgm.ntu.edu.tw/aCGH supplementary/ | Matlab | |
| Segmentation, smoothing and calling | |||
| Marioni et al. [12] | Bioconductor | snapCGH | R |
| Rueda et al. [14] | CRAN | RJaCGH | R |
| Olshen et al. [15] | Bioconductor | DNAcopy | R |
| Rancoita et al. [16] | http://www.idsia.ch/∼paola/mBPCR/ | mBPCR | R |
| Huang et al. [17] | http://www.meb.ki.se/∼yudpaw/ | smoothseg | R |
| Van de Wiel et al. [21] | Bioconductor | CGHcall | R |
| Picard et al. [22] | CRAN | segclust | R/C++ |
| Pique-Regi et al. [25] | http://biron.usc.edu/∼piquereg/GADA/GADA.html | GADA | Stand-alone |
| Díaz-Uriarte et al. [26] | http://adacgh.bioinfo.cnio.es/ & CRAN | adaCGH | Stand-alone & R |
Software for aCGH data analysis
| Reference | Source | Name | Platform |
|---|---|---|---|
| Data-driven genomic regions | |||
| Van de Wiel et al. [30] | Bioconductor | CGHregions | R |
| Testing | |||
| Gonzalez et al. [33] | http://www.creal.cat/jrgonzalez/software.htm | CNVassoc | R |
| Clustering of samples | |||
| Van Wieringen et al. [31] | http://www.few.vu.nl/∼wvanwie/software/software.html | WECCA | R |
| Liu et al. [38] | Upon request | Unspecified | Unspecified |
| Shah et al. [43] | http://www.cs.ubc.ca/∼sshah/acgh | CNA-HMMer | Matlab |
| Classification | |||
| Rapaport et al. [49] | Upon request | fused-SVM | Matlab |
