


Abstract
Competitive endogenous RNA (ceRNA) represents a novel layer of gene regulation that controls both physiological and pathological processes. However, there is still lack of computational tools for quickly identifying ceRNA regulation. To address this problem, we presented an R-package, CeRNASeek, which allows identifying and analyzing ceRNA–ceRNA interactions by integration of multiple-omics data. CeRNASeek integrates six widely used computational methods to identify ceRNA–ceRNA interactions, including two global and four context-specific ceRNA regulation prediction methods. In addition, it provides several downstream analyses for predicted ceRNA–ceRNA pairs, including regulatory network analysis, functional annotation and survival analysis. With examples of cancer-related ceRNA prioritization and cancer subtyping, we demonstrate that CeRNASeek is a valuable tool for investigating the function of ceRNAs in complex diseases. In summary, CeRNASeek provides a comprehensive and efficient tool for identifying and analysis of ceRNA regulation. The package is available on the Comprehensive R Archive Network (CRAN) at https://CRAN.R-project.org/package=CeRNASeek.
Introduction
The crosstalk between competitive endogenous RNAs (ceRNAs) through miRNA co-regulation represents a novel layer of gene regulation [1, 2]. The regulation among ceRNAs plays critical roles in the development and progression of cancer [3, 4]. These ceRNAs act as molecular sponges for a miRNA through their miRNA response elements (MREs), thereby regulating other target genes of the respective miRNAs. Understanding this novel type of RNA crosstalk will lead to significant insights into regulatory networks and has implications in human cancer development and other complex diseases [5, 6].
With the development of high throughput sequencing technology, numbers of ceRNAs have been discovered across different kinds of cancer [7, 8]. The identified ceRNAs include mRNAs, long non-coding RNAs [9], as well as circular RNAs [10]. Since it is time and cost consuming for identifying the genome-wide ceRNA regulation, computational methods have been instrumental in prediction of ceRNA interactions. However, these methods are scattered in literature and there is still lack of tools to perform these commonly used computational methods.
To address this need, we developed the R package CeRNASeek. This package is based on miRNA target prediction algorithms for analysis. The users can input miRNA–target regulation and paired miRNA/gene expression across samples. This package provides six commonly used computational methods [11], two for global ceRNA regulation prediction and four for context-specific prediction, to identify the ceRNA–ceRNA interactions. In addition, this package provides several network analysis modules for viewing the constructed ceRNA–ceRNA network and analysis of the topological features. At the same time, users can also perform functional annotations for predicted ceRNA–ceRNA pairs and prognosis analysis based on high and low differential expression. In summary, CeRNASeek provides a user-friendly way to identify and analysis of ceRNA regulation in cancer.
Materials and methods
Methods for identifying ceRNA–ceRNA interactions
The ceRNA–ceRNA interactions are evaluated from three aspects, including the co-regulation by miRNAs, co-expression between two RNAs of interest and MREs related to miRNAs and targets (Figure 1). The CeRNASeek package provides six computational methods to identify the global or context-specific ceRNA–ceRNA regulation. The details of these six computational algorithms in CeRNASeek are summarized in Figure 2 and Table 1. Briefly, the input of this package includes miRNA–target regulation, and/or paired miRNA/target RNAs expression and/or MRE. Two columns are required for the miRNA–target regulation, the 1st column is miRNAs and the 2nd column is targets. The miRNA or gene expression is a matrix, where the rows represent miRNAs or RNAs and the columns represent cancer patients. The MRE file is with five columns, including miRNA, target, energy and gap (two columns) [12]. In total, there are six major functions included in this package.
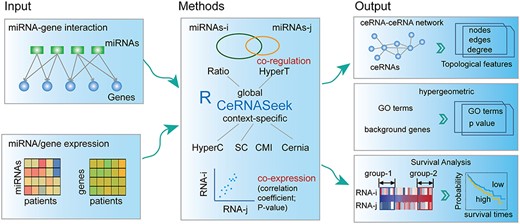
The flowchart for identifying ceRNA–ceRNA interactions based on CeRNASeek package. The users can input the miRNA–gene regulation and/or miRNA, gene expression profiles across patients and/or MRE. The global or context-specific ceRNA–ceRNA interactions can be identified based on co-regulation of miRNAs and co-expression and MRE relation pairs between genes of interest. Finally, the constructed ceRNA–ceRNA network can be displayed and several topological features can be outputted or exported to a file. The user can perform functional enrichment and survival analysis based on the predicted ceRNA pairs.
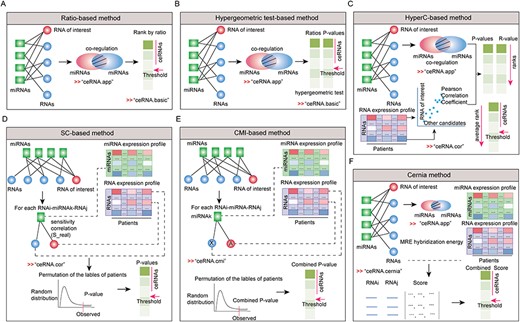
The methods for identifying miRNA-mediated ceRNA interactions. (A) Ratio-based method. (B) HyperT method. (C) Combination of hypergeometric test and co-expression correlation method. (D) SC-base method. (E) CMI-based method. (F) The cernia-based method.
Summary of computational approaches for identifying miRNA-mediated RNA–RNA interaction
| Methods | Input data | Advantages | Disadvantages | PMID |
|---|---|---|---|---|
| Ratio | miRNA–target regulation | • Simple and fast | • The number of ceRNA is greatly overestimated | 27365046 |
| • Ignore expression data | ||||
| HyperT | miRNA–target regulation | • Simple and statistically significant | • The number of ceRNA is greatly overestimated | 24297251 |
| HyperC | miRNA–target regulation; RNA expression | • Simple and statistically significant | • Ignore non-linear interactions | 26304537 |
| • Ignore miRNA expression data | ||||
| SC | miRNA–target regulation; miRNA and RNA expression | • Evaluate the influence of miRNAs using SC | • Ignore MREs information | 25033876 |
| CMI | miRNA–target regulation; miRNA and RNA expression | • Consider non-linear interactions | • Ignore MREs information | 22,000,015 |
| • Time consuming | ||||
| Cernia | miRNA–target regulation; miRNA and RNA expression; MREs | • Contain MREs information | • Ignore non-linear interactions | 31077152 |
The ‘ceRNA.basic’ identifies the ceRNA pairs based on ratio-base prediction or hypergeometric test-based prediction. For ratio-base prediction, this method ranks the candidate RNAs by the proportion of common miRNAs. The ratio is calculated as follows:
|$\mathrm{Ratio}\Big(\mathrm{j}\Big)=\frac{{\mathrm{miRNA}}_{\mathrm{i}}\cap{\mathrm{miRNA}}_{\mathrm{j}}}{{\mathrm{miRNA}}_{\mathrm{j}}},$| j∈S (2)where |${\mathrm{miRNA}}_{\mathrm{i}}$| is the miRNA set that regulated RNA i and |${\mathrm{miRNA}}_{\mathrm{j}}$| is the miRNA set that regulated RNA j; S is all candidate gene sets. For hypergeometric test-based prediction, we calculate the significance of common miRNAs for each RNA pairs. The probability P is calculated according to
|$P=1-F\Big({N}_{\mathrm{X}\mathrm{Y}}-1\mid N,{N}_{\mathrm{X}},{N}_{\mathrm{Y}}\Big)$| = 1-|$\sum_{t=0}^{N_{\mathrm{X}\mathrm{Y}}-1}\frac{\Big(\genfrac{}{}{0pt}{}{N_{\mathrm{X}}}{t}\Big)\Big(\genfrac{}{}{0pt}{}{N-{N}_{\mathrm{X}}}{N_{\mathrm{Y}}-t}\Big)}{\Big(\genfrac{}{}{0pt}{}{N}{N_{\mathrm{Y}}}\Big)}$| (3)where N is the number of all miRNAs of human genome, |${N}_{\mathrm{X}}$| and |${N}_{\mathrm{Y}}$| represent the total number of miRNAs that regulate RNA X and Y, respectively. |${N}_{\mathrm{XY}}$| is the number of miRNAs shared between RNA X and Y. This function can be used to identify the global ceRNA partners based on the extent of miRNA co-regulation. Here, two criteria are considered, including the proportion of miRNAs that co-regulated the RNAs of interest and the statistical significance [5]. The users can specify the ‘Ratio’ or ‘HyperT’ methods to be used.
SC =|${R}_{\mathrm{XY}}-\frac{R_{\mathrm{XY}}-{R}_{\mathrm{XM}}{R}_{\mathrm{MY}}}{\sqrt{1-{R}_{\mathrm{XY}}^2}\sqrt{1-{R}_{\mathrm{MY}}^2}}$| (5)
where |${R}_{\mathrm{XY}}$|, |${R}_{\mathrm{XM}}$| and |${R}_{\mathrm{MY}}$| represent the PCC between RNAX and RNAY, RNAX and miRNAM and RNAY and miRNAM, respectively. Finally, a random background distribution of the SC is generated for the significant correlation by calculating the score SC of randomly selected RNA–miRNA–RNA pair. Based on ceRNA.cor function, the users can customize the number of shared miRNAs in a RNA pair. By default, only RNA–RNA pairs that are co-regulated by at least one miRNA are considered in analysis.
In addition, ‘ceRNA.cmi’ also provides a lot of built-in parameters for users to select. Based on the ‘cutoff’ parameter, the candidate ceRNA–ceRNA pairs, CMIs and P-values will be outputted. The users can specify the RNAs of interest for analysis based on ‘targetce’ parameter. Otherwise the tool will analyze the list of all RNA pairs inputted by users.
The ‘ceRNA.cernia’ uses seven scoring indicators to predict ceRNA interaction pairs [16]. The seven scoring indicators are the fraction of common miRNAs, the density of the MREs for all common miRNAs, the distribution of MREs of the candidate RNA–RNA pairs, the proportion between the all number of MREs for a candidate miRNA sponge compared with the number of miRNAs that yield these MREs, the density of the hybridization energies related to MREs for all shared miRNAs, the DT-Hybrid recommendation score and the Pearson correlation between candidate RNA–RNA pair expression data. This method combines miRNA and target RNA regulation, miRNA and target RNA expression profiles, MREs and their hybridization energy matrix. Finally, seven scores are integrated into a comprehensive score and standardized for dispersion. Users can filter possible ceRNA pairs based on ‘cutoff’ parameter. Similarly, the ‘targetce’ parameter can specify a RNA of interest for analysis, such as ‘targetce = “PTEN”’.
Methods for analyzing ceRNA–ceRNA interactions
CeRNASeek also provides several modules for analysis of the predicted ceRNA–ceRNA interactions, including network analysis, functional enrichment and survival analysis.
The ‘ceRNA.Net’ can be used to visualize and analyze the identified ceRNA–ceRNA network (Figure 3A). The network can be visualized as weighted or unweighted network. The weights are defined as the number of co-regulating miRNAs. In addition, the basic topological features (such as degree, closeness, betweenness and centrality) of the ceRNAs can be outputted or exported to files.
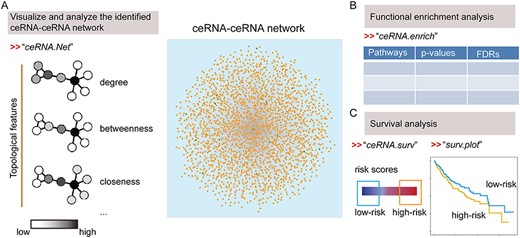
The modules in CeRNASeek for analysis of predicted ceRNA interactions. (A) CeRNA network construction and topological features analysis. (B) Functional enrichment analysis based on hypergeometric test. (C) Survival analysis based on ceRNA ternary relationship pairs.
The ‘ceRNA.enrich’ function is a module for functional enrichment analysis based on the identified ceRNAs. This function identifies the significantly enriched Gene Ontology (GO) terms by hypergeometric test. The P-values are adjusted by Benjamini–Hochberg method and the enriched GO terms, P-values and adjusted P-values are returned to users (Figure 3B).
|$\alpha =\frac{{\mathrm{HR}}_{\mathrm{i}}}{\Big({\mathrm{HR}}_{\mathrm{i}}+{\mathrm{HR}}_{\mathrm{j}}\Big)}$|,|$\beta =\frac{{\mathrm{HR}}_{\mathrm{j}}}{\Big({\mathrm{HR}}_{\mathrm{i}}+{\mathrm{HR}}_{\mathrm{j}}\Big)}$|where |${\mathrm{HR}}_{\mathrm{i}}\kern0.5em \mathrm{and}\ {\mathrm{HR}}_{\mathrm{j}}$| represent the hazard ratio of |${\mathrm{RNA}}_{\mathrm{i}}\mathrm{and}\ {\mathrm{RNA}}_{\mathrm{j}}$| in cox regression analysis. The top-ranked 25% and bottom-ranked 25% patients are defined as high- and low-risk groups (Figure 3C). Moreover, the function also supports dividing the samples into a training set and a test set for survival analysis. By default, the function uses all the samples in analysis. According to the user’s parameter settings, this function will execute different computational pipelines.
The ‘surv.plot’ can be used to plot the Kaplan–Meier survival curve for different groups of patients (Figure 3C). The ‘index’ parameter is used to define which ceRNA triple pair will be visualized. Similarly, this function supports the separation of patients into training sets and test sets. If the user enters the training set and test set, the function will plot the survival curves of two data sets on the same canvas.
Genome-wide miRNA and gene expression across cancer types
The miRNA and gene expression datasets generated by The Cancer Genome Atlas (TCGA) Research Network were used in our applications. In total, 33 cancer types were analyzed. The gene-level expression was evaluated as Fragments Per Kilobase of transcript per Million mapped reads (FPKM). A miRNA with missing values in >10% of the samples was removed. Our analysis primarily focused on samples with both gene expression and miRNA expression data. Moreover, we also downloaded the clinical information for tumor patients from TCGA project, including survival status, stages, grades, gender, age, survival time and response to chemotherapy.
Identification of survival-related ceRNAs
The clinically actionable genes (CAGs) were obtained from one recent study [17]. We identified ceRNA candidates based on the ‘ceRNAseek’. The significant P-value cutoff of the shared miRNAs was 0.01. The number of miRNAs shared by RNA in the triplets was not <3 and the correlation coefficient of RNA was >0.3. In the ratio-based method, the cutoff of ratio score was 0.5. Next, we integrated ceRNA candidates identified by all methods and used ‘ceRNA.surv’ to identify survival-related ceRNA modules. The ceRNAs with P-value <0.05 were considered as survival-related ceRNAs.
Identifying the subtypes of cancer based on ceRNA regulation
To explore whether survival-related ceRNAs can be used for subtyping of cancer, we used the ConsensusClusterPlus package in R to identify optimum number of clusters in expression data [18]. The expression profiles were firstly normalized by subtracting the median and then subjected into this R package. We used 80% samples for resampling, the k ranged from 2 to 6 using hierarchical clustering with Pearson correlation as the similarity metric. The specific parameters are as follows: maxK = 6, reps = 100, pItem = 0.8, pFeature = 1, clusterAlg = ‘hc’, distance = ‘pearson’. We selected the best solution for the consensus matrix by considering the relative change in area under cumulative distribution function (CDF) curve.
Moreover, we obtained pathway and cancer-related hallmark function gene sets for single-sample gene set enrichment (ssGSEA) analysis (GSVA R package) [19, 20]. Seven metabolic superpathways were obtained from one recent study [21]. We also obtained the microsatellite instability (MSI) score of patients from one previous study [22]. The major histocompatibility complex (MHC) score was estimated from gene expression of the ‘core’ MHC-I set (including HLA-A, HLA-B, HLA-C, TAP1, TAP2, NLRC5, PSMB9, PSMB8 and B2M). The cytolytic activity (‘CYT’) score was estimated based on expression levels of granzyme A (GZMA) and perforin (PRF1) [23]. Tumor hypoxia score for cancer patients was downloaded from literature [24].
Results
Identifying ceRNA regulation of PTEN in glioma based on ceRNASeek
Phosphatase and tensin homolog (PTEN) has been identified as a critical tumor suppressor gene, which is frequently altered in various types of cancer. Increasing studies have identified numbers of genes as PTEN ceRNAs in cancer [25, 26]. Here, we used PTEN as an example to illustrate the use of the CeRNASeek package.
First, we obtained miRNA-gene regulation from TargetScan. All the genes (n = 2200) that were co-regulated by at least one common miRNA with PTEN were used for further analysis. In addition, the miRNA and gene expression profiles across 541 glioma patients were downloaded from TCGA project [27]. Based on the six methods integrated in CeRNASeek package, we identified all ceRNAs that interact with PTEN in glioma. We found that there were in total 547 genes identified as ceRNAs of PTEN by at least one of four methods. These methods are complement with each other and 155 genes were identified by at least five methods (Figure 4A). Moreover, several ceRNA regulation have been validated previously (Figure 4B), such as RB transcriptional corepressor 1 (RB1) [15] and jumonji and AT-rich interaction domain containing 2 (JARID2) [25]. Next, we compared the proportion of literature-curated PTEN-related ceRNAs in different combinations (Supplementary Figure 1) and found that the proportion of validated ceRNAs was highest when four methods were combined. We also obtained 18 literature-curated ceRNAs that sharing >3 miRNAs with PTEN. These ceRNAs were identified by at least one method, including 12 ceRNAs identified by >3 methods in CeRNASeek (Figure 4B).

ceRNA regulation landscape of PTEN in glioma. (A) Comparative analysis of ceRNAs identified by six methods. The main panels represent the different combinations of the six computational methods, the right bars represent the number of ceRNAs identified by each method and the top bars represent the number of ceRNAs identified in the corresponding combination of methods. (B) Literature-curated PTEN-related ceRNAs interacting network. The weighted network of 18 literature confirmed ceRNAs; the weights represent the number of methods that identified the ceRNAs. (C) Functional enrichment analysis of ceRNA network genes identified by six computational methods. (D) Hazard ratio values of 30 survival-related risk genes.
Next, we used ‘ceRNA.enrich’ to identify the enriched biological process by ceRNAs of PTEN. Here, we focused on the GO terms that were associated with cancer hallmarks [20]. We found that genes associated with ceRNAs of PTEN were significantly enriched in cancer-related hallmarks. The majority of these ceRNAs were significantly enriched in signal transduction and cell adhesion (Figure 4C). Increasing studies have demonstrated that the expressions of ceRNA triplets are closely associated with the survival of cancer patients [28]. We thus performed ‘ceRNA.surv’ to identify PTEN-related ceRNA pairs that were significantly associated with survival. We identified 30 risky genes that were significantly associated with the prognosis (Figure 4D). Among these genes, interleukin 10 receptor subunit beta (IL10RB), interferon regulatory factor 1 (IRF1), integrin subunit alpha 5 (ITGA5), syndecan 2 (SDC2), solute carrier family 2 member 3 (SLC2A3) and UDP-glucose pyrophosphorylase 2 (UGP2) have been demonstrated to be significantly associated with survival of glioma patients [29–34] (Supplementary Table 1). Together, these results suggest that CeRNASeek provides a quick way to understand the regulation of ceRNA in cancer.
Pan-cancer characterization of ceRNA regulation of PTEN
Next, we performed a systematic analysis of different cancer types from TCGA to investigate the PTEN-related ceRNA crosstalks. The miRNA and gene expression profiles across 33 different cancer types were downloaded from TCGA. Our analysis primarily focuses on samples with both gene and miRNA expression data. This resulted in a final set of 10 331 samples across 33 different cancer types (Figure 5A). We used the CeRNASeek package, including six methods to identify PTEN-related miRNA sponge interactions. The significant P-value cutoff of the shared miRNAs is 0.01. The number of miRNAs shared by RNA in the triplets is ≥3 and the correlation coefficient of RNA is >0.3. In the ratio-based method, the cutoff of ratio score is 0.5. We found that the numbers of predicted ceRNA triplets by the six individual methods are different across 33 different cancer types (Figure 5B and Supplementary Table 2). The ratio, hyperT and hyperC methods accounted for a higher proportion of ceRNAs than the other three methods. The results can be explained that these three methods used only common constraints (miRNA–target relationship pairs or gene expression) without considering miRNA expression to identify ceRNA interactions. In one of our previous studies [11], we found that the prediction power was higher when the ensemble miRNA–gene regulation was used.
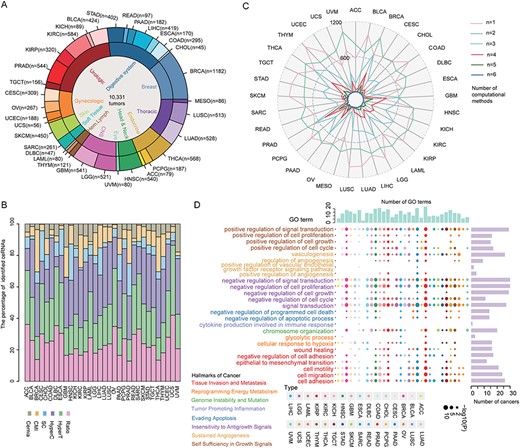
Global landscape of PTEN-associated ceRNAs across cancers. (A) Distribution of cancer types and samples in the analyzed cohort. (B) Proportion distribution of ceRNAs identified by six methods across 33 cancer types. (C) Quantitative statistics of ceRNAs identified by multiple methods in different cancers. (D) The enrichment analysis of cancer-related hallmarks and go terms of ceRNA across 33 cancers; the same color represents the GO terms from the same hallmark. The barplot on the right side of the main image represents the number of times a term appears in 33 cancers. The upper barplot represents the number of terms that appear in a certain cancer. Different colors of the legend represent different cancer hallmarks, and GO terms in the same hallmark are represented by the same color.
To investigate the overlap of ceRNA recalled by different methods, we further used the radar diagrams to show overlapping among the six individual methods (Figure 5C). Our analysis found that a large portion of the ceRNA was recognized by one or two methods. In addition, we compared the proportion of validated ceRNAs identified by at least one, two and three methods. We found that the proportion of validated ceRNAs identified by at least three methods was much higher than the other situations.
As these computational methods might capture different aspects of ceRNA regulation, we next explore whether the identified candidate ceRNAs were involved in cancer-related hallmark across different cancer types. We used ceRNA candidates identified by >3 methods for functional enrichment analysis. Our analysis revealed that ceRNA candidates were significantly enriched in cancer-related hallmark terms, suggesting that they play critical roles in cancer. The majority of biological processes were shared by more than two cancer types. For example, ‘regulation of cell proliferation’, ‘regulation of signal transduction’ and ‘regulation of cell cycle’ were involved in >25 types of cancer (Figure 5D). A small number of functional terms are only present in one or several cancer types, such as ‘cytokine production involved in immune response’, which was only enriched in colon adenocarcinoma. Taken together, these results not only demonstrated the reliability of the identified ceRNA but also suggested the important roles of ceRNA in the regulation of complex diseases in humans.
Dissecting ceRNA regulation among clinical targetable genes
Based on the finding that ceRNAs were tightly associated with cancer hallmarks and drug-associated pathways, we next explored whether ceRNAs were directly linked to cancer therapy. Here, we focused on a set of CAGs for identifying ceRNA regulation [35], which includes 151 therapeutic targets of Food and Drug Administration (FDA)-approved drugs or their associated predictive marker genes. As liver cancer grades the fourth leading cause of cancer-related death worldwide [36], we used liver hepatocellular carcinoma (LIHC) from TCGA as an example to identify the ceRNA regulatory relationship between targetable genes. We used the threshold set in the previous section to identify LIHC-related ceRNAs. In total, we identified 1248 ceRNA crosstalks among targetable genes (Supplementary Figure 2).
Next, we identified a ceRNA regulatory module that significantly affected survival prognosis, which involved 193 interactions among 67 CAGs (Supplementary Table 3). Among these CAGs, there were 27 FDA-approved drug targets, 7 late-stage clinical trial targets, 10 early-stage clinical trial targets, and 11 other established diagnostic and prognostic targets and 12 unknown targets (Figure 6A). Notably, we found that the node with the highest degree in the network is vascular endothelial growth factor A (VEGFA), which may be due to the fact that VEGFA interacts with various carcinogenic factors in the presence of tumor growth, resulting in a rapid increase in the number of vascular endothelial growth factor, providing a superior growth environment for tumors [37].
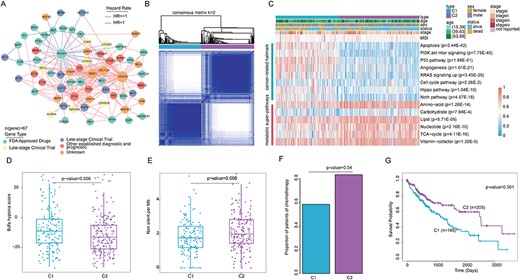
Identification and characterization of molecular subtypes in patients with hepatocellular carcinoma. (A) Identification of survival-related regulation modules among clinical targetable genes. (B) Subgroups are identified based on gene expression data of LIHC cohort by k-means consensus clustering upon their abundance. k was examined from 2 to 6 and consensus clustering was based on 100 resampled datasets. (C) Heatmap of difference score in two subgroups. (D) The hypoxia scores in different subgroups. (E) The mutation burden for patients in different subgroups. (F) The proportion of patients that response to chemotherapy in all available treatment information in two subgroups. (G) Kaplan–Meier curves for overall survival based on the two subgroups (Log-rank test).
CeRNA regulation stratify cancer patients with distinct functional characteristics
CeRNA regulation had been demonstrated to be potential biomarkers for cancer subtyping [6,38]. We next used the ConsensusClusterPlus to identify subtypes based on LIHC-related 67 CAG expression data. The expressions of 67 CAGs were firstly normalized by subtracting the median and then subjected into clustering. We found that when k = 2 generated the best solution for the consensus matrix when considering the relative change in area under CDF curve (Figure 6B; Supplementary Figure 3A and B and Supplementary Table 4). To investigate whether patients in these two subtypes were induced by different pathway dysregulation, we performed ssGSEA analysis. The Molecular Signatures Database (MSigDB) c2 pathway and cancer-related hallmark terms were considered [39]. We found that patients in subtype C1 exhibit significantly higher hippo pathway activity (Figure 6C, P = 1.04E−10), cell cycle pathway activity (P = 2.26E−2) and KRAS signaling up (P = 3.45E−20). These results suggest that patients in subtype C1 are likely to have higher proliferation potential, and we thus defined this subtype as ‘proliferation group’.
In addition, we curated the gene sets of seven metabolic superpathways based on the latest annotations of Reactome [21] and calculated the enrichment scores for each patient. We found that 6/7 metabolic superpathways showed higher pathway activity in C2 subtype (Figure 6C) and thus defined the C2 subtype as the ‘metabolism group’. MSI is a rare event during hepatocarcinogenesis and may be specifically associated with progression of hepatocellular carcinoma [40]. We found that the MSI scores in C1 were significantly higher than those in subgroup 2 (Figure 6C). Many primary tumors have low levels of molecular oxygen (hypoxia). Hypoxic tumors are more likely to metastasize to distant sites and respond poorly to multiple therapies [24]. Analysis of tumor hypoxia across liver cancer patients, we found that patients in subgroup C1 exhibit a significantly higher hypoxia score compared to subgroup C2 (Figure 6D, P-value = 0.012, t-test). We next compared the relationship between liver cancer subtypes and known subtypes [41]. We found that there were significant differences between the known subtypes in the two subgroups (Supplementary Figure 3C). We found that C1 patients are likely to be enriched in hypomethylation-based S1 subtype and mRNA-based S1 subtype, while C2 patients show higher levels in hypomethylated-based S3 subtypes and mRNA-based S5 subtypes. These results illustrate the heterogeneity between the two liver cancer subgroups.
Tumor mutation burden (TMB) is an emerging immune-relevant biomarker for checkpoint blockade immunotherapy [42]. Analysis of the TMB distribution across the liver cancer patients, we found that the patients in C2 subgroup have significantly higher TMB than others (Figure 6E; Supplementary Figure 3D; Wilcox’s rank sum test, P = 0.001; Wilcox’s rank sum test, P = 0.006). Next, we obtained known mutation genes in liver cancer [41]. We found that the mutation frequencies of isocitrate dehydrogenase (NADP(+)) 1 (IDH), tumor protein p53 (TP53), catenin beta 1 (CTNNB1) and telomerase reverse transcriptase (TERT) genes in the C2 were significantly higher than that of C1 subtype (Supplementary Figure 4A and B). Moreover, we investigated the distributions of MHC scores and immune cytolytic activity (CYT), and we found that patients in C2 subtypes were with significantly higher MHC scores than others (Supplementary Figure 4C, P < 0.001, t-test). These results suggest that patients in C2 group are likely to response to immunotherapy. Next, we obtained the available chemotherapy information of all liver cancer patients from TCGA project. We found that there are more patients in C2 subtypes who response to chemotherapy than patients in C1 (Figure 6F, P = 0.04, Chi-Square test). Moreover, we found that patients in C1 subgroup tend to receive different treatments (Supplementary Figure 4D). Finally, comparison of the survival rates among two subtypes, we found that the patients in C1 are with significantly poor prognosis than other patients (Figure 6G, log-rank P = 0.001). Meanwhile, no significant difference was found in the tumor status of the two subgroups (Supplementary Figure 4E; Wilcox’s rank sum test, P = 0.65). These results suggest that our subgroups based on CAGs classification are independent of tumor stage. All of the above results indicate that cancer-associated ceRNA genes recognized by ceRNAseek can be used to classify cancer subtypes with different molecular phenotypes.
Discussion
CeRNA regulation mediated by miRNAs has been demonstrated to play important roles in cancer. MiRNA-mediated ceRNA–ceRNA crosstalk is changing our understanding of the potential mechanisms of cancer. We implemented CeRNASeek to provide a pipeline for identifying and analyzing ceRNA–ceRNA interaction network. To the best of our knowledge, this is the R package for quick applying existing ceRNA methods to new datasets. It can also enable researchers to evaluate the proposed new methods.
For a deeper understanding of the R package, we take PTEN as an example. We identified all ceRNAs that interact with PTEN in glioma by using ceRNAseek, including many validated ceRNAs, such as RB1 and JARID2. At the same time, we found that there is a large overlap of the ceRNAs identified by the six methods provided by the R package. We also compared the performance of six methods. These methods have their own advantages and disadvantages (Table 1). By comparing different method combinations (Supplementary Figure 1 and Supplementary Table 5), we found that it might be better to choose three or four methods to identify candidate ceRNAs. In addition, integration of the paired miRNA–mRNA expression profiles of the same patients will identify the specific miRNA-gene regulation. The context-specific miRNA-gene regulation helps identifying the ceRNA regulation. However, the integrated methods might be challenged by the limited number of samples with both miRNA and gene expression profiles. Thus, it is better for the users to integrate them complementarily, e.g. by combining them to develop an ensemble method. To address this problem, ceRNASeek provide a quick way to identify the ceRNA regulation and for further analyses.
Furthermore, we explored the enriched biological process by ceRNAs of PTEN and found that 39 ceRNAs of PTEN were significantly associated with cancer hallmarks. These results suggest that PTEN-related ceRNAs play important molecular functions in the development and progression of cancer. In the subsequent survival analysis, we identified 30 risk factors, and the high and low expression levels of the corresponding ceRNA pairs were significantly associated with the patient’s survival prognosis. Some of these genes have been shown to be associated with survival in glioma patients, such as ITGA5, which inhibits glioblastoma cell proliferation and invasiveness by interacting with miR-330-5p [43]. SLC2A3 was identified as a core target of miR-106a in glomerular basement membrane (GBM) cells, and inhibition of SLC2A3 by miR-106a attenuated cell proliferation and inhibited glucose uptake [44].
Furthermore, we analyzed PTEN-mediated ceRNA interactions in 33 cancer types. Our analysis found that the numbers of predicted ceRNA triplets by the six individual methods are different across 33 different cancer types. We then studied the overlap of ceRNAs recalled by different methods. Our analysis found that most of the ceRNAs were identified by one or two methods, which may be due to differences in methods and thresholds. Therefore, we recommend using at least three methods to identify candidate ceRNAs for analysis. By characterizing the candidate ceRNA function across 33 cancer types, we found that candidate ceRNAs are involved in a variety of cancer-related biological processes, and cancer tends to be synergistically affected by multiple biological functions. For example, ‘negative regulation of signal transduction’, ‘negative regulation of cell cycle’ and ‘signal transduction’ and ‘cell adhesion’ were involved in >25 types of cancer. Importantly, the recognized ceRNAs in prostate adenocarcinoma (PRAD), kidney cancer (KICH), and pancreatic adenocarcinoma (PAAD) and hepatocellular carcinoma (LIHC) have significantly enriched many hallmarks associated with cancer. These findings indicate the important function and role of ceRNA in regulating complex human diseases.
To examine the potential impact of ceRNAs on clinical practice, we focused on 151 CAGs. We used ‘CeRNASeek’ to analyze ceRNA regulation among targetable genes and identified survival-related regulatory modules formed by 67 CAGs. All the liver cancer patients were classified into two significant different molecular subtypes based on the expression of 67 CAGs. The patients in subtype C1 are likely to have higher proliferation potential, and C2 subtype showed higher metabolic superpathways. Many primary tumors have low levels of molecular oxygen (hypoxia). Analysis of tumor hypoxia across liver cancer patients, we found that patients in subgroup C1 exhibit a significantly higher hypoxia score. Further, we found that TMB in subgroup 1 was lower than that in subgroup 2 and had a better survival prognosis. This result is consistent with previous studies that the group with a high TMB score has a better prognosis [42]. Further, we found that the mutation frequencies of genes in liver cancer subgroups were significantly different. Together, all these results strongly demonstrate that the identification of ceRNA interactions plays an important role in cancer.
In summary, we introduced the recognition of ceRNA and the ceRNA–ceRNA interactions between human major cancers and applied to clinical data studies. As the researches into miRNA sponges are increasing, this package will speed up our knowledge of ceRNA regulation in cancer.
Computational method for identifying ceRNA regulation in cancer was reviewed and summarized.
A computational tool was developed to analyze ceRNA regulation in cancer.
Pan-cancer ceRNA regulations were analyzed based on the proposed tool.
CeRNA regulation among clinical targetable genes identified cancer subtypes with distinct characteristics.
Funding
National Key R&D Program of China (2018YFC2000100); National Natural Science Foundation of China (61873075, 31871338 and 31970646); Natural Science Foundation for Distinguished Young Scholars of Heilongjiang Province (JQ2019C004) and Heilongjiang Touyan Innovation Team Program.
Mengying Zhang is a PhD student in the College of Bioinformatics Science and Technology at Harbin Medical University, China. Her research interests focus on ceRNA regulation.
Xiyun Jin is a MS student in the College of Bioinformatics Science and Technology at Harbin Medical University, China. Her research interests focus on cancer bioinformatics.
Junyi Li is a MS student in the College of Bioinformatics Science and Technology at Harbin Medical University, China. His research interests focus on bioinformatics methods.
Yi Tian is a MS student in the College of Bioinformatics Science and Technology at Harbin Medical University, China. His research interests focus on ncRNA regulation.
Qi Wang is a MS student in the College of Bioinformatics Science and Technology at Harbin Medical University, China. His research interests focus on computational biology.
Xinhui Li is a MS student in the College of Bioinformatics Science and Technology at Harbin Medical University, China. Her research interests focus on ncRNA regulation.
Juan Xu is a professor in the College of Bioinformatics Science and Technology at Harbin Medical University, China and in the Key Laboratory of Tropical Translational Medicine of Ministry of Education, Hainan Medical University, China. Her research activity is focused on ncRNA regulation in complex diseases.
Yongsheng Li is a professor in the Key Laboratory of Tropical Translational Medicine of Ministry of Education, Hainan Medical University, China and in the College of Bioinformatics Science and Technology at Harbin Medical University, China. His research interests focus on ncRNA regulation and bioinformatics methods development.
Xia Li is a professor in the College of Bioinformatics Science and Technology at Harbin Medical University, China and in the Key Laboratory of Tropical Translational Medicine of Ministry of Education, Hainan Medical University, China. Her research interests focus on computational system biology and ncRNA regulation in human diseases.
References
Author notes
Mengying Zhang and Xiyun Jin contributed equally to this work.
