


Abstract
The CDC/Kaiser Adverse Childhood Experiences (ACE) study documented that ACEs predict adult health and self-harming behaviors. ACEs have been documented in physicians and are higher in physicians treated for problematic behavior. Plastic surgeons have never been assayed.
Might ACE prevalences in plastic surgeons predict their adult health and/or behavior?
A total of 252 ABPS-certified plastic surgeons (72% men, 28% women) completed the 10-question CDC/Kaiser ACE survey by deidentified email. Data were collected on adult health and behaviors previously associated with ACEs in the literature.
In total 42% of plastic surgeons had 1 or more ACEs; 9.9% had 4 or more. Emotional abuse was 2 times higher than the control CDC/Kaiser population, although other ACEs were lower. Gender differences existed: female surgeons suffered more sexual abuse (17% vs 8%), physical neglect (7% vs 1%), violence against their mothers (7% vs 2%), and self-defined burnout (32% vs 17%). ACEs occurred in clusters. Total ACEs predicted autoimmune disorders, chronic pain/fatigue, self-defined depression, irritable bowel, antidepressant/anxiolytic use, alcohol abuse, >3 marriages, >10 sexual partners, sex and work addiction, eating disorders, and self-defined burnout (all P < .020). Emotional abuse predicted alcohol abuse. Sexual abuse predicted sex addiction. Emotional neglect predicted autoimmune disease, antidepressant/anxiolytic use, eating disorder, and work addiction. Physical neglect predicted chronic fatigue/chronic pain, depression, and burnout (all P < .001 or less).
Adverse childhood experiences occurred in 42% of our 252-member plastic surgeon cohort and predicted 13 adult illnesses and self-harming behaviors that can impair surgeons’ lives and performances. This may facilitate their recognition and treatment.
The Adverse Childhood Experiences (ACE) study, the yardstick for childhood abuse and neglect for the Centers for Disease Control, has spawned a large literature since its first publications in 1977.1-8 These publications made 2 remarkable observations. First, adverse childhood experiences, as defined by the study authors, were common: at least 1 type of ACE occurred in 64% of 17,000 general medical patients before the age of 18.2,3,6 Sixteen percent had 4 or more ACEs.3 Second, there was a direct dose-effect relationship between the number of ACEs and many adult health problems and self-harming behavior; that is, the more ACEs a person had, the worse their adult health.4-6 These health issues included those that occurred as many as 30 or 40 years after the trauma, for example, cardiovascular disease in the absence of risk factors, autoimmune disease, hyperlipidemia, hypertension, diabetes, primary pulmonary fibrosis, cancer, multiple sclerosis, depression, substance abuse, and difficulty holding a job.2-8
We have previously shown that ACEs occurred in plastic surgery patients in prevalences that equaled or exceeded those in the Kaiser medical patient population, and that ACEs also correlated with body shame, which in turn correlated with many traits associated with body dysmorphic disorder (depression, antidepressant and recreational drug use, and persistent dissatisfaction with a surgical result).9,10
To our knowledge, there have been only 4 measures of ACEs in physicians, 1 in medical students, and none solely in surgeons or plastic surgeons.11-15 Although 3 studies reported lower prevalences in physicians than the Kaiser control, 1 study reported a higher (70%) prevalence of ACEs in physicians and residents treated for behavioral or disciplinary problems.11-14 Two studies have reported associations of ACEs with depression and/or burnout in physicians; burnout was 2.5 times more prevalent in physicians with ACE scores >4.13,14 Yet despite the current interest in physician behavior, health, and burnout, a 2020 survey documented that 81% of physicians had no knowledge of the ACE questionnaire or its immense literature.11
The purpose of this paper was to measure the prevalence of ACEs in board-certified plastic surgeons in the United States and to test correlations to those ACE-related adult health problems and self-harming behaviors already in the literature; to examine ACE gender differences; and further to determine if any individual types of childhood abuse or neglect predicted particular health outcomes.1-7 We also sought to determine whether ACEs might “cluster,” or occur together, and if so, which ones; and whether ACEs were associated with performance-affecting health issues, including self-diagnosed depression, work addiction, and burnout, among respondent plastic surgeons.13,14
METHODS
Study Population and the Adverse Childhood Experiences Survey
All US, Canadian, and International active and associate members, life members, and members of the Resident and Fellows Program of The Aesthetic Society were offered participation in an anonymous email survey created in Survey Monkey (Table 1 and Supplemental Table 1, located online at https://doi.org/10.1093/asj/sjae214).
The Adverse Childhood Experiences Survey as Administered
| Instruction: Prior to your 18th birthday (check all that apply): |
|---|
| Did a parent or other adult in the household often or very often … • Swear at you, insult you, put you down, or humiliate you or • call you things like "lazy", "stupid", or "ugly"? or • Act in a way that made you afraid that you might be physically hurt? |
| Did a parent or other adult in the household often or very often … • Push, grab, slap, or throw something at you? or • Ever hit you so hard that you had marks or were injured? |
| Did an adult or person at least 5 years older than you ever … • Touch or fondle you or have you touch their bodies in a sexual way? or • Ever hit you so hard that you had marks or were injured? |
| Did you often or very often feel that … • No one in your family loved you or thought you were important or special? or • Your family didn't look out for each other, feel close to each other, or support each other? |
| Did you often or very often feel that … • You didn't have enough to eat, had to wear dirty clothes, and had no one to protect you? or • Your parents were too drunk or high to take care of you or take you to the doctor if you needed it? |
| • Was a biological parent ever lost to you through divorce, abandonment, or other reason? |
| Was your mother or stepmother … • Often or very often pushed, grabbed, slapped, or had something thrown at her? or • Sometimes, often, or very often kicked, bitten, hit with a fist or something hard? or • Ever repeatedly hit over at least a few minutes or threatened with a gun or knife? |
| • Did you live with anyone who was a problem drinker or used street drugs? |
| • Was a household member depressed, mentally ill, or attempt suicide? |
| • Did a household member go to prison? |
The survey was deliberately shortened to 2 pages to encourage participation and was sent twice, on May 24 and June 3, 2021, entitled “ASERF Funded Study: Prevalence of Adverse Childhood Experiences.”16
Each recipient received introductory information and informed consent (Supplemental Table 2, located online at https://doi.org/10.1093/asj/sjae214) that specified the voluntary and innovative character of the research; summarized the Kaiser Permanente study results; indicated that surgeons had never been tested (true at the time); invited participation in a 5- to 10-minute survey comprising the 10-question Adverse Childhood Experiences Questionnaire and a separate health questionnaire; and stated that risks of taking the survey were remote, questions seeming too personal or discomfiting could be skipped, and data would be kept encoded and secure. We provided national suicide prevention lifeline contact information. Participants were specifically reassured that the data would be anonymous and that no one would be able to link data to respondents (Table 1 and Supplemental Tables 1, 2).
Participants were not compensated. The survey was structured so that surgeons had to attest that they had completed or deliberately left blank all questions before proceeding to the next page. Demographic and health history were recorded by the respondents. Country of origin and member status were not queried. The health questionnaire asked common review of systems questions and about ACE-related adult health problems and self-harming behaviors already described in the literature.1-7 Depression, work addiction, and burnout, which were not the primary foci of this investigation, were self-defined by the respondents. All data were input by Survey Monkey to an Excel document, following which the surveys were destroyed. Deidentified data were shared solely and directly with the statistician through secure transfer. M.B.C. did not have access to raw data.
IRB Exemption
The study was determined to be exempt by the Office of Research Integrity and Outreach at the University of Southern Maine on April 7, 2021. The University of Southern Maine determines IRB status for Saint Joseph Hospital in Nashua, New Hampshire, with which M.B.C. was affiliated during data collection.
Statistical Analysis
All comparisons of The Aesthetic Society member sample rates to Kaiser Permanente rates were made with a 1-sample test of proportions, with the Kaiser rate specified. Sample comparisons between groups were made with unadjusted Pearson’s chi-square tests for binary variables, and the nonparametric Kruskal-Wallis rank sum test for continuous variables. Two-sided 95% confidence intervals were calculated for proportions with the normal approximation to the binomial. Logistic regression was performed to correlate ACEs with adult health and model various adult health conditions with individual ACEs. A logistic regression mediation analysis was performed with bootstrapped samples to assess the probabilities of any associations between total ACE score and health outcomes and to determine whether individual ACEs predicted health outcomes. Logistic regression models were tested for goodness of fit with the Hosmer-Lemeshow test. Provided P values were unadjusted for multiple comparisons. All models and descriptive statistics were generated with R (version 3.5.1; Vienna, Austria), a free and open-source software environment. Demographic tables provide mean values and range for numerical variables. Specific details are provided with each table.
RESULTS
Groups and Demographic Information
A total of 274 surgeons responded out of 4226 surveyed (6.45%), 22 of whom were removed for answering “No” or “Prefer not to answer” to all questions, including demographic information (Table 2). Data were analyzed for the remaining 252 surgeons. Respondents were separated by age, gender, and geographic region for analysis. US, International, candidate, active, associate, and life members were not stratified.
Demographics of the Study Population
| Demographic information | N (%) |
|---|---|
| Gender | |
| Males | 181 (71.8%) |
| Females | 71 (28.2%) |
| Age | |
| 30-40 years | 34 (13.5%) |
| 40-50 years | 27 (10.7%) |
| 50-60 years | 62 (24.6%) |
| 60-70 years | 76 (30.2%) |
| Over 70 | 53 (21%) |
| Race | |
| African American | 5 (2%) |
| Asian | 10 (4%) |
| Caucasian | 210 (83.3%) |
| Latino or Hispanic | 16 (6.3%) |
| Native American | 1 (0.4%) |
| Native Hawaiian or Pacific Islander | 1 (0.4%) |
| Prefer not to answer | 5 (2%) |
| Two or more | 4 (1.6%) |
| Location (Regional)a | |
| Midwest | 36 (14.3%) |
| Northeast | 54 (21.4%) |
| Southeast | 52 (20.6%) |
| Southwest | 32 (12.7%) |
| West | 55 (21.8%) |
| Prefer not to answer | 23 (9.1%) |
| Current relationship status | |
| Divorced | 21 (8.3%) |
| Married | 203 (80.6%) |
| Separated | 3 (1.2%) |
| Single (never married) | 18 (7.1%) |
| Widowed | 4 (1.6%) |
| Prefer not to answer | 3 (1.2%) |
aNortheast—CT, DC, DE, MA, MD, ME, NH, NJ, NY, PA, RI, VT; Midwest—IA, IL, IN, KS, MI, MN, MO, ND, NE, OH, SD, WI; Southeast—AL, AR, FL, GA, KY, LA, MS, NC, SC, TN, VA, WV; Southwest—AZ, NM, OK, TX; West—AK, CA, CO, HI, ID, MT, NV, OR, UT, WA, WY.
Seventy-two percent of our respondents were males and 28% were females. This is a slightly different ratio than current The Aesthetic Society membership, of which 78% are males and 20% are females (2% nonrespondent).16 Twenty-four percent of respondents were under 50 years of age and 76% were over 50 years of age, important for our adult health assay. (The percentage of respondents over age 50 exceeded current The Aesthetic Society membership data, for which only 57% are over age 50.)16 Eighty-three percent of respondents were Caucasian, 6.3% Latino or Hispanic, 4% Asian, and 2% African American. Geographic distribution was widespread, with 64% of respondents evenly distributed in the northeastern, southeastern, and western states, and 27% in the Midwest or Southwest. A total of 9.1% of respondents refused to supply geographic locations. Eighty-one percent of respondents were married, 8.3% divorced, and smaller numbers single, separated, or widowed.
Comparison of Adverse Childhood Events in The Aesthetic Society Members to CDC Data
Forty-two percent of The Aesthetic Society respondents had at least 1 ACE, a prevalence significantly lower than the 64% in the CDC/Kaiser medical patient population (P < .0001; Table 3). However, 10% of surgeons had 4 or more ACEs, resembling the 12.5% in the CDC/Kaiser data. In our group, emotional abuse was almost double the control Kaiser prevalence (19.8% vs 10.6%, P < .0001). All other ACEs were either similar to Kaiser data or significantly lower.
Comparison of Adverse Childhood Events in The Aesthetic Society Respondents to Kaiser Permanente/US Centers for Disease Control Data
| The aesthetic society respondents, % | 95% CI | Kaiser value, % | P value | |
|---|---|---|---|---|
| 1 or more ACEs | 41.7 | (35.6, 48) | 63.9 | <.0001 |
| 4 or more ACEs | 9.9 | (6.6, 14.5) | 12.5 | 0.253 |
| Emotional abuse | 19.8 | (15.2, 25.4) | 10.6 | <.0001 |
| Physical abuse | 14.7 | (10.7, 19.8) | 28.3 | <.0001 |
| Sexual abuse | 10.7 | (7.3, 15.4) | 20.7 | <.0001 |
| Emotional neglect | 11.1 | (7.6, 15.8) | 14.8 | .119 |
| Physical neglect | 2.8 | (1.2, 5.9) | 9.9 | <.0001 |
| Parental separation or divorce | 9.9 | (6.6, 14.5) | 23.3 | <.0001 |
| Mother treated violently | 3.2 | (1.5, 6.4) | 12.7 | <.0001 |
| Household substance abuse | 10.7 | (7.3, 15.4) | 26.9 | <.0001 |
| Household mental illness | 16.3 | (12.1, 21.5) | 19.4 | .239 |
| Incarcerated household member | 2 | (0.7, 4.8) | 4.7 | .059 |
ACE, adverse childhood event; CI, confidence interval.
Examined by themselves, adverse childhood experiences were common among our respondents, particularly household mental illness (16.3%), physical abuse (14.7%), emotional neglect (11.1%), sexual abuse, (10.7%), household substance abuse (10.7%), and divorce (9.9%). Physical neglect, violence against the mother, and incarceration of family members were less common at 2.8%, 3.2%, and 2%, respectively.
Adverse Childhood Experience Prevalences by Gender
Notable gender differences appeared. Female surgeons had suffered twice as much sexual abuse (16.9% vs 8.3%, P < .047), more than 6 times as much physical neglect (7% vs 1.1%, P < .010%), and experienced 4 times the prevalence of violence against their mothers (7% vs 1.7%, P < .028) (Table 4). A similar association of physical and sexual abuse in female physicians was documented by Stork et al.11
Adverse Childhood Experiences in The Aesthetic Society Respondents, by Gender
| Men | Women | P value | |
|---|---|---|---|
| ACEs ≥ 1 | 71 (39.2%) | 34 (47.9%) | .210 |
| ACEs ≥ 4 | 16 (8.8%) | 9 (12.7%) | .359 |
| ACEs total, average (range) | 0.9 (0,6) | 1.3 (0,9) | .133 |
| Emotional abuse | 36 (19.9%) | 14 (19.7%) | .976 |
| Physical abuse | 24 (13.3%) | 13 (18.3%) | .308 |
| Sexual abuse | 15 (8.3%) | 12 (16.9%) | .047 |
| Emotional neglect | 18 (9.9%) | 10 (14.1%) | .347 |
| Physical neglect | 2 (1.1%) | 5 (7%) | .010 |
| Parental separation or divorce | 14 (7.7%) | 11 (15.5%) | .064 |
| Mother treated violently | 3 (1.7%) | 5 (7%) | .028 |
| Household substance abuse | 17 (9.4%) | 10 (14.1%) | .279 |
| Household mental illness | 29 (16%) | 12 (16.9%) | .865 |
| Incarcerated household member | 2 (1.1%) | 3 (4.2%) | — |
ACE, adverse childhood event.
Adult Health Prevalences by Gender
There were gender health differences, some of which could have been anticipated, for example, more males had BMI's over 30 (12.2% vs 2.8%, P < .023), diabetes (7.2% vs 0%, P < .020), hypertension (34.8% vs 15.5%, P < .002), and hyperlipidemia (18.8% vs 5.6%, P < .009) (Table 5). However, despite the younger mean age of our female surgeon respondents (53.2 vs 60.5 years), antidepressant use was twice as common (31% vs 15.5%, P < .005), and females were almost twice as likely to self-diagnose burnout (32.4% vs 17.1%, P < .008).
Self-Reported Respondents’ Adult Health Prevalences, by Gender
| Adult health prevalences | Men | Women | P value |
|---|---|---|---|
| Age, average (range) | 60.5 (35-75 years) | 53.2 (35-75 years) | <.001 |
| Asthma/COPD | 17 (9.4%) | 6 (8.5%) | .815 |
| Autoimmune disease | 13 (7.2%) | 6 (8.5%) | .732 |
| BMI >30 | 22 (12.2%) | 2 (2.8%) | .023 |
| Cancer | 14 (7.7%) | 4 (5.6%) | .560 |
| Chronic fatigue | 8 (4.4%) | 0 (0%) | .072 |
| Chronic pain | 12 (6.6%) | 2 (2.8%) | .235 |
| Depression | 24 (13.3%) | 16 (22.5%) | .070 |
| Diabetes | 13 (7.2%) | 0 (0%) | .020 |
| Headaches or migraines | 26 (14.4%) | 12 (16.9%) | .613 |
| Heart disease | 11 (6.1%) | 1 (1.4%) | .117 |
| High blood pressure | 63 (34.8%) | 11 (15.5%) | .002 |
| Hyperlipidemia | 34 (18.8%) | 4 (5.6%) | .009 |
| Irritable bowel or irregularity | 14 (7.7%) | 7 (9.9%) | .583 |
| Skeletal fractures | 16 (8.8%) | 3 (4.2%) | .212 |
| Antidepressants | 28 (15.5%) | 22 (31%) | .005 |
| Anxiolytic drugs | 15 (8.3%) | 6 (8.5%) | .966 |
| Recreational drugs | 16 (8.8%) | 5 (7%) | .642 |
| Alcohol abuse | 11 (6.1%) | 7 (9.9%) | .294 |
| Smoking | 16 (8.8%) | 6 (8.5%) | .922 |
| Problems keeping a job (absenteeism, conflict) | 0 (0%) | 2 (2.8%) | — |
| 3 or more marriages | 6 (3.3%) | 0 (0%) | .120 |
| 10 or more sexual partners | 43 (23.8%) | 18 (25.4%) | .790 |
| Gambling addiction | 0 (0%) | 0 (0%) | — |
| Sex addiction | 8 (4.4%) | 0 (0%) | .072 |
| Eating disorder | 10 (5.5%) | 7 (9.9%) | .217 |
| Self-defined work addiction | 27 (14.9%) | 9 (12.7%) | .647 |
| Self-defined burnout | 31 (17.1%) | 23 (32.4%) | .008 |
BMI, body mass index; COPD, chronic obstructive pulmonary disease.
Logistic Regression to Test Whether Total ACE Score Predicted Health or Behavioral Outcomes
There was a strong association between total ACE score and health outcomes for 13 of the 25 health outcomes assayed: autoimmune disease, chronic fatigue, chronic pain, depression, irritable bowel, current antidepressant or anxiolytic drug use, alcohol abuse, 10 or more sexual partners, sex addiction, eating disorder, work addiction, and burnout (P < .02 or less; Table 6).
Logistic Regression to Test Whether Total ACE Score Predicted Individual Health Outcomes, Adjusted for Age, All Respondents
| Health problem | ACE total OR | 95% CI | P value |
|---|---|---|---|
| Asthma/COPD | 0.83 | (0.59-1.17) | .291 |
| Autoimmune disease | 1.60 | (1.29-1.99) | <.001 |
| BMI >30 | 1.00 | (0.74-1.34) | 0.984 |
| Cancer | 0.72 | (0.45-1.14) | 0.161 |
| Chronic fatigue | 1.90 | (1.32-2.75) | <.001 |
| Chronic pain | 1.84 | (1.40-2.42) | <.001 |
| Depression | 1.73 | (1.41-2.11) | <.001 |
| Headaches or migraines | 1.17 | (0.97-1.41) | .094 |
| Heart disease | 0.92 | (0.61-1.40) | .708 |
| High blood pressure | 0.98 | (0.81-1.18) | .809 |
| Hyperlipidemia | 0.91 | (0.70-1.17) | .441 |
| Irritable bowel or irregularity | 1.43 | (1.16-1.77) | <.001 |
| Skeletal fractures | 0.79 | (0.53-1.19) | .267 |
| Antidepressants | 1.45 | (1.21-1.74) | <.001 |
| Anxiolytic drug | 1.44 | (1.17-1.78) | <.001 |
| Recreational drugs | 1.13 | (0.89-1.44) | .306 |
| Alcohol abuse | 1.44 | (1.15-1.79) | .001 |
| Smoking | 1.18 | (0.94-1.48) | .148 |
| Problems keeping a job (absenteeism, conflict) | 1.37 | (0.85-2.20) | .194 |
| 3 or more marriages | 1.16 | (0.72-1.85) | .542 |
| 10 or more sexual partners | 1.28 | (1.08-1.50) | .004 |
| Sex addiction | 1.55 | (1.07-2.25) | .020 |
| Eating disorder | 1.41 | (1.13-1.76) | .002 |
| Self-defined work addiction | 1.60 | (1.32-1.93) | <.001 |
| Self-defined burnout | 1.47 | (1.22-1.76) | <.001 |
ACE, adverse childhood event; BMI, body mass index; CI, confidence interval; COPD, chronic obstructive pulmonary disease; OR, odds ratio.
Correlation of Individual Adverse Childhood Events and Health
We performed logistic regression to test whether individual ACEs predicted individual health outcomes (Table 7 and Supplemental Table 3, located online at https://doi.org/10.1093/asj/sjae214). For autoimmune disease, the 2 ACEs with the highest odds ratios were emotional neglect and emotional abuse; for chronic fatigue, physical neglect and emotional neglect; for chronic pain, physical neglect and household mental illness; for depression, physical neglect and household mental illness; for irritable bowel or irregularity, household mental illness and emotional neglect; for anxiolytic drug use, emotional neglect and household mental illness; and for alcohol abuse, emotional and physical abuse.
Logistic Regression to Test Which Adverse Childhood Events Predict Health Outcomes
| ACE and health outcome | OR | 95% CI | P value |
|---|---|---|---|
| ACEs and autoimmune disease | |||
| ACE total | 1.60 | (1.29-1.99) | <.001 |
| ACE ≥ 1 | 3.35 | (1.22-9.20) | .019 |
| ACE ≥ 4 | 12.59 | (4.36-36.37) | <.001 |
| Emotional abuse | 9.03 | (3.28-24.82) | <.001 |
| Physical abuse | 6.76 | (2.48-18.44) | <.001 |
| Emotional neglect | 12.18 | (4.32-34.33) | <.001 |
| Household mental illness | 6.96 | (2.59-18.69) | <.001 |
| ACEs and chronic fatigue | |||
| ACE total | 1.90 | (1.32-2.75) | <.001 |
| ACE ≥ 4 | 20.08 | (4.17-96.74) | <.001 |
| Emotional abuse | 7.11 | (1.59-31.81) | .010 |
| Physical abuse | 8.03 | (1.80-35.86) | .006 |
| Sexual abuse | 12.91 | (2.78-59.99) | .001 |
| Emotional neglect | 17.26 | (3.61-82.50) | <.001 |
| Physical neglect | 35.29 | (1.74-716.12) | .020 |
| Household mental illness | 9.54 | (2.11-43.20) | .003 |
| ACEs and chronic pain | |||
| ACE total | 1.84 | (1.40-2.42) | <.001 |
| ACE ≥ 1 | 10.70 | (2.28-50.14) | .003 |
| ACE ≥ 4 | 8.90 | (2.63-30.11) | <.001 |
| Emotional abuse | 8.67 | (2.67-28.13) | <.001 |
| Physical abuse | 8.40 | (2.57-27.52) | <.001 |
| Sexual abuse | 6.17 | (1.76-21.65) | .004 |
| Emotional neglect | 6.65 | (2.00-22.14) | .002 |
| Physical neglect | 21.24 | (2.41-187.39) | .006 |
| Household mental illness | 11.52 | (3.49-38.03) | <.001 |
| ACEs and depression | |||
| ACE total | 1.73 | (1.41-2.11) | <.001 |
| ACE ≥ 1 | 4.63 | (2.18-9.83) | <.001 |
| ACE ≥ 4 | 9.63 | (3.93-23.59) | <.001 |
| Emotional abuse | 6.35 | (3.01-13.37) | <.001 |
| Physical abuse | 3.10 | (1.39-6.92) | .006 |
| Sexual abuse | 4.20 | (1.76-10.07) | .001 |
| Emotional neglect | 7.28 | (3.08-17.17) | <.001 |
| Physical neglect | 13.19 | (2.37-73.36) | .003 |
| Mother treated violently | 5.10 | (1.19-21.83) | .028 |
| Household substance abuse | 4.77 | (1.98-11.50) | <.001 |
| Household mental illness | 9.34 | (4.27-20.41) | <.001 |
| ACE and irritable bowel or irregularity | |||
| ACE total | 1.43 | (1.16-1.77) | <.001 |
| ACE ≥ 4 | 7.65 | (2.78-21.10) | <.001 |
| Emotional abuse | 4.35 | (1.73-10.96) | .002 |
| Emotional neglect | 5.02 | (1.80-14.01) | .002 |
| Household mental illness | 7.42 | (2.89-19.06) | <.001 |
| ACE and antidepressants | |||
| ACE total | 1.45 | (1.21-1.74) | <.001 |
| ACE ≥ 1 | 3.81 | (1.95-7.45) | <.001 |
| ACE ≥ 4 | 4.47 | (1.86-10.71) | <.001 |
| Emotional abuse | 3.13 | (1.54-6.34) | .002 |
| Physical abuse | 2.49 | (1.15-5.42) | .021 |
| Sexual abuse | 3.50 | (1.49-8.23) | .004 |
| Emotional neglect | 7.51 | (3.18-17.74) | <.001 |
| Household substance abuse | 3.19 | (1.35-7.55) | .008 |
| Household mental illness | 5.30 | (2.51-11.16) | <.001 |
| ACE and anxiolytic drug | |||
| ACE total | 1.44 | (1.17-1.78) | <.001 |
| ACE ≥ 1 | 3.10 | (1.20-8.00) | .019 |
| ACE ≥ 4 | 6.10 | (2.16-17.26) | <.001 |
| Emotional abuse | 3.50 | (1.38-8.86) | .008 |
| Physical abuse | 3.38 | (1.26-9.10) | .016 |
| Sexual abuse | 4.27 | (1.46-12.53) | .008 |
| Emotional neglect | 7.06 | (2.54-19.58) | <.001 |
| Household mental illness | 4.79 | (1.86-12.37) | .001 |
| ACE and alcohol abuse | |||
| ACE total | 1.44 | (1.15-1.79) | .001 |
| ACE ≥ 1 | 5.35 | (1.70-16.81) | .004 |
| ACE ≥ 4 | 5.49 | (1.84-16.39) | .002 |
| Emotional abuse | 7.99 | (2.90-22.02) | <.001 |
| Physical abuse | 5.50 | (2.00-15.13) | <.001 |
| Emotional neglect | 3.50 | (1.12-10.88) | .031 |
| Household substance abuse | 3.56 | (1.15-11.06) | .028 |
| Household mental illness | 4.95 | (1.81-13.57) | .002 |
| ACE and 10 or more sexual partners | |||
| ACE total | 1.28 | (1.08-1.50) | .004 |
| ACE ≥ 1 | 2.33 | (1.29-4.19) | .005 |
| Physical abuse | 2.88 | (1.38-5.97) | .005 |
| Parental separation or divorce | 7.54 | (3.06-18.55) | <.001 |
| Household substance abuse | 3.42 | (1.50-7.79) | .003 |
| Incarcerated household member | 2.07 | (0.33-12.88) | .436 |
| ACE and sex addiction | |||
| ACE total | 1.55 | (1.07-2.25) | .020 |
| ACE ≥ 1 | 5.01 | (0.98-25.62) | .053 |
| ACE ≥ 4 | 4.19 | (0.71-24.57) | .113 |
| Emotional abuse | 4.52 | (1.06-19.23) | .041 |
| Sexual abuse | 8.81 | (1.78-43.64) | .008 |
| Emotional neglect | 6.94 | (1.43-33.59) | .016 |
| Incarcerated household member | 24.55 | (1.39-434.30) | .029 |
| ACE and eating disorder | |||
| ACE total | 1.41 | (1.13-1.76) | .002 |
| ACE ≥ 1 | 2.65 | (0.94-7.45) | .064 |
| ACE ≥ 4 | 8.16 | (2.76-24.13) | <.001 |
| Emotional abuse | 3.16 | (1.13-8.83) | .028 |
| Sexual abuse | 5.11 | (1.69-15.51) | .004 |
| Emotional neglect | 9.33 | (3.19-27.32) | <.001 |
| Household mental illness | 5.44 | (1.94-15.23) | .001 |
| ACE and self-defined work addiction | |||
| ACE total | 1.60 | (1.32-1.93) | <.001 |
| ACE ≥ 1 | 5.47 | (2.44-12.29) | <.001 |
| ACE ≥ 4 | 6.48 | (2.63-15.99) | <.001 |
| Emotional abuse | 6.66 | (3.12-14.22) | <.001 |
| Physical abuse | 3.29 | (1.44-7.51) | .005 |
| Sexual abuse | 5.89 | (2.39-14.51) | <.001 |
| Emotional neglect | 11.58 | (4.76-28.19) | <.001 |
| Household mental illness | 6.06 | (2.77-13.24) | <.001 |
| ACE and self-defined burnout | |||
| ACE total | 1.47 | (1.22-1.76) | <.001 |
| ACE ≥ 1 | 1.96 | (1.06-3.64) | .033 |
| ACE ≥ 4 | 7.53 | (3.05-18.60) | <.001 |
| Emotional abuse | 3.08 | (1.54-6.19) | .002 |
| Physical abuse | 3.49 | (1.64-7.42) | .001 |
| Sexual abuse | 3.97 | (1.69-9.33) | .002 |
| Emotional neglect | 4.95 | (2.11-11.61) | <.001 |
| Physical neglect | 19.27 | (2.21-168.17) | .007 |
| Household mental illness | 3.59 | (1.71-7.53) | <.001 |
ACE, adverse childhood event; CI, confidence interval; OR, odds ratio.
The individual ACEs with the 2 highest odds ratios associated with 10 or more sexual partners were parental separation or household substance abuse; for sex addiction household member incarceration and sexual abuse; for eating disorders, emotional neglect and household mental illness; for work addiction, emotional neglect and emotional abuse; and for burnout, physical neglect and emotional neglect. (For space, Table 7 has been abbreviated. For interested readers, full results are available in Supplemental Table 3.)
Pairwise Clustering of Adverse Childhood Events and Health Outcomes
We hypothesized that adverse childhood experiences might not occur singly and might “cluster”; that is, whether surgeons who suffered 1 type of abuse or neglect in a family of origin would suffer others. This fact is intuitively obvious. For example, children who are sexually abused are, by definition, also being emotionally and physically abused, and there is mental illness in the family—so these children are not suffering 1 abuse type but at least 4. Clustering of adverse experiences turned out to be the case (Supplemental Table 4, located online at https://doi.org/10.1093/asj/sjae214). For example, among the 50 participants who had suffered emotional abuse (first column), 48% also had physical abuse, 22% had sexual abuse, 40% had emotional neglect, and 48% per household mental illness. Most striking was the clustering among those surgeons who had cited physical neglect: 100% also cited physical abuse, 71.4% sexual abuse and 71.4% emotional neglect, 57.1% parental separation or divorce, and 85.7% household mental illness. Clustering of physical and sexual abuse in female physicians was also documented by Stork et al.11
In the same way, health outcomes clustered (Supplemental Table 5, located online at https://doi.org/10.1093/asj/sjae214). For example, among those surgeons who cited chronic fatigue (second column), 62.5% also had autoimmune disease and chronic pain, 75% had depression, 87.5% had headaches or migraines, 75% had irritable bowel and were taking antidepressants or anxiolytic drugs, 62.5% had both eating disorders and work addiction, and 75% self-diagnosed as burned out.
Bar Graph Representation of the Most Prevalent Adverse Childhood Events and Health Clusters in The Aesthetic Society Respondents
Figure 1 is an effort to “profile” approximately 50% of our respondents and diagram the most frequently occurring ACE components and health combinations cited by 13 or more respondents. The number at the head of each bar indicates the number of surgeon respondents represented by that bar, and the bullets beneath each bar designate the ACE or health problem cited by that group of surgeons. For example (far left) 20 participants reported both emotional abuse and depression. For ease of reading, the transverse red boxes circle the most common health issues, for example, emotional abuse was experienced by 11 columns of surgeons. Similarly, the vertical green box highlights those ACEs and health responses common to approximately half of The Aesthetic Society respondents: emotional abuse, household mental illness, depression, on antidepressants, and burnout.
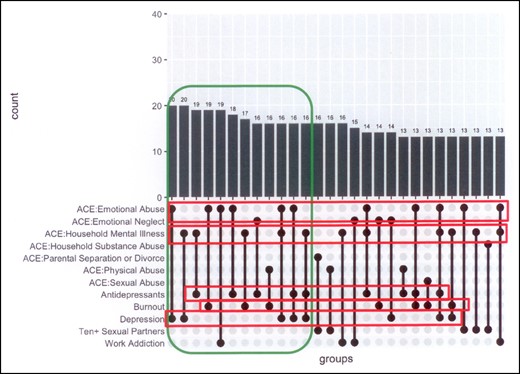
Co-occurrence of most commonly cited adverse childhood experience components and health outcomes among The Aesthetic Society respondents.
DISCUSSION
Our previous papers and text made the connection between adverse childhood experiences (ACEs) and adult health and behavior in plastic surgery patients.9,10,17,18 Although the ACE literature is comprehensive, only 4 studies to date have reported ACEs in physicians, and to our knowledge none have addressed a surgical population alone or plastic surgeons.2-10,17-23 No physician studies, to our knowledge, have documented all 10 individual ACEs in physicians; documented that ACEs were experienced in groups (clusters); or performed logistic regression to test the probabilities that total ACEs or individual ACEs were associated with adult health or self-harming behaviors, including depression, work addiction, and burnout, especially relevant today. Therefore, we believe that we have introduced timely new information to the medical and ACE literature.
We modeled the current research on the CDC/Kaiser Permanente adverse childhood experiences study, in which it was demonstrated that ACEs were not only common but correlated directly with many common adult health problems, even illnesses occurring decades after childhood abuse or neglect—not just the expected ones, such as job loss, promiscuity, depression, or substance abuse, but less obviously explainable illnesses, for example, heart disease without preceding risk factors, multiple sclerosis, cancers, and primary pulmonary fibrosis.1-10,19-23 These physiologic and behavioral changes can be explained by adaptive behaviors or by brain alterations (see following).24-31
Although our data suggest that ACEs may be lower in plastic surgeons than in the population at large and therefore mirror other studies in physicians (see following), several observations can be made.11-14
Adverse childhood experiences were common in The Aesthetic Society respondents (Table 3). Forty-two percent of respondents had at least 1 ACE, a significantly lower total prevalence than the 64% in the CDC/Kaiser medical patient population (P < .0001). Mean ACE score was 1.1. Nonetheless, our 41.7% prevalence comports with the 49% reported by Yellowlees et al for 300 physicians in a Northern California community, and the 45% reported by Stork et al for 226 community physicians in Michigan, but higher than the 15.6% prevalence in 7360 physicians (23% surgeons), and far lower than the 70% reported by Williams et al in 123 practicing and trainee physicians being treated for boundary violations, disruptive behaviors, or substance abuse.2,11-14
In all, 9.9% of our surgeons had 4 or more ACEs, similar to the CDC/Kaiser data and to other physician and medical student surveys; but this represents less than half of the 22% prevalence reported in physicians treated for professionalism lapses.11-13,15
The frequency of emotional abuse cited by our surgeons was almost double the Kaiser prevalence (19.8% vs 10.6%, P < .0001). A similar prevalence was reported by Trockel et al.14 Other ACEs were the same or lower than Kaiser data. Our most common individual ACEs were household mental illness (16.3%), physical abuse (14.7%), sexual abuse (10.7%), household substance abuse (10.7%), and emotional neglect (11.1%). Those individual ACEs are similar to those reported in the other 4 published physician studies.11-15 Such prevalences may surprise readers unfamiliar with the childhood trauma literature or with data in the United States population at large.2-10,32
Adverse childhood events differed by gender (Table 4). Our female surgeons reported twice as much sexual abuse (16.9% vs 8.3%), and 6 and 4 times, respectively, more physical neglect (7% vs 1.1%) and violence against their mothers (7% vs 1.7%) than our male surgeons. Similar numbers are reported in physician and medical student studies.11,15 The childhood trauma literature also supports these disturbing results.33,34
Self-reported adult health problems also differed by gender (Table 5). We surveyed our respondents for 25 common adult health problems, adding those that have been correlated to ACEs in the literature (Supplemental Table 1, located online at https://doi.org/10.1093/asj/sjae214). Among all respondents, reported heath and behavioral issues with prevalences of 10% or more, in descending order were: hypertension (29.4%); burnout (21.4%); 10 or more sexual partners (21%); taking antidepressants (19.8%); depression (15.9%); headaches and migraines (15.1%); hyperlipidemia (15.1%); and being work-addicted (14.3%) [these data were collected by the authors but were not included in this paper]. Health data were stratified by gender (Table 4). Some results were not surprising: males were 4 times more likely to be overweight than females (BMI >30 12.2% vs 2.8%), twice as likely to be hypertensive (34.8% vs 15.5%), and almost 3 times more likely to be hyperlipidemic (18.8% vs 5.6%). However, our female surgeons were twice as likely to be taking antidepressants (31% vs 15.5%) and nearly twice as likely to diagnose themselves as burned out (32.4% vs 17.1%). These burnout and depression gender dominances in females have been described by others, and burnout and depression have been documented for both genders in the medical and plastic surgery literature in prevalences as high as 55%.14,35-38 Although our surgeon respondents self-diagnosed burnout, a 2015 survey of 1691 US plastic surgeons in active practice and assayed by the validated Maslach Burnout Inventory generated a burnout rate of 29.7%, nearly the same as our data.39 Females are particularly at risk.35-40 Based on the surgical literature, our data for both male and female plastic surgeons may even be spuriously low.41-44
Total ACE scores predicted adult health and behavioral issues. Associations between adverse childhood experiences and many adult health problems, addictions, and self-harming behaviors have already been broadly cataloged.3,6,7,19-21,23-25,45 The longitudinal nature of the original Kaiser Permanente study allowed investigators to demonstrate dose-response ACE-associated connections to diseases that occurred decades after the trauma.24,25 Although adult behavior may be attributed in part to adaptive habits borne of childhood experiences, biological explanations are also emerging to explain these putative disease connections.10 In some individuals, childhood trauma appears to adversely affect the hypothalamic-pituitary axis and the adaptability of the neuroendocrine stress response system, epigenetics, and brain function, producing chronic physiologic changes that predispose to illness.46-56 Specific trauma-induced anatomical and physiological changes in the brain have been identified, including those that produce learning and behavioral problems and psychopathology.56-61
We found that total ACE score predicted 13 of the 25 health problems queried (Table 6). Direct predictive relationships existed between total and individual ACEs and autoimmune disorders, chronic fatigue, chronic pain, depression, irritable bowel, antidepressant or anxiolytic use, alcohol abuse, 10 or more sexual partners, sex or work addiction, eating disorders, work addiction, and burnout (all P < .020 or less). This associative correlation is not new, only newly documented in our surgical population; previous investigators have already connected total ACE scores in direct dose-response relationships to autoimmune disorders, chronic fatigue, chronic pain, depression, irritable bowel syndrome, antidepressant or anxiolytic use, alcohol abuse, promiscuity, sex or work addiction, eating disorders, and burnout.13,14,62-85
Individual ACEs predicted health outcomes (Supplemental Table 3, located online at https://doi.org/10.1093/asj/sjae214). Because total ACE scores predicted 13 of the assayed 25 health and behavioral outcomes, we sought to determine which individual ACEs were responsible for those predictions. An abbreviated summary is shown in Table 7. Complete data are contained in Supplemental Table 3. All health outcomes had multiple predictive ACEs. Based on the highest single odds ratios, household mental illness predicted irritable bowel (OR 7.4, P < .001). Emotional abuse predicted alcohol abuse (OR 7.99, P < 001). Parental separation or divorce predicted 10 or more sexual partners (OR 7.54, P < .001). Incarceration of a household member predicted sex addiction (OR 24.55 P < .029). Physically and emotional neglect seemed to have the widest health effects on our respondents. Physically neglected surgeons had 35 times the chance of chronic fatigue (OR 35.29, P < .001); 21 times the chance of chronic pain (OR 21.24, P < .006); 13 times the likelihood of being depressed (OR 13.19, P < .003); and 19 times the chance of burnout (OR 19.27, P < .007). Emotional neglect predicted 12 times the likelihood of autoimmune disease (OR 12.18, P < .001); 9.3 times the chance of an eating disorder (OR 9.33, P < .001); 7.5 times the chance for antidepressant use (OR 7.5, P < .001); 7 times the chance for anxiolytic drug use (OR 7.0, P < .001); and nearly 12 times the likelihood of self-defined work addiction (OR 11.58, P < .001).
Each surveyed health or behavioral problem had 3 to 4 additional and statistically significant predictive ACEs; for example, sexual abuse also predicted sex addiction (OR 8.81, P < .008), a recognized contributing factor.86
As in the CDC/Kaiser Study, we found direct dose-response effects for many health issues: ACE score >4 was more strongly predictive than ACE score >1 for 11 of the 13 health problems for which significant associations were found: autoimmune disease, chronic fatigue, chronic pain, depression, irritable bowel, antidepressant and anxiolytic drug use, alcohol abuse, eating disorder, work addiction, and burnout. The observation that the more abuse and neglect in an individual's childhood, the worse his or her adult health was observed by the original investigators and remains unchallenged.2-6,9,20-23,25,29,87 Our data agree.
Household dysfunction types clustered. Surgeons who cited 1 adverse experience often reported others (Supplemental Table 4, which should be read in columns, located online at https://doi.org/10.1093/asj/sjae214). Previous clustering studies have been performed to identify children and adolescents at risk of addictions, violence, or self-injury.88-92 Each health or behavioral issue clustered, some more commonly than others. The 2 ailments with the most coexisting health problems (Supplemental Table 5, located online at https://doi.org/10.1093/asj/sjae214) were chronic fatigue (whose surgeons also suffered from autoimmune disease, chronic pain, depression, headaches or migraines, irritable bowel, were on antidepressants or anxiolytics, and were work-addicted) and those with eating disorders (who also suffered depression, headaches or migraine, were taking antidepressants or anxiolytics, were work addicted, and had burnout).
A loose portrait of The Aesthetic Surgery respondents can be drawn. Figure 1 depicts the ACEs and health problems of surgeon groups with more than 13 respondents. Half of those respondents whose data are represented (circumscribed by the green box) cited emotional abuse, household mental illness, depression, taking antidepressants, and self-diagnosed burnout (red boxes).
Limitations
This was a brief email survey, known to have inherent limitations.93-95 Our numbers reflect a small (6.43%) percentage of The Aesthetic Society members who chose to respond and may therefore not reflect total membership. Response rates in the other published physician studies vary widely, from 6.8% to 56%.11-14 In all, 9.1% of our respondents refused to indicate the region where they lived (Table 2), suggesting either that these were international members or that, despite our description of anonymous deidentified surveys, some respondents were not reassured. We do not know if those refusals affected our data.
It is possible that some respondents were denying, rationalizing, or minimizing their childhood experiences. This phenomenon has been documented in as many as 20% of respondents to a childhood trauma assay.96,97 People cope with trauma by switching off the tools that they use to interact with their environments: trauma induces walls and inhibits resilience.28 Childhood trauma affects brain structure and function and autobiographical memory.30,46-61,98-101 Minimization, rationalization, denial, and even assuming one's childhood to be normal without basis for comparison may have affected our self-reported data.28,100,101 Children may also blame themselves and therefore discount the adversities they encountered, for example, “It was my fault that my parents divorced,” “I deserved to be beaten,” “My mother said I made her drink.”
The painful final common pathway of childhood trauma is shame, which, aside from its physiological effects, encourages behaviors that are selected for their capacity to medicate the shame.3-9,19-22,30
Precisely because trauma before age 18 is, by definition, inflicted on the developing midbrain before the cortex comes fully on-line, treatment aimed only at the cortex, for example, cognitive behavior therapy, may not access all areas most severely affected. Trauma centers, which direct therapy at the deeper brain areas affected by childhood injuries but become less consciously accessible in adulthood, can ameliorate this limitation.102
Depression and workaholism were self-diagnosed. However, self-diagnosis of depression in the lay public is 75% correct.103 Arguably surgeons should be even more accurate. In addition, our respondents’ reported depression and antidepressant use prevalences correlate (Table 5).
True work addiction is seductive, especially for physicians.102 It is self-reinforcing, triggers euphoria from dopamine release in the limbic system. and can create prestige, income, fame, and a false sense of self-worth.104-106 Therefore, true work addiction differs from working excessively; and without having defined it for the respondents, we cannot be sure what we measured. But the data at the very least indicate that 23% of males and 13% of female surgeons believe they are overworked, regardless of motivation.
The adverse child experiences literature has documented ACE prevalences of 64% in the lay public.2-9 We found prevalences as high as 85% in plastic surgery patients and showed correlations to PTSD, body shame, and chronic dissatisfaction after surgery—many of the characteristics that define body dysmorphic disorder.10,107 These data suggest that some plastic surgeons in The Aesthetic Society share these trauma histories and manifest their protean health and behavioral effects on mind and body.
It is also important to remember that not all adverse experiences are equally traumatic to everyone. Did other respondents face different, unidentified childhood trauma consequences, or did they instead demonstrate resilience or other protective traits that served as antidotes to their adverse experiences?107,108 Researchers now invoke “counter-ACEs,” supportive environments and mentors outside the turbulent family that helped generate resilience.109 We have found exactly that in our patient interactions.107
Why we became surgeons, our adult health, how we behave, how we respond to pressures and crises, what drives us, whether we medicate our unhappiness with addictions or self-harming behaviors, work to validate our self-worth, or burn out is not accidental but shaped in part by our teachers and peers and also by our childhood experiences, good and bad. Medicine in general and plastic surgery in our case lag behind other fields in recognizing the frequency and consequences of adversity in the formative childhood years. We have previously discussed how to recognize the remnants and manifestations of childhood trauma in our patients. We hope that further research in patient groups and in ourselves will guide better patient care and better self-care for those of us who are their providers.
CONCLUSIONS
This paper presents the first published data of adverse childhood experiences in plastic surgeons and also separates individual ACEs and documents their correlations with individual adult health issues. We draw a profile, if accurate, of The Aesthetic Society member childhoods that is sobering—a group of respondents of whom 42% had significant childhood abuse or neglect before age 18, and which by logistic regression predicted the probabilities of many types of adult health and behaviors in a dose-response fashion, and suggests a world for some of our colleagues that is characterized by depression, antidepressants, burnout, and work overload.
Supplemental Material
This article contains supplemental material located online at https://doi.org/10.1093/asj/sjae214.
Acknowledgments
The authors gratefully acknowledge the expert research and technical assistance of Courtney Muehlebach and Charlotte A. Constantian.
Disclosures
The authors declared no potential conflicts of interest with respect to the research, authorship, and publication of this article.
Funding
Dr Constantian received a research grant through The Aesthetic Foundation, also known as The Aesthetic Society Education and Research Foundation (ASERF), for this research in 2021. This funding was utilized to compensate a biostatistician and to apply for IRB exemption, as described in “Methods.” Dr Constantian was not personally compensated. Otherwise, the authors have neither financial interests nor commercial associations to declare in relation to the content of this article.
REFERENCES
CDC. Accessed November 13, 2024. https://www.cdc.gov/aces/about/index.html
Author notes
Dr Constantian is a clinical professor of surgery, Department of Surgery, Division of Plastic Surgery, University of Wisconsin School of Medicine and Public Health, Madison, WI, USA.
Mr Zaborek is a biostatistician, Department of Biostatistics and Medical Informatics, University of Wisconsin School of Medicine and Public Health, Madison, WI, USA.

