


Abstract
The efficacy of stromal vascular fraction (SVF) treatment, or stem cell treatment, directly depends on the SVF cell count and the cells’ viability. The SVF cell count and viability are in direct correlation with the adipose tissue harvesting site that yields SVF cells, making this research a contribution to developing tissue guidance.
The aim of this study was to investigate the importance of harvesting subcutaneous adipose tissue–derived SVF cells on the concentration and viability of SVF.
Adipose tissue was collected by vibration-assisted liposuction from the regions of the upper and lower abdomen, lumbar region, and inner thigh region. With the semiautomatic UNISTATION 2nd Version system, the obtained fat was chemically processed (with collagenase enzyme) and a concentrate of SVF cells was obtained by centrifugation. These samples were then analyzed with the Luna-Stem Counter device to measure the number and viability of SVF cells.
When comparing the regions of the upper abdomen, lower abdomen, lumbar region, and inner thigh, the highest concentration of SVF was found in the lumbar region, specifically at an average of 97,498.00 per 1.0 mL of concentrate. The lowest concentration was found in the upper abdominal region. When ranking the viability values, the highest cell viability of SVF was observed in the lumbar region, measuring 36.6200%. The lowest viability was found in the upper abdominal region, measuring 24.4967%.
By comparing the upper and lower abdominal, lumbar, and inner thigh regions, the authors have come to the conclusion that, on average, the largest number of cells with the highest viability was obtained from the lumbar region.
Adipose tissue–derived stem cells (ASCs) represent a subtype of mesenchymal stem cells that can be easily isolated from adipose tissue, have a high regenerative capacity, and represent 62.2% of all stromal vascular fraction (SVF) cells.1,2 Stem cells have unlimited potential in advanced tissue engineering and cell therapy, because they can self-renew and differentiate into multiple cell lineages, which can provide therapeutic solutions for numerous diseases.3,4 For cell therapy, stem cells are applied directly to damaged areas.
Compared to differentiated mature cells, the stem cells have beneficial characteristics, including a great capacity to differentiate into cells of the desired cellular phenotype, to support vascularization, and to maintain the immunomodulatory capacity and actually reduce a strong inflammatory response to certain agents.
Clinically applied SVF or stem cells can successfully treat a wide range of diseases, such as organ failure, congenital structural anomalies, and tissue loss, and they can be utilized for organ and autologous tissue transplantation. Advanced regenerative therapy focuses on research regarding stem cell therapy that has been employed successfully in the repair of damaged tissue, and on its potential for replacing the inefficient organ as a whole.
We now focus on creating certain protocols regarding administration of the SVF (ie, stem cells), the concentration of SVF cells administered, and the SVF administration method used, that is the required number of repetitions of treatment. It is also important to point out that the procedure for the isolation of stem cells from adipose tissue and the selection of the region from which adipose tissue is taken to obtain SVF concentrate cells are of great importance, because these factors greatly affect the number of stem cells, their concentration, and their viability.5,6 In addition to the effect of different adipose tissue harvesting sites on the number of SVF cells and their viability, in our study we included the effect of age and BMI (body mass index) on the concentration and viability of SVF cells.6,7 In our work, SVF was extracted from adipose tissue obtained from lipoaspiration (vibration-assisted liposuction) and use of the UNISTATION 2nd Version system (NeoGenesis, Seoul, South Korea), an automated device for SVF extraction.8
Recent reports of the results of the clinical application of SVF have ranked them equal to the application of ASCs, and even higher.9-17 In addition to stem cells, SVF also contains certain other groups of cells, such as endothelial precursor cells (EPCs), endothelial cells (ECs), macrophages, smooth muscle cells, lymphocytes, pericytes, and preadipocytes, T regulatory cells that additionally enhance the regenerative capacity of SVF.18-20
Many techniques are currently employed to harvest adipose-derived SVF, starting with the classic removal of adipose tissue with the Coleman lipostructure technique for classic liposuction with a special emphasis on the tissue harvesting site, which affects the count and viability of SVF, that is, ASCs.21,22 SVF cells were solely obtained from white adipose tissue located in the subcutaneous fat layer, but we should also mention brown adipose tissue, which has the highest concentration of progenitor cells and is in inaccessible locations, such as the mediastinum.23,24
In our practice, we utilized the SVF obtained for the treatment of acute damage to the cartilage, joint capsule and ligaments of the knee and hip joints, and to a lesser extent in other parts of the locomotor system, as well as in the treatment of chronic arthrosis of the aforementioned joints. We also applied SVF for face and neck rejuvenation in combination with PRP (platelet-rich plasma), as well as in lipotransfer, in which we mixed it with adipose tissue and applied it to certain regions of the body, contributing to an increase of the fat graft survival rate at those locations.
METHODS
The research was conducted from February 2022 to January 2023 and included 30 patients of different ages and sexes. The study was approved by the Ethics Committee for Research on Humans and Biological Material of the Faculty of Medicine of the University of Banja Luka. The research project included patients over age 18 who were familiar with the examination method and did not have any serious diseases (malignancy, diabetes, serious heart disease). Each patient who was included in the research gave written consent.
Adipose tissue was harvested from 4 regions, including the upper abdominal region, referring to the upper central region bounded superiorly by costal margins and inferiorly by a horizontal line that ran at the level of the umbilicus; the lower abdominal region, bounded superiorly by a horizontal line that ran at the level of the umbilicus and inferiorly by the pelvic and groin regions; the lumbar region, referring to the posterior trunk below the costal margins and bounded inferiorly by the sacrum and pelvic bone; and finally the inner thigh region.
After injecting the tumescent solution, we obtained the fat by classic vibration-assisted liposuction with 3-mm cannulae, which we placed through small incisions.25 The obtained fat was processed to obtain SVF with the semiautomatic UNISTATION 2nd Version system, as well as manual preparation with common laboratory equipment. The first step was to centrifuge the obtained fat for 5 minutes at 800 revolutions per minute to obtain concentrated adipose tissue and separate the layer of red blood cells (RBCs). We mixed 20 mL of centrifuged adipose tissue with 20 mL of 0.1% collagenase and performed the mixing process at a temperature of 37°C for 30 minutes, after which we centrifuged the resulting mixture for 5 minutes at 800 revolutions per minute. After centrifugation, we took the syringe carefully, because in the lower part of the syringe near the very top there was a concentrate of 5 mL of SVF. We finally mixed that concentrate with 5 mL of platelet-poor plasma (PPP) and 30 mL of NaCl 0.9%, and put it to centrifugation for 5 minutes at 800 revolutions per minute to carry out the collagenase neutralization and washing process. From the centrifuged liquid, we separated 5 mL of SVF concentrate, which was located near the tip of the syringe.
We determined the number and viability of SVF cells (nucleated cells) with the Luna-Stem Dual Fluorescence Cell Counter (Logos Biosystems, Gyeonggi-do, South Korea), which is an advanced device for analyzing the number and viability of SVF cells. It uses acridine orange and propidium iodide to mark and distinguish between live and dead nucleated cells, which represent SVF cells; cells that are not stained represent nonnucleated cells. The device enables significant quality and sensitivity for stem cells and other SVF cells. Dead nucleotide cells are colored red, while living nucleotide cells are colored green (Figures 1, 2).
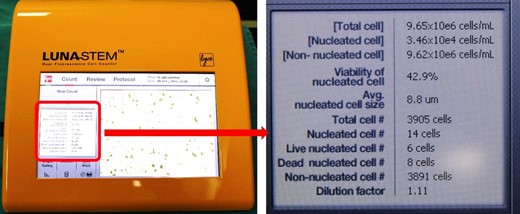
The screen shows all the data automatically calculated by the Luna-Stem Dual Fluorescence Cell Counter.
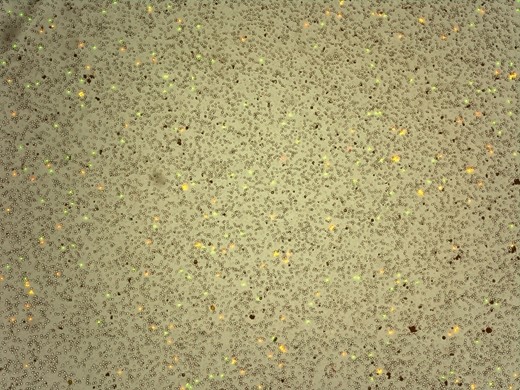
Image from the Luna-Stem Dual Fluorescence Cell Counter. Dead nucleotide cells are colored red, and living nucleotide cells are colored green.
Acridine orange is a nucleic acid-binding fluorophore that can permeate viable cell membranes to selectively stain all nucleated cells. It is excited at wavelengths of approximately 502 nanometers (nm) when intercalated with dsDNA, emitting a green fluorescence with wavelengths of approximately 525 nm. Propidium iodide is not suitable for total cell counting or nucleated cell identification due to the assay's inability to permeate intact cell membranes. It is only able to cross into cells with compromised membranes. This makes it useful in differentiating viable from nonviable cells. It is excited at wavelengths of approximately 535 nm and fluoresces red light in the region of 617 nm.
The device can recognize different cells in the composition of the obtained concentrate as nucleotide cells, or SVF (alive or dead), namely: stem cells, fibrocytes, adipocytes, EPCs, ECs, macrophages, smooth muscle cells, lymphocytes, pericytes, and preadipocytes, T regulatory cells; and as nonnucleotide cells, namely: RBCs, embryonic stem cells, and microvascular elements.
The numbers and analysis of cell viability were automatically calculated by the device, which can be seen on its display. The data were processed and analyzed with the Statistical Package for the Social Sciences (SPSS) version 23 (IBM Corp., Armonk, NY) with nonparametric tests (the Friedman test and Wilcoxon signed-rank test) and the Spearman correlation coefficient. The statistical significance was P < .05.
RESULTS
The respondents were aged from 32 to 74 years (average 47.7), with a male-to-female patient ratio of 3:27. Body mass index ranged from 23.055 to 43.382 (average 27.161). The number of all cells found in the resulting concentrate, or SVF cells (nucleotide cells) and other nonnucleotide cells ranged from 1.E + 006 to 8, E + 007 cells/ml (1210000 to 76100000). R1 indicates the upper abdomen region, above the navel, R2 indicates the lower abdomen region, R3 indicates the lumbar region, and R4 indicates the inner thigh region. Table 1 and Figure 3 show the total number of cells in the obtained concentrate by the region from which the adipose tissue was harvested. By ranking the values of the number of cells in the concentrate, the mean ranks obtained were: 2.48, 2.28, 2.93 and 2.3 for regions R1, R2, R3 and R4, respectively. Applying the Friedman test, no statistically significant difference (χ2 = 4.967, P = .174) was obtained in the total cells between the regions.
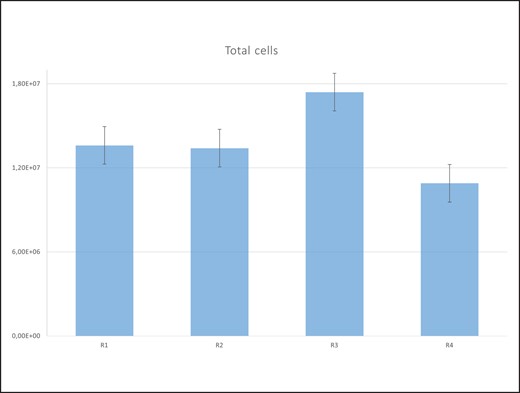
Total cells by region. R1, upper abdominal region; R2, lower abdominal region; R3, lumbar region; R4, inner thigh region.
Age, Body Obesity, and Total Number of Cells by Region
| Characteristic | Min | Max | IQR | Median | Mean | SD |
|---|---|---|---|---|---|---|
| Age | 32 | 74 | 40-52 | 43 | 47.7 | 13.2148 |
| Body obesity | 23.055 | 43.382 | 24.6097-26.7299 | 25.388 | 27.161 | 5.623 |
| R1 | 1.E + 006 | 2.E + 007 | 6.51E + 006-1.98E + 007 | 1.51E + 007 | 1.36E + 007 | 7.025E + 006 |
| R2 | 1.E + 006 | 8.E + 007 | 4.15E + 006-1.41E + 007 | 9.88E + 006 | 1.34E + 007 | 1.635E + 007 |
| R3 | 3.E + 006 | 4.E + 007 | 7.45E + 006-2.43E + 007 | 1.90E + 007 | 1.74E + 007 | 1.069E + 007 |
| R4 | 3.E + 006 | 2.E + 007 | 3.36E + 006-1.80E + 007 | 1.07E + 007 | 1.09E + 007 | 6.361E + 006 |
IQR, interquartile range; max, maximum; min, minimum; R1, upper abdominal region; R2, lower abdominal region; R3, lumbar region; R4, inner thigh region; SD, standard deviation; E, exponential notation.
Comparing the total cells between paired regions with the Wilcoxon signed-rank test, a statistically significant difference (P = .006) was obtained in the number of SVF cells between regions 4 and 3. Table 2 and Figure 4 show the numbers of SVF cells, that is, nonnucleotide cells.
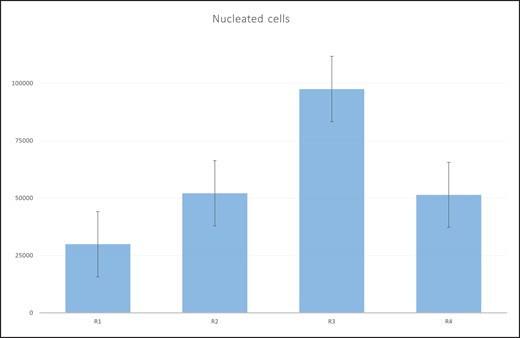
The number of stromal vascular fraction (SVF) cells by region. R1, upper abdominal region; R2, lower abdominal region; R3, lumbar region; R4, inner thigh region.
Number of SVF Cells by Region
| Characteristic | Min | Max | IQR | Median | Mean | SD |
|---|---|---|---|---|---|---|
| Age | 32 | 74 | 40–52 | 43 | 47.7 | 13.2148 |
| Body obesity | 23.055 | 43.382 | 24.6097–26.7299 | 25.388 | 27.161 | 5.623 |
| R1 | 0 | 98900 | 6800.00–40175.00 | 23500.00 | 29914.33 | 29050.574 |
| R2 | 2470 | 270000 | 12400.00–51950.00 | 24700.00 | 52118.00 | 68276.358 |
| R3 | 0 | 729000 | 7420.00–64900.00 | 17300.00 | 97498.00 | 210672.459 |
| R4 | 9890 | 183000 | 14200.00–92100.00 | 34600.00 | 51411.33 | 47861.538 |
IQR, interquartile range; max, maximum; min, minimum; R1, upper abdominal region; R2, lower abdominal region; R3, lumbar region; R4, inner thigh region; SD, standard deviation; SVF, stromal vascular fraction.
By ranking the SVF concentration values, the mean ranks obtained were: 2.27, 2.45, 2.83 and 2.45 for regions R1, R2, R3 and R4, respectively. Applying the Friedman test, no statistically significant difference (χ2 = 3.143, P = .370) was obtained in the concentration of SVF between regions. Comparing the number of SVF cells between paired regions with the Wilcoxon signed-rank test, no statistically significant differences were noted (Table 3).
Number of SVF Cells and Statistical Significance Between Regions
| Regions | Negative ranks | Positive ranks | Ties | P |
|---|---|---|---|---|
| R2–R1 | 17 | 12 | 1 | .496a |
| R3–R1 | 14 | 12 | 4 | .248a |
| R4–R1 | 10 | 20 | 0 | .069a |
| R3–R2 | 17 | 11 | 2 | .855a |
| R4–R2 | 13 | 17 | 0 | .975a |
| R4–R3 | 12 | 18 | 0 | .805a |
| Regions | Negative ranks | Positive ranks | Ties | P |
|---|---|---|---|---|
| R2–R1 | 17 | 12 | 1 | .496a |
| R3–R1 | 14 | 12 | 4 | .248a |
| R4–R1 | 10 | 20 | 0 | .069a |
| R3–R2 | 17 | 11 | 2 | .855a |
| R4–R2 | 13 | 17 | 0 | .975a |
| R4–R3 | 12 | 18 | 0 | .805a |
Wilcoxon signed-rank test. R1, upper abdominal region; R2, lower abdominal region; R3, lumbar region; R4, inner thigh region; SVF, stromal vascular fraction.
Correlation is significant at the 0.01 level with a positive sign between the respondent's age and the number of SVF cells in the R2 region (ρ = 0.490, P = .006); obesity (BMI>24 kg/m2 for females and BMI>25 kg/m2 for males) and the number of SVF cells in the R2 region (ρ = 0.534, P = .002); and between the number of SVF cells in the R2 and R4 regions (ρ = 0.504, P = .005). Correlation is significant at the 0.05 level with a positive sign between the number of cells in regions R1 and R4 (ρ = 0.400, P = .029).
Table 4 and Figure 5 show the viability of SVF cells expressed as a percentage in relation to the regions of adipose tissue collection. By ranking the viability values, the average ranks obtained were: 2.13, 2.53, 2.60 and 2.73 for regions R1, R2, R3 and R4, respectively. Applying the Friedman test, no statistically significant difference (χ2 = 3.843, P = .279) was obtained in terms of viability in relation to regions. Comparing the viability of SVF cells between paired regions with the Wilcoxon signed-rank test, a statistically significant difference (P = .049) in viability between regions 3 and 1 was obtained (Table 5).
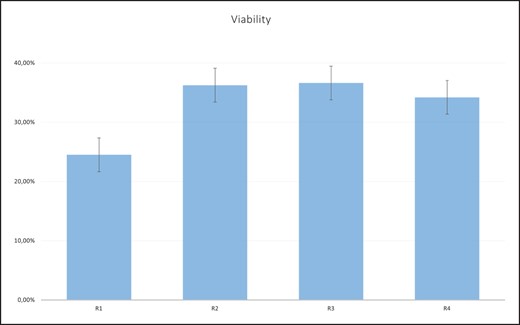
Viability (percentage) of stromal vascular fraction (SVF) cells by region. R1, upper abdominal region; R2, lower abdominal region; R3, lumbar region; R4, inner thigh region.
Cell Viability by SVF Region
| Characteristic | Min | Max | IQR | Median | Mean | SD |
|---|---|---|---|---|---|---|
| Age | 32 | 74 | 40-52 | 43 | 47.7 | 13.2148 |
| Body obesity | 23.055 | 43.382 | 24.6097-26.7299 | 25.388 | 27.161 | 5.623 |
| R1 | 0.00% | 100.00% | 0.00%-30.20% | 22.6500% | 24.4967% | 29.56711% |
| R2 | 0.00% | 100.00% | 5.775%-53.875% | 34.1500% | 36.2533% | 32.44404% |
| R3 | 0.00% | 82.00% | 17.50%-66.70% | 32.8500% | 36.6200% | 26.77449% |
| R4 | 0.00% | 100.00% | 16.575%-50.00% | 30.4500% | 34.2033% | 23.67521% |
IQR, interquartile range; max, maximum; min, minimum; R1, upper abdominal region; R2, lower abdominal region; R3, lumbar region; R4, inner thigh region; SD, standard deviation; SVF, stromal vascular fraction.
Correlation of SVF Cell Viability and Statistical Significance Between Regions
| Regions | Negative ranks | Positive ranks | Ties | P |
|---|---|---|---|---|
| R2–R1 | 9 | 14 | 7 | .094a |
| R3–R1 | 10 | 17 | 3 | .049a,b |
| R4–R1 | 9 | 19 | 2 | .056a |
| R3–R2 | 14 | 14 | 2 | .991a |
| R4–R2 | 13 | 16 | 1 | .957a |
| R4–R3 | 14 | 15 | 1 | .940a |
| Regions | Negative ranks | Positive ranks | Ties | P |
|---|---|---|---|---|
| R2–R1 | 9 | 14 | 7 | .094a |
| R3–R1 | 10 | 17 | 3 | .049a,b |
| R4–R1 | 9 | 19 | 2 | .056a |
| R3–R2 | 14 | 14 | 2 | .991a |
| R4–R2 | 13 | 16 | 1 | .957a |
| R4–R3 | 14 | 15 | 1 | .940a |
Wilcoxon signed-rank test. b Statistically significant. R1, upper abdominal region; R2, lower abdominal region; R3, lumbar region; R4, inner thigh region; SVF, stromal vascular fraction.
Correlation is significant at the 0.01 level with a positive sign between obesity and viability in region R2 (ρ = 0.538, P = .002). Correlation is significant at the 0.05 level with a positive sign between obesity and viability in region R4 (ρ = 0.411, P = .024); age of respondents and viability in region R2 (ρ = 0.431, P = .017); age of respondents and viability in region R3 (ρ = 0.412, P = .024); and viability in regions R2 and R4 (ρ = 0.381, P = .038).
DISCUSSION
It is a well-known fact that SVF has a wide range of applications in clinical medicine, and numerous studies have made their use even more accessible and practical.26-29 SVF can create numerous growth factors and cytokines that certainly affect the speed of chronic wound healing, reduce the inflammatory reaction as well as the formation of granulation tissue, and enhance vascularization, which increases the therapeutic significance.30 Rigotti et al repeatedly applied SVF derived from adipose tissue to chronic wound areas, where they observed ultrastructural improvements in the quality of the tissue itself, as well as formation of new vasculature and clinical improvement.31-33
In practice, SVF has performed well in treatment of pathological wound healing: in the creation of large amounts of scar tissue, reducing the scar tissue surface, and improving the color and elasticity of scar tissue.34,35 In plastic surgery, the use of SVF provides the advantage of lipotransfer of one's own adipose tissue, with strong regenerative potential and an increase in fat graft survival rate.36-38
In 2008, Yoshimura et al published for the first time the clinical application of SVF (ASCs) to enlarge and reshape the face. They harvested fat from the abdominal region by conventional liposuction, and employed one part of it to obtain SVF and the other part for grafting. After that, the freshly obtained SVF was mixed with the prepared fat for lipotransfer. A new strategy called cell-assisted lipotransfer (CAL) was developed, which significantly increases the survival rate of the transplanted adipose tissue and decreases the number of complications when compared to the standard procedure of adipose tissue transplantation without adding SVF.39
Matsumota et al came to the conclusion that SVF-enriched lipotransfer in the long term improves the volume of the transferred adipose tissue itself, which means that it directly affects the adipose tissue survival and reduces its resorption as well as the unwanted effects of the adipose tissue injections, such as scar connective tissue and cysts.17,40-42 As a result, cell-assisted lipotransfer (CAL) has been proposed in breast augmentation, facial lipoatrophy, and face lifting and reshaping.43,44
Mojallal et al have examined the effect of the recipient regions themselves (the region into which adipose tissue is transplanted) on the survival percentage of the transplanted adipose tissue. They examined the recipient regions of the face and came to the conclusion that the percentage of fat graft survival was the highest in the malar region and lateral cheek region, slightly lower in the nasolabial regions, and the lowest in the temporal region and lip region. No clear explanation exists, but it is assumed that fat graft survival depends on 3 factors: mature adipocyte survival, differentiation of adipose-derived stem cells (preadipocytes) in mature adipocytes, and the presence of extracellular matrix, which is absolutely necessary for the first 2 factors. In their opinion, the most probable explanation is that results are better in the areas where fat tissue can be found naturally.45
In his work, Coleman described facial contouring with a special autologous fat grafting technique employing the patient's own fat tissue, which is, after refinement, reinjected into certain areas of the face to reshape it. In his work, he emphasizes the great importance of harvesting from undamaged sites and the sites that will improve the body contour and cause no deformities. He especially emphasizes that any mechanical damage during the graft removal and attachment greatly affects its survival percentage at the recipient sites, and that parts of the transplanted graft sites should not be greater than 1.5 mm to ensure a higher graft survival.46
Khater et al have investigated effects of technical factors of fat graft preparation on the survival after transplantation to contribute to the optimization of procedures for graft harvesting and preparation for transplantation. They have come to the conclusion that non-centrifuged fat graft that is only washed with a physiological solution exhibits higher preadipocyte viability, that is, a higher ability to survive.47 The higher the SVF cell count and their viability, the greater the therapeutic efficiency of administered SVF cells.
In recent years, studies have described both qualitative and quantitative differences in SVF derived from adipose tissue from different regions of the body. Those studies have shown different results related to cell count and viability, such that donor site selection to obtain the cell concentration and viability is not a reliable enough method.48 Our work certainly contributes to a more accurate definition of adipose tissue sites containing the highest cell count and viability.
In our study, we harvested adipose tissue from certain regions by classic vibration-assisted liposuction and chemically dissolved the extracellular matrix (ECM) with collagenase enzyme 0.1% and obtained SVF after centrifugation and enzyme deneutralization. Previous works show that there is no significant difference between liposuction and fat tissue resection in the number and viability of SVF cells obtained.48
With the Luna-StemCell Counter we determined the cell count and viability of the SVF. In analysis of the count, characteristics, and viability of the SVF, many authors have utilized flow cytometry, an exceptional instrument for research work. Flow cytometry is a technology that provides rapid multiparametric analysis of single cells in solution. Flow cytometers utilize lasers as light sources to produce both scattered and fluorescent light signals that are read by detectors such as photodiodes or photomultiplier tubes. These light signals are converted into electronic signals that are analyzed by a computer and written to a standardized format (.fcs) data file. Imaging flow cytometry extends the power of traditional flow cytometry by adding high resolution optical and spectroscopic information.
Our results coincide with the results obtained by Gustavo et al, who stated that the highest concentration of SVF cells was obtained from the fat tissue of the upper back, and the lowest from the thigh region.49 Research by Jurgens et al show that there is no significant difference in the number of SVF cells obtained from the abdominal region and the thigh region, although there is a difference in the concentration, which is on average higher from the adipose tissue of the abdominal region and amounts to 5.1 ± 1.1% (mean ± standard error of the mean), whereas on average 1.2 ± 0.7% is obtained from the thigh region.6 There are also studies with results that differ from ours. For example, Tsekouras et al have concluded that the highest number of SVF cells is obtained from the subcutaneous tissue of the upper outer thigh, compared to the regions of the stomach, waist, and inner side of the knee (abdominal, waist, and inner knee; P < .05). SVF cell viability was excellent and ranged from 93.12 to 96.14%, with no significant difference between the regions from which adipose tissue was harvested.50
Iyyanki et al found a statistically significant difference in the concentration of SVF cells in the abdominal region compared to the axillary and lumbar regions. They also came to the conclusion that the number of SVF cells was statistically significantly higher in excised adipose tissue than when employing the Coleman technique with centrifugation of the adipose tissue harvested by liposuction.51
The real reason for the difference in concentrations of SVF cells in different tissue harvesting sites is still unknown, but it is associated with adipose tissue density, or the presence of connective tissue between the fat cells.51 This fact is supported by the results of our research, which showed that the highest concentration and viability of SVF cells was in the lumbar region, where the fat tissue density is greater than in the abdomen and inner thigh regions, because SVF cells are located in the ECM, which is higher in that region compared to others.
There are several limitations to this study. The first was the use of the Luna-Stem Dual Fluorescence Cell Counter to deliver the cell count and determine the viability of SVF cells, rather than flow cytometry, which provides a detailed analysis of all the cells constituting the SVF, determining the number and the characteristics of stem cells, EPCs, ECs, macrophages, and other SVF cells.
Second, in our study we analyzed 4 specific regions from which fat was harvested to obtain SVF. Our study did not encompass all possible regions from which fat can be harvested to obtain SVF, such as, for example, the inner side of the knee and the trochanteric region, which would contribute to more comprehensive research.
The objective of this study was to make a valuable contribution toward the development of more precise protocols for selecting fat grafting sites to obtain higher quality SVF. We hope to enhance the outcomes of SVF application.
CONCLUSIONS
The region chosen for harvesting adipose tissue with liposuction affects the quality of the SVF cells obtained. Comparing the upper and lower abdomen, the lumbar region, and the inner thigh region, we have concluded that, on average, the largest number of SVF cells and the highest percentage of cell viability was obtained from the lumbar region. The lowest cell number came from the upper abdominal region.
Disclosures
The authors declared no potential conflicts of interest with respect to the research, authorship, and publication of this article.
Funding
The authors received no financial support for the research, authorship, and publication of this article, including payment of the article processing charge.
REFERENCES
Author notes
Dr Jovic is a professor, University of Banja Luka, Faculty of Medicine, Special Hospital S-tetik, Banja Luka, Bosnia and Herzegovina.
Dr Kremenovic is a medical doctors, University of Banja Luka, Faculty of Medicine, Special Hospital S-tetik, Banja Luka, Bosnia and Herzegovina.
Dr Antonic is a medical doctors, University of Banja Luka, Faculty of Medicine, Special Hospital S-tetik, Banja Luka, Bosnia and Herzegovina.
Dr Preradovic is a professors, University of Banja Luka, Faculty of Medicine, Banja Luka, Bosnia and Herzegovina.
Dr Ljubojevic is a professors, University of Banja Luka, Faculty of Medicine, Banja Luka, Bosnia and Herzegovina.
Dr Aleksic is an university lecturer, University of Banja Luka, Faculty of Medicine, Banja Luka, Bosnia and Herzegovina.
Mr Jovic is a medical student, University of Ulm, Faculty of Medicine, Ulm, Germany.

