


Abstract
Recent research has indicated that in the upper face a delicate arrangement exists between the muscles of facial expression and the skin. This arrangement allows for immediate transmission of movements following muscle contraction, resulting in skin movements and skin rhytid formation.
To investigate age-related changes of the biomechanical unit formed by facial muscles, their connective tissue envelope, and the skin of the upper face.
A total of 76 Caucasian volunteers (30 males, 46 females) with a mean age of 42.2 years (SD 18.6) and a mean body mass index of 24.58 kg/m2 (SD 3.7) were investigated. Three upper facial regions were analyzed for skin firmness and elasticity with cutometric assessment, vertical and horizontal skin vector displacement using 3-dimensional imaging, and muscle activity with surface-derived electromyography.
Study participants of older age (>42.2 years), when compared with younger participants (≤42.2 years), showed increased skin firmness, at 0.20 mm vs 0.30 mm (P < .001); decreased skin elasticity at 53.2% vs 69.0% (P < .001); increased vertical (not horizontal) skin mobility at 3.56 mm vs 1.35 mm (P < .001); and decreased surface-derived electromyography (sEMG) signal of the frontalis muscle with 174 µV vs 309 µV (P = .039).
This study reveals that age-related changes occur in each component of the biomechanical unit formed by facial muscles, connective tissue envelope, and skin in the upper face. Knowledge and understanding of such changes can allow for more targeted and individualized surgical and nonsurgical aesthetic treatments.
See the Commentary on this article .
Facial aging is an irreversible and constantly ongoing process affecting all tissues of the face, including skin, bone, fat, connective tissue, and the muscles of facial expression.1-7 Although facial aesthetic procedures are unable to influence the aging process per se, they can modify the presentation of age-related features such as severity of wrinkles, loss of facial volume, soft tissue descent, and skin laxity. Increased understanding of the underlying pathophysiologic mechanisms allows practitioners to treat causal mechanisms rather than symptoms and individualized rather than generalized features.
Although the understanding behind facial aging is still limited, recent research focusing on facial muscles has expanded the horizon. Recently, a study reported on the effect of neuromodulator treatments targeting the frontalis muscle and identified that the connective tissue envelope of the frontalis muscle needs to be incorporated into the equation when trying to understand muscle activity and skin wrinkle formation.7 The authors found that a gradual reduction in muscle activity (when measured by electromyography) resulted in a gradual transmission of movement to the overlying skin: muscle activity reduction by 44.3% is sufficient to achieve a wrinkle severity grade of 0 whereas a reduction by 80.7% is sufficient to eliminate frontal skin movements (when measured by skin vector displacement analyses).8
This force transmission (from frontalis muscle to forehead skin) is possible due to the presence of a connective tissue envelope that covers the frontalis muscle on its superficial and deep aspect and allows for a tight mechanical connection to the dermal undersurface. This envelope is formed on its external surface by the suprafrontalis fascia and on its internal surface by the subfrontalis fascia and is in line with the already established concept of the superficial fascial system, which identified the muscle, its connective tissue envelope, and the connected skin as a biomechanical unit.9-12
To date, research focusing on this specific biomechanical unit (muscle, connective tissue, skin) is rare. Therefore, the objective of this study is to apply a multimodal investigative approach to identify age-related changes to this unit by utilizing cutometric assessment (to investigate skin firmness and elasticity), electromyography (to investigate muscle activity), and skin vector displacement (to investigate force transmission between muscle and dermal undersurface). It is hoped that results from such a multimodal study will increase our understanding of the interplay between muscles, connective tissue, and skin for ultimately improved clinical outcomes and increased patient safety.
METHODS
Study Sample
Study participants were recruited at the outpatient clinic of the Department of Hand, Plastic and Aesthetic Surgery, Ludwig-Maximilians-Universität, Munich, Germany, and consisted of healthy Caucasian volunteers absent of previous facial surgery, had no soft tissue filler injections and no neuromodulator injections within the past 6 months prior to the initiation of the study, and had no energy-based device treatment performed of their forehead, glabella, or lateral orbital regions. Before their inclusion into the study, volunteers were informed about the objective and the procedures to be performed in this cross-sectional observational study. Written informed consent was obtained from all volunteers for access to their demographic, analytic, and imaging-related data. The study protocol was reviewed and approved by the Institutional Review Board of Ludwig-Maximilians-Universität, Munich, Germany (IRB protocol 20-0786). The investigation was performed according to regional laws and good clinical practice between June 2021 and January 2022.
Cutometric Assessment
Skin firmness and skin elasticity were measured with a cutometer (Cutometer dual MPA 580, Courage + Khazaka electronic GmbH, Cologne, Germany) according to a previously published protocol.13 The cutometer measuring probe had an opening diameter of 4 mm and was positioned on the skin of the forehead, glabella, and lateral orbit. A constant suction of 400 mbar for the duration of 3 seconds followed by a relaxation time of 2 seconds without suction was generated automatically by the cutometer device once the measurement cycle was initiated and repeated 3 times. For forehead measurements, the probe was positioned bilaterally 3.5 cm cranial to the upper orbital bony rim at the level of the midpupillary line. For glabella measurements, the probe was positioned in the midline at the level of the eyebrows. For periorbital measurements, the probe was positioned in the horizontal midpupillary line 1 cm lateral to the lateral orbital rim. Resistance of skin to negative pressure (firmness) and its ability to return to its original position (elasticity) were assessed. Skin firmness was evaluated by the maximal distance (in mm) in which the skin was suctioned into the probe, whereas skin elasticity was assessed by the percentage of skin that returned to its normal position.
3-Dimensional Imaging
Skin vector displacement was conducted according to a previously published protocol and relied on 3-dimensional (3D) images that were taken at rest and at maximal muscle contraction.8 The areas measured were the forehead, glabella, and lateral orbital regions. The 3D imaging relied on the Vectra H2 handheld camera, and image analysis relied on the automated algorithm of the Vectra Software Suite (Canfield Scientific Inc.; Parsippany, NJ). The software computed the difference in skin position between rest and maximal muscle contraction and the difference between these 2 skin positions were given as vectorial change in millimeters on the x-axis and y-axis of a Cartesian coordinate system. Movements along the y-axis were regarded as vertical displacement, and movements along the x-axis were regarded as horizontal skin displacement. The mean value of the 3 repeated facial expressions was calculated for further analysis.
Surface-Derived Electromyography
The sEMG was performed according to a previously published protocol to investigate the motor unit action potential of the frontalis, procerus, corrugator supercilii, and orbicularis oculi muscles.7 In brief, noninvasive wireless surface electrodes (Avanti Trigno Quattro; Delsys Inc., Natick, MA) were positioned bilaterally on validated and standardized locations of the forehead and periorbital regions.14 The skin was degreased with a colorless antiseptic solution based on propranolol (Cutasept; Paul Hartmann AG, Heidenheim, Germany), and the adhesive surface electrodes were positioned. Volunteers were then asked to perform various facial expressions in which the targeted muscles were under maximal contraction: eyebrow elevation for the frontalis muscle; frowning for the procerus and corrugator supercilii muscles, and forceful closure of the eye for the orbicularis oculi muscle. Each movement was trained in front of a mirror before electrode placement to assure maximal contraction and activation of the targeted muscles. Measurements of the respective muscle activity, that is, the signal (maximal amplitude during the muscle contraction), were conducted 3 times and the average value was used for further analysis.
Statistical Analysis
Age and BMI were dichotomized into values, with one group below or equal to the mean value and one group above the mean value; mean age was 42.2 years and mean BMI was 24.58 kg/m2. Differences between groups were calculated with independent t test due to normal distribution of the data. All calculations were performed with SPSS Statistics 25 (IBM; Armonk, NY), and results were considered statistically significant at a probability level of ≤.05 to guide conclusions. Values are presented as mean with the respective 1x standard deviation (SD): mean (SD).
RESULTS
Demographic Data
In this cross-sectional observational study, a total of 76 Caucasian volunteers (30 males, 46 females) with a mean age of 42.2 years (SD 18.6; range: 19-80) and a mean body mass index of 24.58 kg/m2 (SD 3.7) were investigated. Thirty-seven (48.7%) volunteers were younger, whereas 39 (51.3%) volunteers were older than the mean value of the entire sample; similarly, 45 (59.2%) volunteers had a BMI smaller, whereas 31 (40.8%) had a BMI higher than the mean value of the entire sample. No statistically significant differences between genders were observed for all calculations performed.
Skin Firmness and Elasticity
Independent of age or BMI, skin firmness was greatest in the central glabella, followed by the forehead and by the lateral orbital region. Overall (independent of region investigated) the distance of skin that was displaced into the probe under negative pressure was in young volunteers 0.30 mm (SD 0.1), whereas in older volunteers it was 0.20 mm (SD 0.1), P < .001, indicating greater firmness at the higher age. There was no statistically significant influence of BMI on skin firmness when comparing the 2 BMI groups (Table 1, Figure 1).
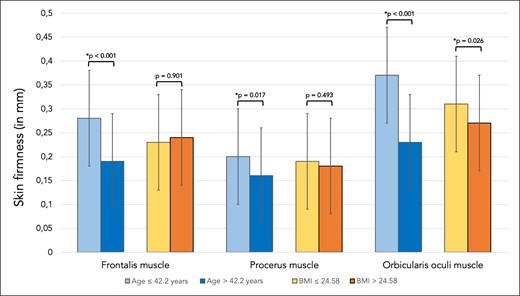
Bar graph showing skin firmness in millimeters for skin regions covering the frontalis, procerus, and orbicularis oculi muscles. Comparisons were made between the younger (≤42.2 years) and older (>42.2 years) study participants as well as between the patients with lower BMI (≤24.58 kg/m2) and higher BMI (>24.58 kg/m2).
Mean Scores and Respective Standard Deviations of Investigated Study Parameters.
| Study parameters | Measurement location | Age ≤42.2 years | Age >42.2 years | P value |
|---|---|---|---|---|
| Cutometric assessment Skin firmness ( mm) | Frontalis muscle Procerus muscle Orbicularis oculi muscle | 0.28 (0.1) 0.20 (0.1) 0.37 (0.1) | 0.19 (0.1) 0.16 (0.1) 0.23 (0.1) | * < .001 * = .017 * < .001 |
| Cutometric assessment Skin elasticity (%) | Frontalis muscle Procerus muscle Orbicularis oculi muscle | 73.1 (19) 58.4 (13) 70.3 (10) | 59.8 (17) 49.7 (12) 48.4 (12) | * < .001 * = .003 * < .001 |
| 3-dimensional vector analysis Y vector (mm) | Forehead: Vertical displacement | 1.35 (1.9) | 3.56 (2.2) | * < .001 |
| 3-dimensional vector analysis X vector (mm) | Forehead: Horizontal displacement | 2.60 (1.0) | 2.90 (1.2) | = .094 |
| sEMG signal (µV) | Frontalis muscle Procerus muscle Corrugator supercilii muscle Orbicularis oculi muscle | 309.1 (505) 95.5 (73) 91.3 (45) 136.7 (74) | 173.6 (268) 74.1 (41) 88.9 (59) 55.3 (36) | * = .039 = .121 = .782 * < .001 |
Results are stratified for younger study participants (ie, age ≤42.2 years) versus older study participants (ie, age >42.2 years). Asterisks indicate statistical significance. sEMG, surface-derived electromyography.
Independent of age or BMI, skin elasticity was lowest in the central glabella, followed by the forehead and by the lateral orbital region. Independent of the facial region investigated, the percentage of skin that returned to its original position after negative pressure was applied was in young volunteers 69.0% (SD 15.9), whereas it was in older volunteers 53.2% (SD 15.4), P < .001, indicating reduced skin elasticity at the higher age. There was no statistically significant influence of BMI on skin elasticity (Table 2, Figure 2).
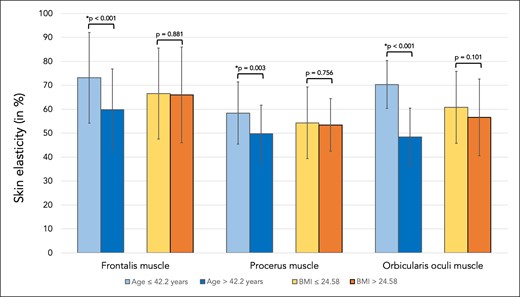
Bar graph showing skin elasticity in percent for skin regions covering the frontalis, procerus, and orbicularis oculi muscles. Comparisons were made between the younger (≤42.2 years) and older (>42.2 years) study participants as well as between the patients with lower BMI (≤24.58 kg/m2) and higher BMI (>24.58 kg/m2).
Mean Scores and Respective Standard Deviations of Investigated Study Parameters.
| Study parameters | Measurement location | BMI ≤24.58 kg/m2 | BMI >24.58 kg/m2 | P value |
|---|---|---|---|---|
| Cutometric assessment Skin firmness (mm) | Frontalis muscle Procerus muscle Orbicularis oculi muscle | 0.23 (0.1) 0.19 (0.1) 0.31 (0.1) | 0.24 (0.1) 0.18 (0.1) 0.27 (0.1) | = .901 = .493 * = .026 |
| Cutometric assessment Skin elasticity (%) | Frontalis muscle Procerus muscle Orbicularis oculi muscle | 66.5 (19) 54.3 (15) 60.8 (15) | 66.0 (20) 53.4 (11) 56.6 (16) | = .881 = .756 = .101 |
| 3D vector analysis Y vector (mm) | Forehead: Vertical displacement | 2.08 (2.2) | 3.08 (2.5) | * = .009 |
| 3D vector analysis X vector (mm) | Forehead: Horizontal displacement | 2.68 (1.0) | 2.87 (1.3) | = .315 |
| sEMG signal (µV) | Frontalis muscle Procerus muscle Corrugator supercilii muscle Orbicularis oculi muscle | 247.0 (428) 77.7 (50) 90.5 (49) 89.7 (57) | 228.7 (375) 94.5 (72) 89.5 (58) 102.4 (87) | = .785 = .232 = .915 = .277 |
Results are stratified for study participants with lower BMI (ie, BMI ≤ 24.58 kg/m2) versus higher BMI (ie, BMI > 24.58 kg/m2). Asterisks indicate statistical significance. 3D, 3-dimensional; BMI, body mass index; sEMG, surface-derived electromyography.
Skin Displacement During Facial Expressions
Vertical skin displacement of the forehead (when measured in the lower forehead during maximal eyebrow elevation) was in young volunteers 1.35 mm (SD 1.9), whereas it was in older volunteers 3.56 mm (SD 2.2), P < .001. Volunteers with higher BMI had a statistically significant increased mobility when compared with lower BMI volunteers, with 3.08 mm (SD 2.5) vs 2.08 mm (SD 2.2), P = .009 (Figure 3).
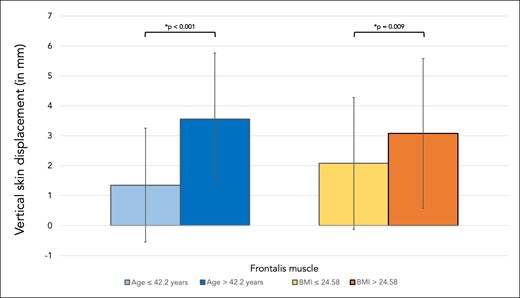
Bar graph showing vertical skin displacement in millimeters for the skin region covering frontalis muscle. Comparisons were made between younger (≤42.2 years) and older (>42.2 years) volunteers as well as between volunteers with lower BMI (≤24.58 kg/m2) versus higher BMI (>24.58 kg/m2).
Horizontal skin displacement of the middle portion of the eyebrow (measured during maximal frowning resulting from contraction of corrugator supercilii and orbicularis oculi muscles) in young volunteers was 2.60 mm (SD 1.0), whereas in older volunteers it was 2.90 mm (SD 1.2), P = .094. In volunteers with higher BMI the horizontal displacement was 2.87 mm (SD 1.3), whereas the displacement in volunteers with lower BMI was 2.68 mm (SD 1.0), P = .315 (Figure 4, Table 2).
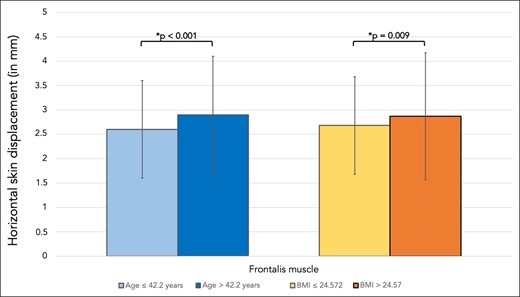
Bar graph showing the horizontal skin displacement in millimeters the skin region covering frontalis muscle. Comparisons were made between younger (≤42.2 years) and older (>42.2 years) volunteers as well as between volunteers with lower BMI (≤24.58 kg/m2) and higher BMI (>24.58 kg/m2).
Surface-Derived Electromyography
The signal of the frontalis muscle in young volunteers measured 309.1 µV (SD 505), whereas in older volunteers it was 173.6 µV (SD 268), P = .039. When measuring the signal of the procerus muscle in young vs older volunteers it was 95.5 µV (SD 73) vs 74.1 µV (SD 41), P = .121. The values for the signal derived from the corrugator supercilii in young vs older volunteers were 91.3 µV (SD 45) vs 88.9 µV (SD 59), P = .782 whereas the signal of the orbicularis oculi muscle was 136.7 µV (SD 74) vs 55.3 µV (SD 36), respectively, P < .001. There was no statistically significant influence of BMI on the sEMG signal (Figure 5, Table 2).
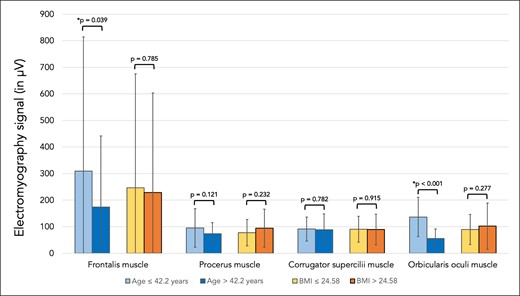
Bar graph showing the electromyography signal (in µV) for the frontalis, procerus, corrugator supercilii, and orbicularis oculi muscles. Comparisons were made between younger (≤42.2 years) and older (>42.2 years) volunteers as well as between volunteers with lower BMI (≤24.58 kg/m2)and higher BMI (>24.58 kg/m2).
DISCUSSION
This large-sample study sought to investigate the influence of aging on the upper facial soft tissues by applying a multimodal investigative approach. The results obtained are novel and confirmatory at the same time. Utilizing cutometric assessment to investigate skin firmness and skin elasticity, the results confirmed previous studies and clinical observations: at higher age skin firmness is increased and its elasticity reduced.13 This is most likely due to the loss of elastic types of collagens within the dermal matrix and alterations to the overall protein composition of skin at higher age.15-18 These structural alterations can also explain the transition of skin wrinkles from dynamic to static lines, which are a hallmark of an aged frontal and periorbital skin appearance.
Skin vector displacement analyses revealed that at higher age, the vertical skin displacement was statistically significantly increased when compared with younger individuals, at 3.6 mm vs 1.4 mm. This finding (although not intuitive) is plausible in conjunction with previous studies on facial bone aging. Cotofana and colleagues identified previously that the volume of the calvaria (which includes the frontal bone) is reduced at higher age, and similarly Frank and colleagues identified complex age-related changes in the frontal bone, which together indicate that the bony foundation of the forehead diminishes.19,20 This loss of bony support results in a descent of the frontal soft tissues and a relative increase in soft tissue laxity that can be observed clinically as idiopathic age-related eyebrow ptosis. The frontalis muscle, however, is attached to the skin of the hairy eyebrow region, and its contraction elevates the eyebrows in the lower aspect of the forehead.21,22 At higher age, the contracting frontalis muscle elevates the frontal soft tissues, but given the increased soft tissue mobility resulting from the loss of bony support, the amplitude of movement is increased, resulting in the higher elevation amplitude observed in older study participants. The fact that the applied 3D skin vector computational algorithm utilizes identical skin landmarks in the before and after images to compute differences between the relaxed and contracted frontalis muscle excludes the possibility that eyebrow ptosis or interindividual differences are confounding factors; the measurements computed between the relaxed and contracted frontalis muscle are done in the same person. Interestingly, no such age-related differences were observed between young and older study participants when comparing horizontal skin displacement. Here, the medially directed movement of the supraorbital skin (when measured during frowning) in young vs older was 2.60 mm vs 2.90 mm, P = .094, indicating that the effect of bone remodeling predominantly affects the mobility of the frontal soft tissue in a cranio-caudal direction rather than a medial-lateral direction.
Surface derived electromyographic (sEMG) analyses revealed that older study participants displayed a statistically significant reduced signal of their frontalis muscle in young vs older at 309.1 µV vs 173.6 µV, P = .039. This result is in line with observations made previously by Cotofana and colleagues, who similarly measured a reduction of frontalis muscle signal of 109 µV in young individuals vs 87 µV in older age individuals, with the same sEMG machine employed in this study.7 This reduction in frontalis muscle signal points to age-related changes of the muscle's activity, with older individuals having a lower sEMG-derived motor unit action potential. Given the greater values for forehead skin displacement during maximal eyebrow elevation in individuals of older age, it is unlikely that the reduction of the sEMG signal represents the muscle's reduced ability to effect movements. It seems more likely that the reduction in sEMG signal is rather a reflection of a reduced muscle mass at higher age. A reduced muscle mass (because of muscle fiber volume loss or a reduction in recruitment of muscle fibers) can generate smaller currents that result in a smaller signal being detected by sEMG electrodes. Age-related muscle volume loss to date has only been known to occur in skeletal muscles, called sarcopenia.23 Sarcopenia has been neither described nor postulated in facial muscles previously. Despite the limitation of a cross-sectional study design, the calculated average reduction in frontalis muscle sEMG-derived signal between young and older study participants is 43.8%. It is possible that a certain reduction of facial muscle mass occurs during the process of facial aging, but that this reduction is not sufficient to limit the ability to move the overlying skin. From an evolutionary perspective it would make sense that even at higher age an individual can still express emotions with facial expressions and not suffer from a hypomimetic or amimetic facial status following a degree of facial muscle function loss.
The results of this study confirm clinical observations that skin firmness increases and skin elasticity decreases with age. Additionally, the results of this study are in line with previous findings and reveal potentially new insights into facial muscle aging: a reduction of sEMG signal that is not reflected in muscle function but only in the current it produces during contractions.7 This is supported by skin vector displacement analyses which have revealed that at higher age there is increased mobility of the frontal soft tissues. This is likewise in line with clinical observations that not only the upper face but the entire face experiences an increased degree of soft tissue descent due to the effects of gravity and soft tissue laxity.24-28 Overall, it may be speculated that at higher age facial muscle mass is reduced but that this reduction is not sufficient to cause impaired facial expressions. A crucial component for maintaining facial expressivity could be the 3D connective tissue envelope that surrounds facial muscles and allows for their structural support, and also for their connection to the skin. Without a surrounding 3D connective tissue scaffold, facial muscles would not be able to transmit their contraction to the dermal underside. This is different from skeletal muscles, which have their effect when the point of insertion approaches the point of origin. Facial muscles, on the contrary, interact with their surroundings at any given length of the muscle fiber and transmit the smallest muscle contractions to the neighboring soft tissue areas; this is also possible because facial muscles lack covering fascia and a fascial gliding plane, a difference from skeletal muscles. This increases the importance of the connective tissue envelope that surrounds the facial muscles and allows for novel treatment modalities.
The results of this study reveal the importance of a multifactorial perspective when trying to decipher facial aging. Skin, the subdermal connective tissue scaffold, and facial muscles need to be viewed as a biomechanical unit to better understand clinical outcomes and plan treatment algorithms.
Energy-based devices apply energy in various forms (heat, ultrasound, radiofrequency, electricity, electromagnetic impulses, etc.) that target the facial soft tissues at different depths.29-32 Targeting facial muscles and their connective tissue envelope can result in tightening of the connective tissue envelope surrounding the muscle and at the same time result in muscle relaxation. This is comparable to a shrinking sleeping bag that allows the content of the sleeping bag (a muscle) to relax because no contractile force is required to keep the ends of the sleeping bag together. Clinically this can translate into reduced wrinkle status (less tensed muscle) and a smoother skin surface with increased skin tightening (a tighter connective tissue envelope). Proper knowledge of the interaction between skin, subdermal connective tissue, and facial muscles, as described in this study, increases this understanding.
Administering biostimulator substances with minimally invasive injection therapy (calcium hydroxylapatite, polycaprolactone, poly-L-lactic acid, etc.) allows for tightening of the subdermal connective tissue through fibroblast stimulation, which ultimately has an effect on the skin surface. To induce skin tightening effects, these substances need to be administered subdermally to allow for product-tissue interaction in the subdermal plane.33-35 A deeper application would not affect this biomechanical unit and explains limited clinical outcomes. However, a subdermal application needs to be performed with caution in the frontal region because there are a plethora of vessels present with close connections to the ophthalmic artery circulation.36-38
The results of this study have also revealed that the signal generated by the frontalis and periorbital muscles is reduced at higher age. This outcome is potentially explained by a reduced muscle mass at higher age, which can influence neuromodulator administration. Clinically, this would explain why mature individuals require less toxin product than younger individuals to achieve a similar outcome (based on the experience of the authors).39 Treatment algorithms should therefore be adjusted to the age of the neuromodulator therapy patient, with lower doses for mature patients and normal (or comparatively higher) doses for younger patients. The results of this study lay a foundation for an age-related understanding of the upper facial musculature and provide guidance for neuromodulator therapy planning.
Our research has confirmed the close interaction between the skin surface and facial muscles and has expanded our understanding by introducing the relevance of the 3D connective tissue scaffold that connects skin and upper facial muscles.40 This connection is crucial, because it allows facial muscles to transmit their contractions to the dermal underside and move the overlying skin. It also implies that this force-transmitting 3D connective tissue scaffold can alter the effect of the muscle toward the skin if it is influenced. The administration of hyaluronic acid–based soft tissue fillers has been described to influence muscle action, previously termed “myomodulation.”41 A superficially injected material can influence the force transmission between muscle and skin by limiting or enhancing the transmitting capacity of the surrounding collagen scaffold; a deep administration of product can increase the overall distance between muscle origin (bone or fascia) and its insertion (skin), and can therefore alter skin movements. The outcomes of our study open future pathways to a more thorough understanding of upper facial anatomy and its clinical implications.
This study is not free of limitations: this study investigated Caucasian volunteers only because of the study population available at the investigating center (Munich, Germany). A multiethnic study sample would increase the generalizability of the results presented herein. Additionally, a greater sample size would allow for further investigation of the influences of age and BMI on the measured outcome parameters.
CONCLUSION
In this study, we investigated the effects of facial aging on the soft tissues of the upper face by utilizing cutometric assessment (to investigate skin firmness and elasticity), electromyography (to investigate muscle activity), and skin vector displacement (to investigate force transmission between muscle and dermal undersurface). The results revealed that in study participants of older age skin firmness increased, skin elasticity decreased, vertical (not horizontal) skin mobility increased, and muscle sEMG-derived signal decreased. These results are in line with previous observations but identify the importance of the biomechanical unit formed between muscle, 3-dimensional connective tissue envelope, and skin. Future therapeutic options need to factor this unit into novel treatment approaches when focusing on aesthetic treatment modalities.
Disclosures
The authors declared no potential conflicts of interest with respect to the research, authorship, and publication of this article.
Funding
The authors received no financial support for the research, authorship, and publication of this article.
REFERENCES

Author notes
Dr Alfertshofer is a physician, Division of Hand, Plastic and Aesthetic Surgery, University Hospital, LMU Munich, Germany.
Dr Moellhoff is a physician, Division of Hand, Plastic and Aesthetic Surgery, University Hospital, LMU Munich, Germany.
Ms Engerer is a medical student, Division of Hand, Plastic and Aesthetic Surgery, University Hospital, LMU Munich, Germany.
Dr Frank is a physician in private practice in Marbella, Spain.
Dr Freytag is a physician, Department of Plastic Surgery, Gemeinschaftsklinikum Havelhoehe, Berlin, Germany.
Dr Cotofana is an associate professor of anatomy, Department of Clinical Anatomy, Mayo Clinic College of Medicine and Science, Rochester, MN, USA.

