


Abstract
Timing of surgical intervention is controversial among patients seeking correction of congenital breast deformities.
This study aimed to assess the influence of age on 30-day complications and unplanned healthcare utilization after reconstruction of congenital breast deformities.
Female patients undergoing breast reconstruction for congenital breast deformities and Poland syndrome were identified on the basis of International Classification of Diseases (ICD) codes in the 2012 to 2021 pediatric and adult National Surgical Quality Improvement Project (NSQIP) data sets. Complications based on age at correction were compared, and multivariate logistic regression was used to identify predictors of overall and wound healing complications.
Among 528 patients meeting inclusion criteria, mean (SD) age at surgical correction was 30.2 (13.3) years. Patients most commonly underwent implant placement (50.5%), mastopexy (26.3%), or tissue expander placement (11.6%). Across the cohort, overall incidence of postoperative complications was 4.4%, most commonly superficial surgical site infection (1.0%), reoperation (1.1%), or readmission (1.0%). After multivariate adjustment, increasing age at time of correction was associated with higher incidence of wound complications [odds ratio (OR) 1.001; 95% confidence interval (CI) 1.0003-1.002; P = .009], in addition to BMI (OR 1.002; 95% CI 1.0007-1.004; P = .006) and tobacco use (OR 1.06; 95% CI 1.02-1.11; P = .003).
Breast reconstruction for congenital breast deformities may be safely undertaken at a young age with a low associated risk of postoperative complications. Large, multi-institutional studies are needed to assess the influence of surgical timing on psychosocial outcomes in this population.
Résumé
Le moment de l’intervention chirurgicale est controversé chez les patientes qui souhaitent corriger des malformations congénitales du sein.
Cette étude avait pour objectif d’évaluer l’influence de l’âge sur les complications à 30 jours et l’utilisation non planifiée de soins de santé après la reconstruction mammaire en cas de malformations congénitales.
Les patientes subissant une reconstruction mammaire en raison de malformations congénitales du sein et du syndrome de Poland ont été identifiées sur la base des codes de la Classification internationale des maladies (CIM) dans les ensembles de données du Programme d’amélioration de la qualité dans les services de chirurgie (National Surgical Quality Improvement Project, NSQIP) de 2012 à 2021 pour les enfants et les adultes. Les complications basées sur l’âge au moment de la correction ont été comparées, et une régression logistique multivariée a été utilisée pour identifier les prédicteurs des complications globales et des complications liées à la cicatrisation.
Parmi les 528 patientes répondant aux critères d’inclusion, l’âge moyen (écart-type) au moment de la correction chirurgicale était de 30,2 (13,3) ans. Le plus souvent, les patientes ont subi la pose d’un implant (50,5%), une mastopexie (26,3%) ou la pose d’un expanseur tissulaire (11,6%). Dans l'ensemble de cette population, l’incidence globale des complications postopératoires était de 4,4%, le plus souvent une infection superficielle au niveau du site opératoire (1,0%), une réintervention (1,1%) ou une réadmission (1,0%). Après ajustement à plusieurs variables, l’augmentation de l’âge au moment de la correction a été associée à une incidence plus élevée de complications au niveau de la plaie [rapport de cotes (RC) 1,001; intervalle de confiance (CI) à 95% 1,0003-1,002; P = 0,009], en plus de l’IMC (RC 1,002; CI à 95% 1,0007-1,004; P = 0,006) et du tabagisme (RC 1,06; CI à 95% 1,02-1,11; P = 0,003).
La reconstruction mammaire pour les malformations congénitales du sein peut être réalisée en toute sécurité à un jeune âge, avec un risque de complications postopératoires faible. Il est nécessaire de réaliser de grandes études multi-institutionnelles pour évaluer l’influence du moment de l’opération sur les résultats psychosociaux dans cette population.

See the Commentary on this article .
Congenital breast deformities, including tuberous breast, amastia, amazia, and Poland syndrome, are relatively infrequent congenital anomalies that may place emotional burdens on patients throughout puberty and adolescence.1–4 Adolescents with congenital breast deformities have been shown to have higher levels of social anxiety, depression, and peer rejection compared with normative values, psychosocial problems which have been shown to improve after surgical correction.2,3,5 However, despite significant existing literature describing single-surgeon and institutional techniques for correction,1,6–10 there remains a paucity of national data on trends and surgical outcomes of congenital breast deformity reconstruction. Specifically, there has yet to be a large national study describing demographic trends or surgical complications after correction of congenital breast deformities.
Timing of intervention is a key consideration in this patient population. Historically, correction of congenital breast disorders in adolescents was delayed until completion of puberty and attainment of Tanner Stage V breast development to ensure full development and minimize secondary revisions, with some advocating for correction until after 18 years to allow for decision-making capacity.5,11,12 Conversely, others advocate for early correction prior to progression throughout school years to alleviate the associated emotional burden.3,13,14 Studies have demonstrated that early surgical correction prior to age 20 is associated with significant improvements in patient-reported body image compared with those undergoing later correction.3 Despite this data, the influence of surgical timing on postoperative complications remains unknown.
In this study, we aimed to assess the influence of surgical timing on postoperative complications after correction of congenital breast anomalies, including Poland syndrome, tuberous breast deformity, and amastia. Specifically, we utilized the 2012 to 2021 pediatric and adult American College of Surgeons (ACS) National Surgical Quality Improvement Project (NSQIP) to study the influence of age on postoperative complications and unplanned healthcare utilization among patients undergoing breast reconstruction for congenital breast deformities. We hypothesized that correction of congenital breast deformities would be associated with a low risk of perioperative complications across ages, a finding with implications for optimal timing of surgical correction within this population.
METHODS
After institutional review board approval at Duke University, the American College of Surgeons (ACS) pediatric and adult National Surgical Quality Improvement Project (NSQIP) databases were queried for all female patients undergoing correction of congenital breast anomalies from 2012 to 2021. Cases were identified on the basis of International Classification of Diseases (ICD)-9 and 10 codes, including Q83.8, Q83.9, and 757.6 to designate “other congenital breast deformities,” which corresponds to tuberous breast, amazia, and amastia, and Q79.8, Q79.9, 756.89, and 756.81 to designate Poland syndrome. Female patients aged >10 years were included who were undergoing breast procedures listed under the surgical specialty of plastic surgery. To eliminate breast cancer patients aberrantly recorded under the ICD codes of interest, patients undergoing concurrent procedures, including mastectomy, with other services were excluded. Notably, the NSQIP data set only captures patients from participating academic institutions and therefore does not include patients undergoing surgery out of pocket or at non-NSQIP participating centers. In addition, the NSQIP data set does not contain developmental or pubertal milestones or data about long-term secondary revisions, and can only identify congenital breast patients on the basis of ICD codes and therefore cannot stratify between tuberous breast, amastia, or amazia under ICD-9 and 10 codes Q83.8, Q83.9, and 757.6. Juvenile mammary hypertrophy is classified under a separate ICD code and was therefore not included in this analysis.
Patient demographics and comorbidities collected included age at time of surgical correction, body mass index (BMI) (kg/m2), diabetes, tobacco use, and American Society of Anesthesiologists (ASA) classification (1-4). Procedural characteristics included operative time, procedural classification (inpatient vs outpatient), 30-day complications, and utilized Current Procedural Terminology (CPT) codes. Wound healing complications were defined to include any superficial incisional surgical site infection (SSI), deep incisional SSI, organ/space SSI, or wound disruption. Other collected complications included reintubation, pneumonia, pulmonary embolism, urinary tract infection, bleeding complication, deep vein thrombosis (DVT), and sepsis. Finally, length of stay and rates of reoperation and readmission were collected.
Study Outcome
The primary outcome of interest was the influence of age on the incidence of postoperative complications. Secondary outcomes included independent predictors of wound and overall complications across the cohort.
Statistical Analysis
Demographic and surgical characteristics were summarized with numbers and percentages for categorical variables and mean (standard deviation) for continuous variables. Differences between the cohorts based on age were tested using Fisher exact or t tests, as appropriate. A multivariate logistic regression model was used to identify predictors of wound and overall complications, using age at surgical correction as a covariate. Finally, trends in NSQIP reporting of both Poland and congenital breast deformities was modeled by year of entry. For all tests, P values < .05 were considered statistically significant. The analysis was conducted in R (R Core Team 2021, Vienna, Austria).
RESULTS
A total of 528 female patients aged >10 years undergoing correction of congenital breast deformities or Poland Syndrome in the 2012 to 2021 adult and pediatric NSQIP data sets met the study inclusion criteria, including 457 with ICD codes designating “other congenital breast deformities” and 71 with ICD codes corresponding to Poland syndrome. Demographics and comorbidities across the cohort are displayed in Table 1. Overall, mean (SD) age at correction was 30.2 (13.3) years (median age 27 years, range 14-77), with the highest proportion of patients undergoing correction at age 15-20 or 20-25, Figure 1. Most patients were White (80.0%) or Black/African American (13.0%), with 12.8% Hispanic/Latino. Mean (SD) BMI was 26.8 (6.6) kg/m2, tobacco use was documented in 8.6%, and diabetes was present in 1.6%. Most were ASA Class I (39.3%) or II (55.6%) and underwent outpatient procedures (90.7%), with mean (SD) operative time 108.9 (71.1) minutes. Patients with Poland syndrome were younger at the time of surgery [other congenital deformities: mean (SD) 31.6 (12.7) years vs Poland syndrome: 27.7 (11.8) years; P = .001], more likely to be Hispanic/Latino (other congenital deformities: 11.0% vs Poland syndrome: 24.1%; P = .01), undergo an inpatient procedure (other congenital deformities: 7.9% vs Poland Syndrome: 18.3%; P = .01), and have longer mean operative time (other congenital deformities: 103.7 minutes vs Poland syndrome: 142.1 minutes; P = .004) compared with patients with other congenital breast deformities; Table 1.
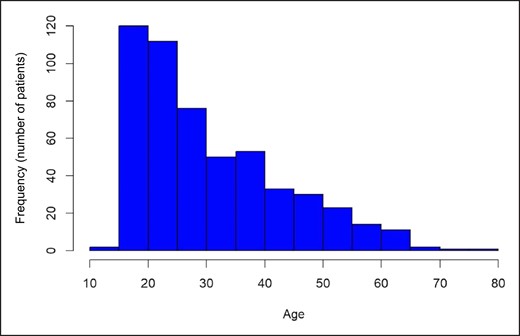
Age distribution of patients, N = 528.
Demographic and Surgical Characteristics of the Cohort
| Variable | Overall (N = 528) | Other congenital deformities (N = 457) | Poland Syndrome (N = 71) | P Value |
|---|---|---|---|---|
| Age at correction, mean (SD) | 30.2 (13.3) | 31.6 (12.7) | 27.7 (11.8) | .01 |
| Race, n (%) | .26 | |||
| White | 321 (80.0%) | 281 (79.4%) | 40 (85.1%) | |
| Black/African American | 52 (13.0%) | 49 (13.8%) | 3 (6.4%) | |
| Asian | 23 (5.7%) | 20 (5.6%) | 3 (6.4%) | |
| American Indian or Pacific Islander | 5 (1.25%) | 4 (1.1%) | 1 (2.1%) | |
| Ethnicity, n (%) | .01 | |||
| Hispanic/Latino | 53 (12.8%) | 39 (11.0%) | 14 (24.1%) | |
| Not Hispanic/Latino | 360 (87.2%) | 316 (89.0%) | 44 (75.9%) | |
| Procedure class, n (%) | .01 | |||
| Inpatient | 49 (9.3%) | 36 (7.9%) | 13 (18.3%) | |
| Outpatient | 479 (90.7%) | 421 (92.1%) | 58 (81.7%) | |
| Operative time, minutes, mean (SD) | 108.9 (71.1) | 103.7 (62.5) | 142.1 (106.4) | .004 |
| BMI, kg/m2, mean (SD) | 26.8 (6.6) | 26.7 (6.6) | 27.0 (6.7) | .77 |
| Tobacco use, n (%) | 43 (8.6%) | 39 (8.8%) | 4 (6.5%) | .64 |
| Diabetes, n (%) | 8 (1.6%) | 8 (1.8%) | 0 (0.0%) | .60 |
| ASA Class, n (%) | .008 | |||
| I | 207 (39.3%) | 189 (41.5%) | 18 (25.4%) | |
| II | 293 (55.6%) | 244 (53.5%) | 49 (69.0%) | |
| III | 26 (4.9%) | 23 (5.0%) | 3 (4.2%) | |
| IV | 1 (0.2%) | 0 (0.0%) | 1 (1.4%) |
ASA, American Society of Anesthesiologists; BMI, body mass index; SD, standard deviation.
Common CPT codes for breast reconstruction are shown in Table 2. Patients with other congenital deformities most commonly underwent breast augmentation with implant (19325; 34.4%) or mastopexy (19316; 26.3%). Patients with Poland syndrome most often underwent mastopexy (19316; 26.8%), immediate implant reconstruction (19340; 22.5%), or tissue expander placement (19357; 21.1%). In general, breast reconstruction with implant-based reconstruction codes were more often used in Poland syndrome (either immediate or delayed implant reconstruction—33.8%), whereas breast augmentation codes were more often used for other congenital deformities (breast augmentation with implant—34.4%). A low proportion of the population underwent autologous reconstruction with either pedicled latissimus flaps (0.6%) or free flaps (0.6%).
Common Surgical Procedures by CPT Codes Across the Cohort (Including CPT, OTHERCPT1, OTHERCPT2, Etc)
| CPT code | Total cohort (N = 528) | Other congenital deformities (N = 457) | Poland syndrome (N = 71) |
|---|---|---|---|
| 19325 (Breast augmentation with implant) | 164 (31.1%) | 157 (34.4%) | 7 (9.8%) |
| 19316 (Mastopexy) | 139 (26.3%) | 120 (26.3%) | 19 (26.8%) |
| 19318 (Reduction) | 80 (15.2%) | 69 (15.1%) | 11 (15.5%) |
| 19340 (Immediate implant reconstruction) | 70 (13.3%) | 54 (11.8%) | 16 (22.5%) |
| 19342 (Delayed implant reconstruction) | 32 (6.1%) | 24 (5.3%) | 8 (11.3%) |
| 19357 (Tissue expander placement) | 61 (11.6%) | 46 (10.1%) | 15 (21.1%) |
| 19380 (Breast reconstruction revision) | 25 (4.7%) | 16 (3.5%) | 9 (12.7%) |
| 19361 (Pedicled latissimus flap) | 3 (0.6%) | 1 (0.2%) | 2 (2.8%) |
| 19364 (Breast reconstruction with free flap) | 3 (0.6%) | 0 (0.0%) | 3 (4.2%) |
CPT, Current Procedural Terminology.
Surgical complications across the cohort stratified by ICD code are displayed in Table 3. Across the cohort, there was a low overall incidence of any complication (N = 22; 4.4%). Overall incidence of postoperative complications was similar after correction of other congenital breast deformities and correction of Poland syndrome (all P > .05); Table 3.
Surgical Complications Across the Cohort
| Complication | Overall (N = 528) | Other congenital deformities (N = 457) | Poland syndrome (N = 71) | P Value |
|---|---|---|---|---|
| Wound complications | ||||
| Superficial infection, n (%) | 5 (1.0%) | 4 (0.9%) | 1 (1.4%) | .52 |
| Deep infection, n (%) | 1 (0.2%) | 1 (0.2%) | 0 (0.0%) | 1.00 |
| Organ/space infection, n (%) | 1 (0.2%) | 1 (0.2%) | 0 (0.0%) | 1.00 |
| Dehiscence, n (%) | 3 (0.6%) | 3 (0.7%) | 0 (0.0%) | 1.00 |
| Non-wound complications | ||||
| Reintubation, n (%) | 0 (0.0%) | 0 (0.0%) | 0 (0.0%) | NA |
| Pneumonia, n (%) | 0 (0.0%) | 0 (0.0%) | 0 (0.0%) | NA |
| Pulmonary embolus, n (%) | 0 (0.0%) | 0 (0.0%) | 0 (0.0%) | NA |
| Urinary infection, n (%) | 2 (0.4%) | 2 (0.4%) | 0 (0.0%) | 1.00 |
| Bleeding complication, n (%) | 1 (0.2%) | 0 (0.0%) | 1 (1.4%) | 1.00 |
| DVT, n (%) | 0 (0.0%) | 0 (0.0%) | 0 (0.0%) | NA |
| Sepsis, n (%) | 1 (0.2%) | 1 (0.2%) | 0 (0.0%) | 1.00 |
| Total hospital length of stay (days), mean (SD) | 0.3 (2.0) | 0.21 (1.5) | 1.0 (3.7) | .08 |
| Reoperation, n (%) | 6 (1.1%) | 5 (1.0%) | 1 (1.4%) | .58 |
| Readmission, n (%) | 5 (1.0%) | 5 (1.0%) | 1 (1.4%) | .53 |
| Any complications, n (%) | 22 (4.4%) | 18 (4.0%) | 4 (5.6%) | .52 |
DVT, deep vein thrombosis; NA, not applicable; SD, standard deviation.
Surgical complications by age (<30 vs ≥30 years) are displayed in Table 4, demonstrating a lower overall incidence of postoperative complication in both age groups. Incidence of superficial surgical site infections was higher in the ≥30-years group (<30 years: 0%, N = 0 vs ≥30 years: 2.2%, N = 5; P = .01). There was a higher incidence of overall complications in the ≥30-years group, though this difference did not reach statistical significance (<30 years: 3.3%, N = 10 vs ≥30 years, N = 12: 5.2%; P = .38). Overall surgical complications were then depicted by age group (10-19, 20-29, 30-39, 40-59, and >50 years); Figure 2. The lowest incidence of overall complications was seen in the 20–29-year group, after which time incidence of complications increased (10-19 years: 4.2%, N = 4; 20-29 years: 2.9%, N = 6; 30-39: 4.9%, N = 5; 40-49: 5.8%, N = 4; and >50 years: 5.2%, N = 3); Figure 2.
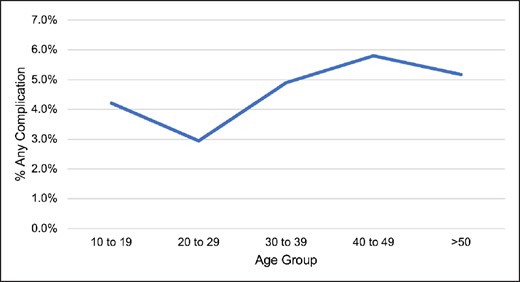
Incidence of overall complications by age group, N = 528.
Surgical Complications by Age
| Complication | <30 years (N = 299) | <30 years (N = 229) | P Value |
|---|---|---|---|
| Wound complications | |||
| Superficial infection, n (%) | 0 (0.0%) | 5 (2.2%) | .01 |
| Deep infection, n (%) | 1 (0.3%) | 0 (0.0%) | 1.00 |
| Organ/space infection, n (%) | 0 (0.0%) | 1 (0.4%) | .43 |
| Dehiscence, n (%) | 1 (0.3%) | 2 (0.9%) | .58 |
| Non-wound complications | |||
| Reintubation, n (%) | 0 (0.0%) | 0 (0.0%) | NA |
| Pneumonia, n (%) | 0 (0.0%) | 0 (0.0%) | NA |
| Pulmonary embolus, n (%) | 0 (0.0%) | 0 (0.0%) | NA |
| Urinary infection, n (%) | 1 (0.3%) | 1 (0.4%) | 1.00 |
| Bleeding complication, n (%) | 0 (0.0%) | 1 (0.4%) | .43 |
| DVT, n (%) | 0 (0.0%) | 0 (0.0%) | NA |
| Sepsis, n (%) | 1 (0.3%) | 0 (0.0%) | 1.00 |
| Total hospital length of stay (days), mean (SD) | 0.4 (2.5) | 0.3 (0.8) | .62 |
| Reoperation, n (%) | 3 (1.0%) | 3 (1.3%) | .25 |
| Readmission, n (%) | 3 (1.0%) | 2 (0.9%) | 1.00 |
| Any complication (wound or non-wound) | 10 (3.3%) | 12 (5.2%) | .38 |
DVT, deep vein thrombosis; NA, not applicable; SD, standard deviation.
Notably, the 30-day follow-up inherent to the NSQIP data set does not enable assessment of long-term secondary revisions. Among the 25 patients who underwent breast reconstruction revision (CPT 19380), 7 patients (28.0%) were ≤20 years, implying an early primary surgery; Figure 3. However, we were unable to assess whether other implant removal or exchange CPT codes were performed in a revisionary manner and therefore could not assess the influence of age on incidence of revisionary surgeries.
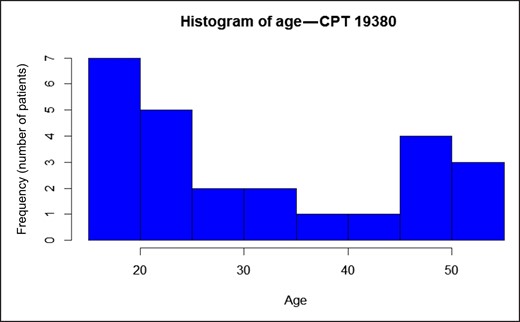
Age distribution of utilized Current Procedural Terminology (CPT) 19380 (breast reconstruction revision), N = 25.
Next, 2 multivariable logistic regression models were performed to identify predictors of non-wound and wound complications across the cohort; Table 5. When modeling the incidence of non-wound complications, variables including ICD code, race/ethnicity, BMI, tobacco use, and diabetes were not associated with the incidence of non-wound complications (all P > .05). Notably, age was not associated with risk of non-wound complications [odds ratio (OR) 1.00; 95% confidence interval (CI) 1.00-1.00; P = .55]. When assessing wound complications, variables including ICD code, race/ethnicity, and diabetes did not predict risk of wound complications (all P > .05). After multivariable adjustment, increasing age at time of correction was associated with higher incidence of wound complications (OR 1.001; 95% CI 1.0003-1.002; P = .009), in addition to BMI (OR 1.002; 95% CI 1.0007-1.004; P = .006) and tobacco use (OR 1.06; 95% CI 1.02-1.11; P = .003).
Multivariate Regression Model Predicting the Incidence of Non-wound Complications Across the Cohort
| Independent variables | Non-wound complications | Wound complications | ||||
|---|---|---|---|---|---|---|
| OR | (95% CI) | P Value | OR | (95% CI) | P Value | |
| Intercept | 0.99 | (0.93-1.07) | .94 | 0.92 | (0.87-0.97) | .003 |
| Age | 1.00 | (1.00-1.00) | .55 | 1.00 | (1.0003-1.002) | .009 |
| ICD diagnosis | ||||||
| Other congenital breast deformity | REF | REF | REF | REF | REF | REF |
| Poland syndrome | 1.04 | (0.99-1.08) | .13 | 1.007 | (0.97-1.04) | .70 |
| Race | ||||||
| White | REF | REF | REF | REF | REF | REF |
| Black | 0.98 | (0.93-1.04) | .52 | 1.01 | (0.97-1.05) | .67 |
| Asian | 0.96 | (0.89-1.04) | .33 | 0.98 | (0.93-1.04) | .48 |
| Native American or Pacific Islander | 0.97 | (0.83-1.12) | .65 | 0.98 | (0.87-1.1) | .67 |
| Ethnicity | ||||||
| Non-Hispanic | REF | REF | REF | REF | REF | REF |
| Hispanic | 0.98 | (0.93-1.03) | .47 | 0.98 | (0.95-1.02) | .34 |
| BMI | 1.00 | (1.00-1.00) | .50 | 1.002 | (1.0007-1.004) | .006 |
| Tobacco use | 1.05 | (0.99-1.11) | .10 | 1.06 | (1.02-1.11) | .003 |
| Diabetes | 0.96 | (0.84-1.08) | .48 | 0.95 | (0.87-1.05) | .31 |
| ASA Class | ||||||
| I | REF | REF | REF | REF | REF | REF |
| II | 1.00 | (0.96-1.03) | .77 | 0.99 | (0.96-1.01) | .31 |
| III | 1.00 | (0.93-1.08) | .96 | 0.99 | (0.93-1.04) | .64 |
| IV | 0.94 | (0.67-1.32) | .73 | 0.99 | (0.76-1.27) | .91 |
ASA, American Society of Anesthesiologists; BMI, body mass index; ICD, International Classification of Diseases; OR, odds ratio; REF, reference.
Finally, trends in NSQIP reporting of breast surgeries for other congenital breast deformities and Poland syndrome were modeled by database entry year in Figure 4. From 2012-2021, there was relatively low annual entry of breast reconstruction cases for congenital breast deformities, with the number of Poland syndrome cases ranging from 6-15 and other congenital breast deformities cases ranging from 29-58 entries per year.
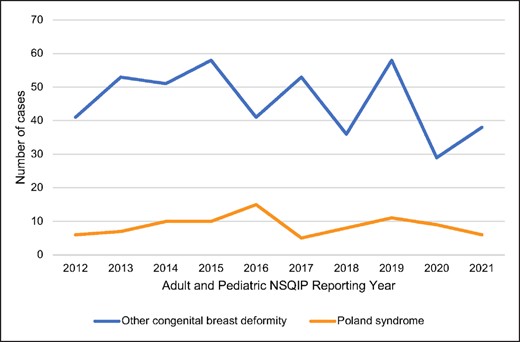
Trends in reporting of congenital breast deformities in the adult and pediatric National Surgical Quality Improvement Project (NSQIP) data sets, 2012 to 2021.
DISCUSSION
In this national analysis of 528 patients undergoing breast procedures for correction of congenital breast deformities, the influence of age on the incidence of 30-day complications and unplanned healthcare utilization is assessed. Across the cohort, we demonstrate a low overall incidence of 30-day complications and unplanned healthcare utilization associated with correction of congenital breast deformities. Notably, increasing age was an independent risk factor for increasing incidence of wound complications after multivariable adjustment, and younger patients tended to have lower incidence of complications. Put in the context of prior studies demonstrating increased psychosocial benefits associated with early correction,3,13 this study suggests that early correction of congenital breast anomalies may be safely undertaken with a low associated complication profile.
Surgical management of congenital breast anomalies has evolved significantly over the past decades, resulting in improved techniques, aesthetic results, and psychosocial outcomes.7,10,15 However, although congenital breast deformities are considered to be relatively common problems presenting to plastic surgeons, these anomalies represent a low proportion of diagnoses nationwide. For example, Poland syndrome is estimated to affect 1 in 100,000,16 and the incidences of both tuberous breast and amazia/amastia remain unknown.17 Accordingly, most studies performed to date have been limited to small case series with low levels of evidence, especially compared with the literature in breast cancer reconstruction. Although the psychologic ramifications of these anomalies have been well studied, controversy persists regarding the embryologic and genetic etiology of these congenital anomalies, whether these anomalies should be considered cosmetic or reconstructive in relation to insurance coverage, as well as the optimal timing of surgical intervention.
The psychosocial ramifications of congenital breast anomalies on adolescent females have been well documented.2–4,18–21 For example, in a survey analysis of 59 patients with breast asymmetry including tuberous breast and Poland syndrome, Nuzzi et al demonstrated that breast asymmetry was associated with significantly reduced self-esteem and social functioning compared with controls.21 In turn, surgical correction has been shown to improve psychosocial functioning to normative values. Using metrics including the Short-Form 36, Rosenberg Self-Esteem Scale, and the BREAST-Q, studies have demonstrated that correction of congenital breast deformities improves psychosocial dysfunction and satisfaction with breasts to levels comparable to peers,2,4,19,20 with improvements sustained up to 5 years after correction.4 Moreover, in qualitative interviews of breast asymmetry patients, surgical correction was found to lead to improved patient satisfaction and self-confidence.22
Despite well-defined psychosocial benefits associated with correction of congenital breast deformities, the optimal timing of surgical correction remains controversial. Historically, congenital breast reconstruction was delayed until completion of puberty and breast development to minimize risk of secondary revisions after continued growth, with some surgeons proponents of correction after 18 years of age to allow for decision-making capacity.5,11,12 In turn, later correction may be associated with a reduced incidence of reoperations and revisions. In a review of 46 patients with tuberous breast deformities by Tenna et al, correction at a younger age was associated with increased need for reoperation and revision.18 Conversely, other authors advocate for earlier correction to alleviate the emotional and psychosocial ramifications associated with congenital breast anomalies prior to progression through school years.3,13,14 In a survey study of 184 patients aged 12-22 years undergoing plastic surgery including correction of congenital breast deformities, Simis et al found that adolescents undergoing plastic surgery experienced significant improvements in appearance-related burdens after surgery, with the greatest improvements seen after corrective breast surgery compared with other procedures.14 Moreover, in a survey study of 50 patients with Poland syndrome, Baldelli et al found that although correction <20 years of age was associated with improvements in the Body Uneasiness Test to the levels of peers, correction >20 years of age was not associated with significantly reduced body discomfort.3 On the basis of this, the authors concluded that body image perception may reach a critical phase during adolescence; if surgery is performed after this critical period, body image problems may be stabilized and may be refractory to surgical correction.3 Taken together, these studies suggest that although earlier correction may be associated with increased revision rates, the significant psychological and social benefits associated with early correction among adolescents may outweigh the risks.
Although the psychosocial benefits of earlier correction are well established, how timing of surgical correction influences postoperative complication profiles remains unknown. This study represents the first large national analysis of outcomes after breast reconstruction for congenital breast deformities. Previously, complications have been studied in retrospective case series with cohort sizes ranging from 12 to 26 patients, all of which have demonstrated low overall complication profiles after correction.13,23–25 We similarly demonstrate a low overall incidence of overall complications in this study, occurring in 4.4% of the congenital breast population. Although correction at all ages was associated with low complication rates, even among patients less than 18 years old, the lowest overall complication rates were seen in patients aged 20-29. Finally, we find that increasing age is an independent risk factor for higher postoperative wound complications, in addition to factors including BMI and tobacco use. Paired with the existing studies advocating for earlier correction for psychosocial benefits, this study also suggests that earlier correction may be undertaken safely with a low associated risk of postoperative complications.
Ultimately, defining the optimal timing of surgery in adolescents with congenital breast deformities is a complex decision. Shared decision making with patients, parents, and surgeons must be made after weighing the benefits of early correction, including psychosocial improvements and low postoperative complication profile as demonstrated herein, with the downsides including the potential for reoperation with continued breast development and the ethical concerns related to plastic surgery in adolescents. Ultimately, timing may optimally be individualized depending on the degree of patient's preoperative psychologic and social distress as well as the degree of breast deformity, though further studies are needed. Given the low annual entry in NSQIP as shown in this study, we aim for this data to emphasize the need for alternative national or multi-institutional databases to capture patients with congenital breast deformities and study the influence of surgical timing on patient-reported outcomes and complications in this population.
This study has several limitations with implications for its interpretation. First and foremost, congenital breast anomalies are relatively infrequent diagnoses. Although this study is the largest series in the literature to date, the relatively small size of the cohort limits the described associations. Second, the reliance on ICD codes in NSQIP limits the study granularity with respect to comparisons between types of congenital breast deformities (Poland syndrome, tuberous breast, amastia, amazia, etc). As with all NSQIP studies, aberrant coding could have introduced discrepancies. Importantly, the 30-day follow-up period inherent to the NSQIP data set limits analysis of long-term complications relevant to this population, such as capsular contracture, malposition, and need for revision, complications which are tied to age at time of correction and are important metrics by which to assess outcomes in this population. Although the database does capture “breast reconstruction revision” under CPT 19380, this CPT code could have been used for other adjunctive procedures such as fat grafting or scar revision in 2-stage tissue expander-to-implant reconstruction and would not have captured any secondary implant removals or exchanges, and we therefore could not use this CPT as a metric to assess incidence of secondary revisions after the index reconstructive surgery. Finally, the NSQIP data set inherently captures only cases performed at participating academic centers, and therefore excludes a substantial portion of these cases which may be performed outside of academic centers. Given these limitations and the relative infrequency of these diagnoses across the population, a multi-institutional study is necessary to perform a more granular and comprehensive analysis of complications and outcomes, including revisions and patient-reported outcomes, in this population in the future. However, this study remains the largest cohort study of outcomes after surgical correction of congenital breast deformities to date. Paired with existing literature advocating for early correction due to psychosocial benefits, we aim for this study to guide preoperative counseling among adolescent patients seeking consultation for congenital breast deformities, because early correction may also be undertaken safely in appropriate candidates. Ultimately, shared decision making and individualized preference elicitation must be undertaken with both patients and families to define the optimal timing of surgical correction in this population while carefully weighing complication risk, psychosocial considerations, and risk of secondary revisions with development.
CONCLUSIONS
This national analysis of 528 patients demonstrated a low overall incidence of 30-day complications and unplanned healthcare utilization after breast reconstruction for congenital breast deformities or Poland syndrome. The lowest overall complication rate was seen among patients undergoing correction in their 20s, and increasing age was an independent risk factor for increasing incidence of wound complications after multivariate adjustment. Paired with prior studies demonstrating psychosocial benefits associated with early correction, this study suggests that earlier correction of congenital breast anomalies may be undertaken safely with a low incidence of postoperative complications. These findings underscore the need for large, multi-institutional studies on the optimal timing of surgical correction in this population.
Disclosures
The authors declared no potential conflicts of interest with respect to the research, authorship, and publication of this article.
Funding
The authors received no financial support for the research, authorship, and publication of this article.
REFERENCES
Author notes
Dr Sergesketter is plastic surgery resident, Division of Plastic, Oral and Maxillofacial Surgery, Duke University, Durham, NC, USA.
Dr Langdell is plastic surgery resident, Division of Plastic, Oral and Maxillofacial Surgery, Duke University, Durham, NC, USA.
Dr Shammas is plastic surgery resident, Division of Plastic, Oral and Maxillofacial Surgery, Duke University, Durham, NC, USA.
Dr Knackstedt is plastic surgeon, Division of Plastic, Oral and Maxillofacial Surgery, Duke University, Durham, NC, USA.
Dr Rezak is plastic surgeon, Division of Plastic, Oral and Maxillofacial Surgery, Duke University, Durham, NC, USA.
Dr Geng is a biostatistician, Calc LLC, Wilton, CT, USA.
Mr Tian is a medical student, Duke University School of Medicine, Durham, NC, USA.

