


Abstract
Some women with breast implants report systemic and cognitive symptoms known as breast implant illness (BII), which are very similar to those of fibromyalgia. Functional MRI (fMRI) has shown altered brain activity in fibromyalgia patients.
The aim of this pilot study was to investigate whether brain alterations could be observed in BII patients by fMRI.
Women aged 18 to 76 with silicone breast implants for cosmetic reasons were recruited through a Dutch online BII support organization (MKS) and through the Maastricht University Medical Center. Study participants comprised 12 women with BII and 12 women without symptoms. Participants completed questionnaires regarding demographic characteristics, medical history, psychosocial complaints (Four-Dimensional Symptom Questionnaire), cognitive failure (Mini–Mental State Examination), and pain intensity and pain-related disability (Chronic Pain Grade Scale). Subsequently, brain images of all participants were obtained by resting-state fMRI and diffusion tensor imaging in a 3-T MRI scanner (Siemens Medical System, Erlangen, Germany).
Eleven BII patients and 12 healthy controls were included in the analysis. Baseline characteristics were similar in the 2 groups and the mean silicone exposure was 15 years. Patients scored significantly higher than controls on both pain intensity and disability. Patients scored worse on depression, somatization, distress, and anxiety compared with asymptomatic women. Mini–Mental State Examination scores were normal. However, the analyses of both functional connectivity and structural integrity showed no significant differences between the 2 groups.
This pilot study showed no evidence of brain alterations in BII patients. However, patients scored significantly worse on psychosocial symptoms than controls. Psychological factors appear to play an important role in BII and should be further investigated.

See the Commentary on this article .
Some women with silicone breast implants (SBIs) report systemic complaints, also referred to as breast implant illness (BII).1-3 In addition to physical complaints, many of these patients report subjective cognitive failure, characterized by memory loss, concentration problems, and word-finding problems.4 These nonspecific symptoms of BII share many features with fibromyalgia, making the distinction difficult.5,6 However, the significant improvement following explantation reported in more than half of the patients seems to indicate the existence of 2 separate conditions.7-9
The cause-effect relationship of SBIs and systemic symptoms remains a subject of ongoing debate and the prevalence of BII is still unknown.10-13 The adjusted prevalence of symptoms was not found to be significantly higher in women with SBIs than in women without SBIs.1 Additionally, no increased risk of subjective cognitive failure in SBI patients, when compared with controls, could be demonstrated.4
There is no objective method to assess the harmfulness of SBIs and therefore no targeted therapy is available, except the permanent removal of the implants.9 In the majority of cases, this treatment is not reimbursed by health insurance, as a result of which patients do not receive the desired help and do not feel taken seriously. On the other hand, women are at risk of undergoing unjustified medical interventions, which can have both physical and psychological consequences.14,15
Objectifying complaints, such as pain, could contribute to recognition and point the way for treatment. One method that has been used to demonstrate chronic pain is neuroimaging, involving functional MRI (fMRI) of the brain’s pain matrix.16 This method may also visualize neurological correlates in women with BII.
Previous neuroimaging studies with chronic pain or fibromyalgia patients showed altered brain activity and structural changes in brain regions that are collectively referred to as the pain matrix.16-21 These brain regions, including the primary and secondary somatosensory cortex, insular cortex, anterior cingulate cortex, prefrontal cortex (PFC), and thalamus, are known to be consistently activated during pain, and appear to play an important role in pain processing. Although the neurological underpinnings of BII are still ill-defined, Shoaib and Patten reported multiple white matter lesions as well as small ischemic lesions in women with SBIs.22,23 The majority of these patients showed additional peripheral or neuromuscular pathologies, suggesting neurological involvement in BII. Given the clinical similarities to fibromyalgia, specific brain regions may also be affected in women with BII. To date, however, no fMRI results of BII patients have been reported in the literature. Therefore, we investigated whether brain alterations could be observed in BII patients from resting-state fMRI and diffusion tensor imaging (DTI) in a 3-T MRI scanner.
DTI is a commonly used noninvasive method to study white matter microstructures and white matter integrity.24 Within clinical research it has shown valuable insights in various neurological and psychological disorders.25 Water diffusion is traditionally modelled with a diffusion tensor model26 which provides various diffusion parameters, including mean diffusivity (MD) and fractional anisotropy (FA). Reductions in FA have been linked to myelin breakdown, to axonal degeneration, or to general decreases in white matter integrity.27,28 The aim of this pilot study was to examine whether alterations in these diffusion measures can be found in BII patients in comparison to women with SBIs without health complaints.
METHODS
Study Population
Subjects were recruited between October 2020 and September 2021. Forty-five women were invited who had previously participated in BII research and had agreed to be invited again for further participation. Fifty-one women signed up through the Silicone Breast Implants Organization (Meldpunt Klachten Siliconen, MKS), an online support organization for women with breast implants, which shared a call for participants. In addition, 6 women reported via the plastic surgery outpatient clinic of Maastricht University Medical Center.
Inclusion criteria for the patient group were: women, age 18 to 76 years, cosmetic breast augmentation, SBIs in situ, and suggested BII, including subjective cognitive impairment. The same inclusion criteria applied to the control group, except that they explicitly experienced no suggested BII and no cognitive impairment. Exclusion criteria for both groups were: diagnosis of chronic pain syndrome, fibromyalgia, chronic fatigue syndrome, cancer, or diabetes mellitus; history of cerebral vascular accident; use of antidepressants, anticonvulsants, opioids, or benzodiazepines; and (3-T) MRI contraindications, such as metallic implants, permanent make-up, and claustrophobia.
The study protocol was approved by the Maastricht University Medical Center IRB (METC19-089). All participants agreed to participate in this study and provided written informed consent.
Baseline Characteristics and Questionnaire Data
Participants completed a set of questionnaires before undergoing the scan. A general questionnaire included items on demographic characteristics, medical history, and implant-related complaints. The Four-Dimensional Symptom Questionnaire (4DSQ) is a 50-item questionnaire aimed at psychosocial complaints (Appendix A). The list distinguishes between nonspecific distress complaints (score, 0-32), depression (score, 0-12), anxiety (score, 0-24), and somatization (score, 0-32).29 The Chronic Pain Grade Scale (CPGS) is a multidimensional measure that assesses pain intensity (score, 0-100) and pain-related disability (score, 0-6) of chronic pain (Appendix B).30 A Mini–Mental State Examination (MMSE) was administered to detect cognitive failure (score, 0-30).
Statistical Analyses of Baseline Data
Baseline data were analyzed with descriptive statistics. Continuous variables were reported as mean values and standard deviation (SD) and were compared by the independent-samples t test. Categoric variables were reported as counts (%) and were compared by Pearson’s chi-square test or Fischer’s exact test. Ordinal data were reported as counts (%) and were analyzed by the Mann-Whitney U test. A P value <0.05 was considered statistically significant. Baseline data analyses were performed in SPSS Statistics 25 (IBM, Armonk, NY).
MRI Acquisition
The various types of MRI images—anatomic (T1-weighted), diffusion and functional—were acquired with a 3-T Siemens Prisma Trio whole-body scanner (Siemens Medical System, Erlangen, Germany), equipped with a 32-channel head coil. The full MRI protocol is described in the Protocol (Appendix C).
Data Preprocessing and Data Quality Assessment
Functional data were preprocessed with the BrainVoyager 22.2 package (Brain Innovation, Scannexus, Maastricht, the Netherlands), correcting for slice scan-time differences and 3-dimensional head motion with 3 translation and 3 rotation parameters. Subsequently, linear trends and low-frequency temporal drifts were removed from the data with a high-pass filter, excluding temporal frequencies below 0.01 Hz. After the preprocessing, functional data were co-registered to the high-resolution anatomic volume and normalized to Montreal Neurological Institute space. Diffusion-weighted images were preprocessed with FSL 6.0, correcting for susceptibility- and eddy-current distortions and for head motion.
Diffusion Data Analysis
The diffusion tensors were estimated from the corrected diffusion-weighted images by means of a linear fitting algorithm, after which FA and MD data were analyzed both on a whole-brain level as well as on the level of individual regions-of-interest (ROIs). These ROIs were defined from the John Hopkins JHU White-Matter Tractography and JHU ICBM-DTI-81 White Matter atlases.
Resting State Data Analysis
ROI Definition
The nodes in the pain matrix were based on the study by Kano et al.31 Regions were defined bilaterally, except for the periaqueductal grey (PAG), and were obtained from the Automated Anatomical Labeling atlas32 and the Brodmann atlas.
Connectivity Analysis on ROIs
Per participant, the connectivity for each ROI in the pain matrix with all other ROIs was computed. This resulted in a connectivity matrix per participant, which was averaged across all participants in both the BII group and the healthy control group. Subtraction of the control matrix from the BII matrix resulted in a difference matrix that indicates structural differences between groups in pain matrix functional connectivity. The statistical significance of these difference scores was assessed through means of a permutation test. To control for false positives, all P values were subject to a false discovery rate correction (q = 0.05).
RESULTS
Baseline Characteristics
Between November 2020 and October 2021, 23 participants underwent fMRI for this pilot study (Figure 1). Eleven BII patients and 12 healthy controls were included in the analysis. One participant in the BII group withdrew from the study due to claustrophobia and could therefore not be analyzed. Only cosmetic patients were included in the study. Baseline characteristics were similar in the 2 groups (Table 1). The mean [SD] age was 44 [12] years (range, 27-71 years) and the mean BMI was 22.2 [3.9] kg/m2 (range, 18.1-25.3 kg/m2). The average duration of silicone exposure was 15 [9] years (range, 4-43 years).
Baseline Characteristics of Breast Implant Illness Patients and Control Group
| Characteristic | BII (n = 11) | Control (n = 12) | P value | 95% CI | |
|---|---|---|---|---|---|
| Age (years) | 44.0 [11.1] | 44.7 [13.5] | 0.898 | –11.404 | 10,070 |
| BMI (kg/m2) | 21.4 [2.2] | 22.8 [5.0] | 0.400 | –4.7726 | 2,0120 |
| Total time silicone in situ (years) | 15.8 [5.0] | 15.2 [12.0] | 0.865 | –7.370 | 8,673 |
| Education (n, %) | 0.566 | — | — | ||
| Secondary education or lower | 0 (0) | 1 (8) | |||
| Middle-level vocational education | 5 (45) | 7 (58) | |||
| Higher-level vocational education/college/university | 5 (45) | 1 (8) | |||
| Academic/doctoral degree | 1 (9) | 3 (25) | |||
| Smoking (n, %) | 1.000 | - | - | ||
| No | 9 (82) | 10 (83) | |||
| 1-10/day | 2 (18) | 1 (8) | |||
| 10-20/day | 0 (0) | 1 (8) | |||
| >20/day | 0 (0) | 0 (0) | |||
| Alcohol (n, %) | 0.566 | — | — | ||
| No | 4 (36) | 2 (17) | |||
| 1-4/week | 5 (45) | 8 (67) | |||
| 5-8/week | 2 (18) | 2 (17) | |||
| >8/week | 0 (0) | 0 (0) | |||
| Laterality (n, %) | 0.478 | — | — | ||
| Unilateral | 1 (9) | 0 (0) | |||
| Bilateral | 11 (91) | 12 (100) |
Values are mean [standard deviation] or n (%).

Flowchart of the subject recruitment and inclusion procedure. CVA, cerebral vascular accident.
Women in the patient group reported the following implant-related complaints: fatigue (n = 11, 100%), cognitive failure (n = 11, 100%), pain (n = 10, 91%), gastrointestinal complaints (n = 10, 91%), myalgia (n = 8, 73%), hair loss (n = 8, 73%), sicca complaints (n = 8, 73%), arthralgia (n = 7, 64%), depression (n = 7, 64%), skin problems (n = 6,55%), tinnitus (n = 2, 18%), and fever (n = 1, 9%). Participants in the control group reported that they had no implant-related complaints.
The questionnaires revealed significant differences between the groups. Women in the BII group scored significantly higher on both chronic pain intensity (mean difference, 42.7; 95% CI, 22.6-62.7; P = 0.001) and pain disability (mean difference, 2.0; 95% CI, 0.6-3.4; P = 0.01) than controls. On the 4DSQ, BII patients scored significantly higher on the domains depression (mean difference, 2.6; 95% CI, 0.013-5.205; P = 0.049) and somatization (mean difference, 8.8; 95% CI, 3.657-13.834; P = 0.002). Patients scored (more than) twice as high on distress complaints (mean difference, 8.4; 95% CI, –0.361 to 17.107; P = 0.059) and anxiety (mean difference, 2.3; 95% CI, –2.378 to 6.905; P = 0.320) compared with the control group. With a minimal MMSE score of 29/30 in the BII group and 28/30 in the control group (mean difference, 0.6; 95% CI, 0.0725-1.2153; P = 0.029), no aberrant scores were identified. Questionnaire results are presented in Table 2.
Questionnaire Results of the MMSE, CPGS, and 4DSQ
| Questionnaire | BII (n = 11) | Control (n = 12) | P value | 95% CI | |
|---|---|---|---|---|---|
| MMSE | 29.7 [0.5] | 29.1 [0.8] | 0.029 | 0.0725 | 1.2153 |
| CPGS | |||||
| Intensity | 45.5 [29.1] | 2.8 [9.6] | 0.001 | 22.6301 | 62.7290 |
| Disability | 2.0 [2.1] | 0.0 [0.0] | 0/010 | 0.5908 | 3.4092 |
| 4DSQ | |||||
| Distress | 16.3 [10.3] | 7.9 [8.6] | 0.059 | –0.361 | 17.107 |
| Depression | 2.9 [3.8] | 0.3 [0.7] | 0.049 | 0.013 | 5.205 |
| Anxiety | 4.4 [6.1] | 2.1 [3.7] | 0.320 | –2.378 | 6.905 |
| Somatization | 14.6 [6.0] | 5.8 [5.0] | 0.002 | 3.657 | 13.834 |
Values are mean [standard deviation]. 4DSQ, Four-Dimensional Symptom Questionnaire; BII, breast implant illness; CPGS, Chronic Pain Grade Scale; MMSE, Mini–Mental State Examination.
Functional Connectivity Results
The results of the connectivity analyses based on the resting state fMRI measurements are summarized in Figure 2. Despite clear network activity between the different nodes in the pain matrix, the analyses did not yield significant results between the 2 groups. Even before correcting for multiple comparisons, none of the correlation pairs were statistically significant. Nevertheless, an apparent difference in connectivity seems to exist between bilateral dorsolateral PFC (DLPFC) and all other ROIs, in favor of the BII group. However, when we also averaged the connectivity between DLPFC and all other regions and tested this difference against the permutation distribution, no significant effect was found. Further investigation led to the finding that this difference was attributable to a small anatomic deviation in the frontal regions of 2 control patients which overlapped with the DLPFC ROI. Connectivity between this region to all other regions in these 2 participants was negatively affected, explaining the difference between the groups.
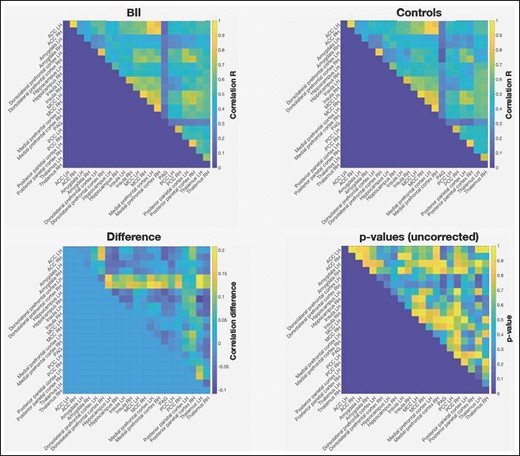
Functional connectivity results for the BII group, control group, and difference between the groups. ACC, anterior cingulate cortex; BII, breast implant illness; MCC, mid-cingulate cortex; PAG, periaqueductal grey; PCC, posterior cingulate cortex; LH, left hemisphere; RH, right hemisphere.
Diffusion Results
Whole-brain group analyses did not reveal differences in FA or MD measures between the 2 groups. Clustered differences were found but none of these differences were statistically significant (Figure 3).
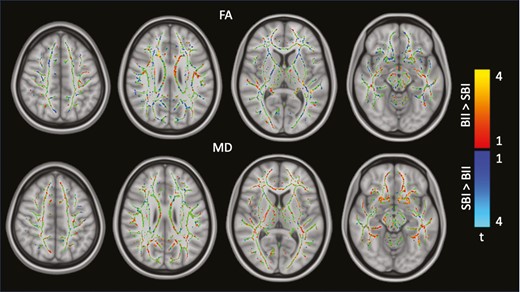
Group differences in diffusion tensor imaging–derived measures: FA (top) and MD (bottom). BII, breast implant illness; FA, fractional anisotropy; MD, mean diffusivity; SBI, silicone breast implant.
ROI-specific Group Differences
Additionally, regionally based group comparisons were performed. We examined the group differences within 8 white matter tracts bilaterally and 3 commissural tracts (tracts that connect corresponding cortical regions in the 2 hemispheres).33 For the bilateral tracts we first tested per ROI whether the DTI measures differed between hemispheres. For those ROIs showing hemispheric differences, the group comparisons were computed for the hemispheres separately. For those ROIs showing no differences, the DTI measures were averaged across the hemispheres for the estimation of the group differences.
ROI-based group comparisons did not reveal differences in FA and MD values between BII patients and asymptomatic women with SBI (Tables 3, 4). We found a significant difference within corpus callosum: in this region we found reduced FA values for patients with BII compared with women with SBIs (mean difference, 0.012, P = 0.031). However, after correcting for the number of ROI comparisons, this difference did not reach significance.
ROI-specific Group Comparisons of Fractional Anisotropy
| ROI | Difference | P-value | ||
|---|---|---|---|---|
| Anterior thalamic radiation | 0.437 [0.012] | 0.435 [0.009] | 0.002 | 0.660 |
| Corticospinal tract LH | 0.555 [0.018] | 0.557 [0.013] | –0.002 | 0.742 |
| Corticospinal tract RH | 0.566 [0.016] | 0.571 [0.012] | –0.006 | 0.360 |
| Cingulum (cingulate partition) LH | 0.598 [0.021] | 0.589 [0.022] | 0.009 | 0.355 |
| Cingulum (cingulate partition) RH | 0.525 [0.022] | 0.520 [0.034] | 0.005 | 0.710 |
| Cingulum (hippocampal partition) | 0.461 [0.014] | 0.450 [0.022] | 0.011 | 0.198 |
| Inferior fronto-occipital fasciculus | 0.496 [0.014] | 0.501 [0.022] | –0.005 | 0.558 |
| Inferior longitudinal fasciculus LH | 0.465 [0.012] | 0.464 [0.019] | 0.001 | 0.877 |
| Inferior longitudinal fasciculus RH | 0.486 [0.013] | 0.477 [0.025] | 0.009 | 0.320 |
| Superior longitudinal fasciculus LH | 0.478 [0.013] | 0.477 [0.023] | 0.001 | 0.858 |
| Superior longitudinal fasciculus RH | 0.495 [0.016] | 0.502 [0.019] | –0.006 | 0.410 |
| Unicate fasciculus LH | 0.471 [0.024] | 0.472 [0.020] | –0.001 | 0.924 |
| Unicate fasciculus RH | 0.509 [0.020] | 0.510 [0.015] | –0.002 | 0.848 |
| Corpus callosum | 0.669 [0.012] | 0.658 [0.011] | 0.012 | 0.031 |
| Forceps major | 0.643 [0.016] | 0.643 [0.021] | –0.000 | 0.956 |
| Forceps minor | 0.492 [0.014] | 0.491 [0.018] | 0.001 | 0.863 |
Each row shows for the corresponding ROI the mean [SD] fractional anisotropy value for women with SBIs without health complaints, the mean [SD] for patients with BII, the difference score between the 2 groups and the uncorrected P-value of the difference score, respectively. BII, breast implant illness; LH, left hemisphere; RH, right hemisphere; ROI, region of interest; SBI, silicone breast implant, SD, standard deviation.
ROI-specific Group Comparisons of Mean Diffusivity
| ROI | Difference (×10–3) | P-value | ||
|---|---|---|---|---|
| Anterior thalamic radiation LH | 0.564 [0.027] | 0.568 [0.041] | -0.003 | 0.826 |
| Anterior thalamic radiation RH | 0.569 [0.028] | 0.574 [0.047] | -0.005 | 0.781 |
| Corticospinal tract | 0.543 [0.016] | 0.531 [0.033] | 0.012 | 0.312 |
| Cingulum (cingulate partition) LH | 0.597 [0.024] | 0.589 [0.045] | 0.008 | 0.624 |
| Cingulum (cingulate partition) RH | 0.614 [0.030] | 0.597 [0.039] | 0.017 | 0.285 |
| Cingulum (hippocampal partition) LH | 0.550 [0.031] | 0.521 [0.042] | 0.029 | 0.087 |
| Cingulum (hippocampal partition) RH | 0.570 [0.032] | 0.553 [0.042] | 0.018 | 0.284 |
| Inferior fronto-occipital fasciculus | 0.671 [0.019] | 0.666 [0.028] | 0.005 | 0.631 |
| Inferior longitudinal fasciculus LH | 0.686 [0.023] | 0.677 [0.032] | 0.009 | 0.441 |
| Inferior longitudinal fasciculus RH | 0.671 [0.019] | 0.666 [0.026] | 0.004 | 0.666 |
| Superior longitudinal fasciculus LH | 0.656 [0.015] | 0.655 [0.038] | 0.002 | 0.893 |
| Superior longitudinal fasciculus RH | 0.638 [0.014] | 0.635 [0.034] | 0.003 | 0.787 |
| Unicate fasciculus | 0.664 [0.021] | 0.650 [0.019] | 0.014 | 0.130 |
| Corpus callosum | 0.600 [0.022] | 0.590 [0.049] | 0.010 | 0.565 |
| Forceps major | 0.679 [0.021] | 0.664 [0.029] | 0.015 | 0.195 |
| Forceps minor | 0.672 [0.026] | 0.664 [0.026] | 0.008 | 0.477 |
Each row shows for the corresponding ROI the mean [SD] mean diffusivity value for women with SBIs without health complaints, the mean [SD] for patients with BII, the difference score between the 2 groups and the P- value of the difference score, respectively. BII, breast implant illness; LH, left hemisphere; RH, right hemisphere; ROI, region of interest; SBI, silicone breast implant; SD, standard deviation.
Discussion
The aim of this exploratory pilot study was to examine whether alterations in structural and functional measures can be found in brain regions involved in the pain matrix in BII patients compared with asymptomatic women with SBI by means of 3-T fMRI. The main findings of this study were that the analyses of both functional connectivity and structural integrity showed no significant differences between the 2 groups, despite the large clinical differences.
Women with BII report experiencing pain. Not only local pain to the chest, as in capsular contracture, but also widespread pain, as in fibromyalgia, has been reported in relation to breast implants.1,9 We found that both pain intensity and pain-related disability measured with the CPGS were significantly higher in BII patients than in controls. Previous MRI studies have led to the understanding that chronic pain patients display brain alterations regarding brain function and structure.34,35 In FM patients, both increased and decreased functional connectivity within the different pain-related brain regions have been found.36 For example, reduced activity of the descending inhibitory pathways as well as reduced activity and connectivity within the anterior cingulate cortex and thalamus have been found in FM patients compared with healthy volunteers in response to pressure stimulation.37,38 In addition, maladaptive cognitive and emotional factors in patients with chronic pain, such as pain catastrophizing, anxiety, and depression, have been related to brain alteration in chronic pain patients.18 In contrast, this first pilot study investigating brain regions involved in the pain matrix in women with breast implants demonstrated no differences between BII patients and asymptomatic women. Several reasons may underlie this outcome, such as methodological limitations (eg, small sample size) or the lack of a neurological correlate.
Cognitive failure was reported as the most common symptom in BII patients alongside fatigue. This is consistent with the results of our previous study examining the prevalence of self-reported complaints in women with breast implants.1 Cognitive disorders are often cited as major complaints by BII patients. These complaints are comparable to those of “fibrofog” in fibromyalgia patients: the experience of subjective cognitive failure.39 Previous research showed that the prevalence and severity of subjective cognitive failure in unselected women with breast implants was comparable to that of healthy controls, that these cognitive complaints affect a selected patient group, and that there is no increased risk of cognitive failure among women with breast implants.4 Fibromyalgia patients, on the other hand, scored significantly worse on the MMSE than healthy controls in several studies, indicating objective cognitive impairment in these patients.40,41 In our current study, we did not find lower MMSE scores in women with BII compared with asymptomatic women. Therefore, it could be suggested that the cognitive impairment related to BII is only of a subjective, rather than an objective nature. In addition, these findings make serious cognitive impairment with an underlying neurological cause more unlikely.
Although we did not find any significant differences between BII patients and controls in fMRI neuroimaging, large differences were found in the 4DSQ outcomes, a measure of psychological symptoms.29 BII patients scored moderately to highly elevated on the distress scale, compared with controls. This score indicates the degree of subjective psychological suffering. According to the normative data, 17.5% of the general population experiences above-average distress (>10), whereas 63.6% of the BII patients in our study scored >10. In addition, 12.3% of the general population experiences above-average somatization, compared with 81.1% of the BII patients in our study. Women with BII also scored moderately to highly elevated on anxiety and depression.42 These higher levels of anxiety in BII patients correspond to previous findings reported in the literature.43 Therefore, psychological factors may play an important role in the perception of complaints in BII. The relationship between psychological or cognitive factors and persistent pain is well known. For example, a significant association between persistent postmastectomy pain and catastrophizing, somatization, and anxiety has been found, while demographic, surgical, medical, and treatment-related factors were not associated with persistent pain.44 The same factors were found to be associated with persistent headache, low back pain, and temporomandibular pain.45-47 The results of this current pilot study strongly suggest that distress, somatization, anxiety, and depression are significantly associated with the development of BII, regardless of other demographic and surgical characteristics.
Closely related to the above hypothesis is the nocebo effect. This effect is more likely to occur in people who are more anxious, experience more psychological distress, or have a history of medically unexplained symptoms.48 As a result of the nocebo effect, people develop complaints due to negative expectations; the opposite of the placebo effect.49 Learning mechanisms and classical conditioning underlie this effect, as does learning about the experience of others. In other words, negative effects can be induced by social context and modeling, such as negative media coverage, self-obtained information from the internet, or stories from other patients.48 Women with breast implants can read other women’s experiences on social media or watch television documentaries, recognizing the symptoms described. Subsequently, they may attribute their own systemic complaints, such as fatigue, to the breast implants.50
This exploratory pilot study had several limitations. Because we were the first to conduct a neuroimaging study on BII patients, we were unable to perform a power calculation. We used a small sample size in this study to make an initial exploration of brain function in women with breast implants. This may be the reason for the lack of statistical significance. However, significant differences were found in these small groups based on the questionnaires. It is important to note that various patient-related factors, such as the tendency to exaggerate, can influence the score upwards in individual cases, especially in BII. Due to the cross-sectional design of the study, a change over time could not be demonstrated. Longitudinal research with both preoperative and postoperative measurements could provide more insight into the effects of SBIs on brain function. Furthermore, we believe that comparing our results with the results of women without breast implants or (former) BII patients who have already undergone explantation of the prostheses would be a valuable follow-up to this study. We will therefore investigate this research question and publish the results in the near future.
Conclusions
This pilot study showed no evidence of brain alterations in BII patients. However, BII patients scored significantly higher on distress, somatization, anxiety, and depression than asymptomatic women with SBIs. Psychological factors appear to play an important role in BII and should be further investigated.
Disclosures
The authors declared no potential conflicts of interest with respect to the research, authorship, and publication of this article.
Funding
Dr Colaris received the Brains Unlimited Pioneer Fund 2016 from the University Fund Limburg/SWOL, a subsidy covering the costs of 10 scanning hours at the MRI scanning facilities of Scannexus (Maastricht, the Netherlands). All other scanning hours as well as support for MRI data analyses were covered by Maastricht University, Faculty of Health, Medicine and Life Sciences.

