


Abstract
Altmetrics (alternative metrics) have become one of the most commonly utilized metrics to track the impact of research articles across electronic and social media platforms.
The goal of this study was to identify whether the Altmetric Attention Score (AAS) is a good proxy for citation counts and whether it can be employed as an accurate measure to complement the current gold standard.
The authors conducted a citation analysis of all articles published in 6 plastic surgery journals during the 2016 calendar year. Citation counts and AAS were abstracted and analyzed.
A total of 1420 articles were identified. The mean AAS was 11 and the median AAS was 1. The journal with the highest mean AAS was Aesthetic Surgery Journal (31), followed by Plastic and Reconstructive Surgery (19). A weak positive correlation was identified (r = 0.33, P < .0001) between AAS and citations. Articles in the top 1% in terms of citation counts showed strong positive correlation between AAS and citation counts (r = 0.64, P = .01). On the contrary, articles in the top 1% of AAS had no significant correlation with citation counts (r = −0.31, P = .29).
Overall correlation between citations and AAS was weak, and therefor AAS may not be an accurate early predictor of future citations. The 2 metrics seem to measure different aspects of the impact of scholarly work and should be utilized in tandem for determining the reach of a scientific article.
Since the dawn of scientific publication, there has been a constant attempt to identify the perfect assessment metric for academic output.1-3 The number of times an article is cited in other scholarly articles (citation counts) has been considered the gold standard to assess the impact of scientific work.1,2,4 Widely utilized bibliometric indices (eg, impact factor [IF], H-index), which are critical in evaluating grant applications and promotions, incorporate the citation counts in their calculation.5-7 However, the citation counts have their own shortcomings. The duration of time required to accumulate citations could span several years considering the prolonged process and time frame of publishing for peer-reviewed articles.8,9 More recently, with the advent of the internet and social media as educational platforms, other metrics have been developed to complement the conventional citation counts.4,7
Since its inception in 2010, Altmetrics has become one of the most commonly utilized alternative metrics to track the impact of research articles.4,10-12 The Altmetric Attention Score (AAS) is calculated as a weighted approximation based on an unpublished automated algorithm that takes several sources into account to calculate a composite score (Table 1).4,13,14 The AAS has become an indicator of the attention a scholarly output receives across electronic platforms, including Twitter, Facebook, blogs, news outlets, etc, and it is featured as a multi-colored donut as illustrated in Figure 1.4,7,13,14
Default Weightings of Various Sources for AAS Calculation
| Source | Weight |
|---|---|
| News | 8 |
| Blog | 5 |
| Policy document (per source) | 3 |
| Patent | 3 |
| Wikipedia | 3 |
| Twitter (tweets and retweets) | 1 |
| Peer review (Publons, Pubpeer) | 1 |
| Weiboa | 1 |
| Google+ b | 1 |
| F1000 | 1 |
| Syllabi (Open Syllabus) | 1 |
| LinkedInc | 0.5 |
| Facebook (only curated list of public pages) | 0.25 |
| 0.25 | |
| Pinterestd | 0.25 |
| Q&A (stack overflow) | 0.25 |
| YouTube | 0.25 |
| No. of Mendeley readers | 0 |
| No. of Dimensions and Web of Science citations | 0 |
Source: https://help.altmetric.com/support/solutions/articles/6000060969-how-is-the-altmetric-score-calculated. Accessed March 9, 2020. AAS, Altmetric Attention Score. aNot trackable since 2015 but historical data kept. bNot trackable since 2019 but historical data kept. cNot trackable since 2014 but historical data kept. dNot trackable since 2013 but historical data kept.
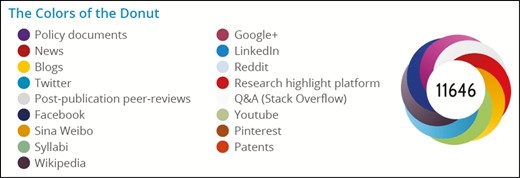
The colors of the Altmetric donut represent different sources of social attention (https://www.altmetric.com/about-our-data/the-donut-and-score, accessed on March 3, 2020).
Given the long times required for accrual of citations, AAS has been suggested as an assessment tool for academic promotions and evaluation of grant applications.15 It is still a question of debate as to whether the AAS is a good proxy for citation counts and whether it can be employed as an accurate measure to complement the current gold standard. Previous studies have assessed the relationship between citation counts and AAS and found a weak to moderate positive correlation between the 2 metrics.4,16-20 However, this relationship has not been adequately explored in the field of plastic, reconstructive, and aesthetic surgery. Ruan et al assessed the correlation between AAS and Scopus citations for the 55 most-cited articles published in Plastic and Reconstructive Surgery (PRS) and found no significant correlation between the 2 metrics.21 However, their limited sample size might have confounded the authors’ findings. Owing to the major role for social media in the field of plastic surgery,22 we hypothesize that plastic surgery journals would have high AAS and that AAS would have a strong correlation with citation count. To test this hypothesis, we assessed the AAS for articles published in 6 plastic surgery journals in 2016 and evaluated the correlation between AAS and the conventional citation counts.
METHODS
We conducted a citation analysis for all articles published by 6 plastic surgery journals (3 journals with a general scope and 3 journals with a specific scope) during the 2016 calendar year. We chose the year 2016 to allow adequate time for citation accrual. The journals with the highest IFs according to the Journal Citation Report 2018 were selected and included the following general plastic surgery journals: PRS (IF, 3.946), Journal of Plastic Reconstructive and Aesthetic Surgery (JPRAS; IF, 2.228), Annals of Plastic Surgery (Annals; IF, 1.448); and the following specialty journals: Aesthetic Surgery Journal (ASJ; IF, 3.48), Journal of Hand Surgery-European Volume (Hand; IF, 2.225), and Microsurgery (Microsurgery; IF, 1.945).
Data Collection
We abstracted all published articles in the above-mentioned journals during the specified time period from the Web of Science (Clarivate Analytics).23 This provided the citation counts for these articles up to the time of the search (October to December 2019). Only original and review articles were included whereas letters and editorials were excluded. For articles published in 2016, not all journals provided the AAS for a given article on the journal website. Therefore, to maintain consistency of our methodology, we utilized the Altmetric’s bookmarklet, which was similar to the one provided by the individual journals. The Altmetric’s bookmarklet analyzes the article’s media coverage and social network presence employing an online calculated formula.24 This bookmarklet can be downloaded and stored in the bookmarks toolbar of internet browsers. Once installed, the following steps were performed for each of the included articles: (1) search PubMed by article title; (2) click on the “Altmetric It!” button on the toolbar; and (3) record the AAS as shown in the middle of the donut graphic.
The AAS search was completed during the same time period as the citation search (October to December 2019). The search was conducted by M.A. and S.M.H., and any discrepancies were resolved by A.R. To evaluate the social media presence of the included journals, we searched popular social media platforms (Facebook, Instagram, Twitter, and YouTube) for the journals’ names. To assess the activity and interaction with these platforms, we extracted the number of followers, likes, posts, and the start date of the journals’ social media platforms. Journal outreach was defined as the number of followers, likes, and subscribers according to the individual platform.
Statistical Analysis
Continuous variables were summarized utilizing median and mean, and categorical variables were presented as percentages and proportions. To evaluate the correlation between AAS and citations, we employed Spearman correlation coefficient given the skewness of the data. An r value between 0 and 0.19 was considered very weak, 0.2 and 0.39 as weak, 0.40 and 0.59 as moderate, 0.6 and 0.79 as strong, and 0.8 and 1 as very strong correlation.25 Additional subanalyses were performed utilizing articles above the median, above the 75th percentile, above the 90th percentile, and above the 99th percentile (in the top 1%) for both citations and AAS. To examine the effect of time on the correlation between citations and AAS, all articles were analyzed utilizing cumulative citations of each additional year from the time of publication (eg, correlation between AAS and citations in 2016 only; 2016 and 2017; 2016, 2017, and 2018; and total citations [2016-2019]).
To account for differences between journals, we calculated the normalized data utilizing the following formula: article AAS/mean AAS and article number of citations/mean citation counts of the individual journal in which the article was published.4
Statistical significance was defined as P < 0.05. All statistical analysis was performed employing JMP Pro 14 software (JMP, Pro 14, SAS Institute Inc, Cary, NC, 1989-2019).
RESULTS
We identified a total of 1420 articles published in the 6 journals in 2016. The mean AAS was 11, and the median AAS was 1, indicating right-skewed distribution as shown in Figure 2. The majority of articles had an AAS of either 0 (n = 385, 27%) or 1 (n = 462, 33%). Citations also showed similar right-skewed distribution, albeit to a lesser degree (mean 7, median 5; Figure 3). The journal with the highest mean AAS was ASJ (31), followed by PRS (19) (Table 2). ASJ and PRS had significantly higher AAS compared with the other journals (P < .0001).
Summary Statistics of Journals’ Citations, AAS, and Impact Factor
| Journal | Impact factor | No. of articles | AAS | Citations | ||||
|---|---|---|---|---|---|---|---|---|
| Mean (SD) | Median | Max | Mean (SD) | Median | Max | |||
| Overall | — | 1420 | 11 (49) | 1 | 729 | 7 (9) | 5 | 117 |
| ASJ | 3.48 | 130 | 31 (100) | 9 | 729 | 9 (9) | 6 | 69 |
| Annals | 1.448 | 347 | 2 (5) | 1 | 74 | 5 (5) | 3 | 31 |
| Hand | 2.225 | 112 | 2 (3) | 1 | 25 | 6 (6) | 5 | 29 |
| JPRAS | 2.228 | 232 | 2.5 (15) | 1 | 231 | 6 (9) | 4 | 74 |
| Microsurgery | 1.945 | 96 | 0.3 (1) | 0 | 8 | 5 (5) | 3.5 | 29 |
| PRS | 3.946 | 503 | 19 (62) | 3 | 629 | 10 (10) | 7 | 117 |
AAS, Altmetric Attention Score; Annals, Annals of Plastic Surgery; ASJ, Aesthetic Surgery Journal; Hand, Journal of Hand Surgery-European Volume; JPRAS, Journal of Plastic Reconstructive and Aesthetic Surgery; PRS, Plastic and Reconstructive Surgery; SD, standard deviation.
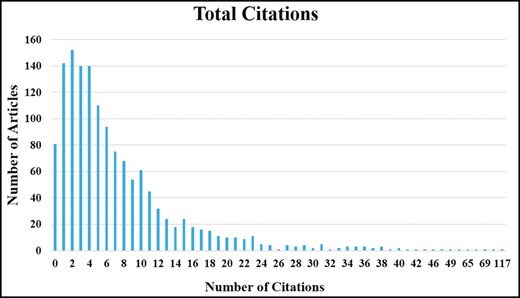
Right-skewed citation distribution.
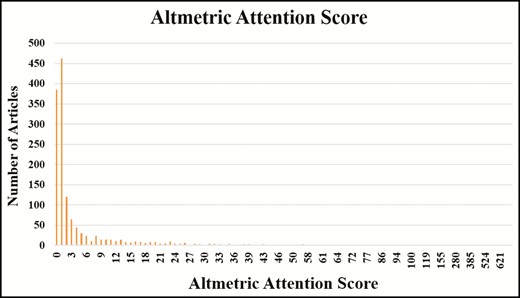
Right-skewed Altmetric Attention Score distribution.
A weak positive correlation was identified (r = 0.33, P < .0001) between AAS and citations. When evaluating this correlation of the individual journals, PRS (r = 0.39, P < .0001), JPRAS (r = 0.33, P < .0001), ASJ (r = 0.21, P = .02), and Annals (r = 0.2, P = .0002) all demonstrated weak positive correlations, whereas Microsurgery (r = 0.03, P = .77) and Hand (r = 0.01, P = .89) did not show a significant correlation between AAS and citation counts (Table 3).
Correlation Between AAS and Citations
| Articles | Correlation | ||
|---|---|---|---|
| n | r | P | |
| Overall | 1420 | 0.33 | <0.0001a |
| ASJ | 130 | 0.21 | .02a |
| Annals | 347 | 0.2 | 0.0002a |
| Hand | 112 | 0.01 | .89 |
| JPRAS | 232 | 0.33 | <0.0001a |
| Microsurgery | 96 | 0.03 | .77 |
| PRS | 503 | 0.39 | <0.0001a |
| Articles | Correlation | ||
|---|---|---|---|
| n | r | P | |
| Overall | 1420 | 0.33 | <0.0001a |
| ASJ | 130 | 0.21 | .02a |
| Annals | 347 | 0.2 | 0.0002a |
| Hand | 112 | 0.01 | .89 |
| JPRAS | 232 | 0.33 | <0.0001a |
| Microsurgery | 96 | 0.03 | .77 |
| PRS | 503 | 0.39 | <0.0001a |
AAS, Altmetric Attention Score; ASJ, Aesthetic Surgery Journal; Annals, Annals of Plastic Surgery; Hand, Journal of Hand Surgery-European Volume; JPRAS, Journal of Plastic Reconstructive and Aesthetic Surgery; PRS, Plastic and Reconstructive Surgery. aStatistically significant.
Articles in the top 1% (in terms of citation counts) showed a strong positive correlation between citation counts and AAS (r = 0.64, P = .01). On the contrary, articles in the top 1% of AAS had no significant correlation with citation counts (r = −0.31, P = .29). Articles in the top 50% and 25% in terms of citation counts had a similar correlation with AAS (r = 0.32, P < .0001; r = 0.31, P < .0001, respectively) to the overall sample (weak positive), and articles in the top 10% in terms of citation counts had a very weak positive correlation with AAS (r = 0.17, P = .04) (Table 4). Articles in the top 50%, 25%, and 10% in terms of AAS all had weak positive correlations with the citation counts (0.37, 0.22, and 0.24, respectively), all of which were statistically significant (Table 5).
Correlation Between AAS and Citations for All Articles and for Articles With >50%, 75%, 90%, and 99% of Citations
| Articles | All | ≥50% Citations | ≥75% Citations | ≥90% Citations | ≥99% Citations | ||||||||||
|---|---|---|---|---|---|---|---|---|---|---|---|---|---|---|---|
| n | r | P | n | r | P | n | r | P | n | r | P | n | r | P | |
| Overall | 1420 | 0.33 | <0.0001a | 765 | 0.32 | <0.0001a | 364 | 0.31 | <0.0001a | 142 | 0.17 | 0.04a | 14 | 0.64 | 0.01a |
AAS, Altmetric Attention Score. aStatistically significant.
Correlation Between AAS and Citations for All Articles and for Articles With >50%, 75%, 90%, and 99% of AAS
| Articles | All | ≥50% AAS | ≥75% AAS | ≥90% AAS | ≥99% AAS | ||||||||||
|---|---|---|---|---|---|---|---|---|---|---|---|---|---|---|---|
| n | r | P | n | r | P | n | r | P | n | r | P | n | r | P | |
| Overall | 1420 | 0.33 | <0.0001a | 1035 | 0.37 | <0.0001a | 388 | 0.22 | <0.0001a | 143 | 0.24 | 0.005a | 14 | −0.31 | 0.29 |
AAS, Altmetric Attention Score. aStatistically significant.
The correlation coefficient increased as additional years for citations were included from 0.2 (P < .0001) in 2016 to 0.33 (P < .0001) over the longest timespan (2016-2019) (Table 6). The correlation coefficient between the normalized citation count and normalized AAS was 0.23 (P < .0001), which was less than the correlation for the overall raw sample (r = 0.33, P < .0001) (Table 7). When assessing the social media presence of the included journals, the reach was widest for PRS and ASJ compared with the other journals as demonstrated in Table 8.
Correlation Between AAS and Citations for Citations Accumulated During 2016; 2016 and 2017; 2016 to 2018; and the Overall Study Period (2016-2019)
| Citations | 2016 only | 2016, 2017 | 2016, 2017, 2018 | All years | ||||
|---|---|---|---|---|---|---|---|---|
| r | P | r | P | r | P | r | P | |
| Overall | 0.2 | <0.0001a | 0.28 | <0.0001a | 0.33 | <0.0001a | 0.33 | <0.0001a |
| Citations | 2016 only | 2016, 2017 | 2016, 2017, 2018 | All years | ||||
|---|---|---|---|---|---|---|---|---|
| r | P | r | P | r | P | r | P | |
| Overall | 0.2 | <0.0001a | 0.28 | <0.0001a | 0.33 | <0.0001a | 0.33 | <0.0001a |
AAS, Altmetric Attention Score. aStatistically significant.
Correlation Between NAAS and Normalized Citations for All Articles and for Articles in the Top 50% and 75% for Normalized Citations and for NAAS
| n | r | P | |
|---|---|---|---|
| Normalized citations vs NAAS | 1420 | 0.23 | <0.0001a |
| NAAS ≥50% | 771 | 0.25 | <0.0001a |
| NAAS ≥75% | 349 | 0.11 | 0.045a |
| Normalized citations ≥50% | 683 | 0.23 | <0.0001a |
| Normalized citations ≥75% | 355 | 0.2 | 0.0002a |
| n | r | P | |
|---|---|---|---|
| Normalized citations vs NAAS | 1420 | 0.23 | <0.0001a |
| NAAS ≥50% | 771 | 0.25 | <0.0001a |
| NAAS ≥75% | 349 | 0.11 | 0.045a |
| Normalized citations ≥50% | 683 | 0.23 | <0.0001a |
| Normalized citations ≥75% | 355 | 0.2 | 0.0002a |
NAAS, normalized Altmetric Attention Score. aStatistically significant.
Social Media Metrics for the Included Journals
| Journal | YouTube | |||||||||
|---|---|---|---|---|---|---|---|---|---|---|
| Start date | Likes | Start date | Followers | Start date | Followers | Posts | Start date | Subscribers | Views | |
| ASJ | 07/2013 | 11,352 | 04/2014 | 9537 | 03/2018 | 2325 | 121 | 11/2004 | 7150 | 3,758,591 |
| Annals | 10/2011 | 268 | N/A | N/A | N/A | N/A | N/A | N/A | N/A | N/A |
| Hand | N/A | N/A | 11/2015 | 2,221 | N/A | N/A | N/A | N/A | N/A | N/A |
| JPRAS | 01/2018 | 745 | 01/2018 | 1816 | 01/2018 | 1835 | 47 | N/A | N/A | N/A |
| Microsurgery | N/A | N/A | N/A | N/A | N/A | N/A | N/A | N/A | N/A | N/A |
| PRS | 09/2010 | 29,816 | 04/2009 | 15,800 | 04/2017 | 15,500 | 668 | 10/2010 | 4550 | 638,501 |
Annals, Annals of Plastic Surgery; ASJ, Aesthetic Surgery Journal; Hand, Journal of Hand Surgery-European Volume; JPRAS, Journal of Plastic Reconstructive and Aesthetic Surgery; N/A, not available; PRS, Plastic and Reconstructive Surgery.
DISCUSSION
Our results show variability in AAS among plastic surgery journals. The overall correlation between AAS and citations was weak with inter-journal variability. Articles in the top 1% of citation counts showed strong positive correlation between AAS and number of citations, whereas articles in the top 1% of AAS had no significant correlation between the 2 metrics. The correlation between AAS and citation counts increased as more time was allowed for citations to accumulate. The correlation coefficient diminished when comparing normalized citation counts with normalized AAS.
We identified notable differences between journals in terms of AAS. The journal with he highest AAS was ASJ followed by PRS, with considerable differences compared with the remaining journals. The social media presence of the included journals could explain these differences at least in part. PRS and ASJ had greater outreach on these platforms, which may account for their higher AAS. In a prospective randomized trial performed by the Thoracic Surgery Social Media Network, 112 original articles were randomized to be promoted on the journal’s Twitter account (intervention group) or not (control group).26 The authors found that tweeting increased the AAS in the intervention group almost sevenfold compared with the control group.26 Wang et al reported similar findings in the field of neurosurgery, where journals with active social media accounts had higher AAS. This highlights the role of a journal’s social media page in promoting their key publications. However, the article type and topic may also affect the amount of attention an article receives. Cosmetic articles may be of more interest to the general public compared with those in other subspecialties of plastic surgery, possibly accounting for ASJ receiving the highest AAS. Although journals are generally read by academicians and surgeons, AAS assesses how the general public interacts with these articles. For example, a surgeon shares an article on their social media platform, and this article might be subsequently shared by their followers (which can include patients). News outlets might utilize different articles as references in their posts. This hypothesis, however, needs to be confirmed through future studies. AAS seems to possess a right-skewed distribution as has been demonstrated previously for citation distribution with few articles contributing to the overall score and most articles receiving an AAS of 0 or 1.27
Although Altmetrics is increasingly utilized as a measurement of public interest, this tool is based on a weighted approximation score that has not yet been validated. Therefore, it is not certain if AAS accurately represents what it is supposed to measure: social attention. A comparison with the currently available gold standard (citation count) would serve as a validation tool for this metric. Previous studies in multiple surgical disciplines determined that AAS did not strongly correlate with citation counts.18,19,21,28-30 Chang et al found a weak positive correlation between AAS and number of citations (r = 0.19), whereas Mullins et al reported a moderate positive correlation (r = 0.46).18,19 However, these studies included only the most cited articles, which might skew the reported results. Our study included all articles published in 2016 in the included journals with a subanalysis of the most cited articles. Our findings corroborate the results of previous studies that AAS is weakly correlated with citation counts. We did not see a significant increase in this correlation for the articles with high citation counts except articles in he top 1% in terms of citation count. Moreover, there is significant variability in the correlation between journals.
The reason for the low correlation between the 2 metrics is likely multifactorial. It seems that articles with remarkable social attention may not have the same scientific impact. Sathianathen et al found that sex-related articles had the highest online attention in urology journals without being scientifically impactful.28 In our study, the top 5 articles in terms of the highest AAS scores did not perform similarly on citation counts. A review article about sleep wrinkles generated an AAS of 729 but had only 3 citations.31 The other 4 studies with the highest AAS scores were related to hair transplant, breast reconstruction, e-cigarettes, and the plastic surgery hashtag (“#plasticsurgery”).22,31-34 It can be argued that these articles are neither novel nor present a major scientific impact but are, however, of public interest. The online presence of certain journals and the selection of specific articles to be promoted on the journal social media platforms may impact the AAS but has an uncertain effect on the citation count. Captivating titles and misleading information are sometimes utilized to attract public attention, which may in turn affect the AAS.28 For example, the review article on sleep wrinkles was titled by several news outlets as “The Ultimate Solution For The New Wrinkle Has Arrived.” 31,35 However, the article did not offer any treatment or ultimate solution for wrinkles but rather recommended sleeping on the back for decreasing sleep wrinkles, acknowledging that “we unconsciously change position throughout the night” and that the “the consequence of repetitive stretching of facial tissue over time . . . warrants further study.” 31
Altmetrics has its advantages and drawbacks as a measurement tool to assess scholarly work. Unlike citations that accrue over time, Altmetrics allows a near real-time evaluation of the social influence of academic work. A previous study has shown that the AAS plateaus within 2 weeks of publication,36 whereas the 2-year citation count included in the IF calculation can predict the long-term number of citations an article will achieve.1 However, AAS has definite drawbacks. The generation of publicity on social media and other platforms, which reflects AAS, is not subject to the rigorous peer-review process required to obtain citations. Without the peer-review process, it is difficult to ascertain whether study findings were accurately interpreted and referenced in the online content. Moreover, the AAS is easier to manipulate compared with citations.37,38 Although a citation in another article is required to increase the citation counts, AAS can be artificially inflated by creating multiple social media accounts or incentivizing tweets and Facebook likes.37 The lack of validation of the AAS algorithm and the weighing of the score components similarly for different fields (which have diverse audiences across the various online sources) are other shortcomings of the AAS. For example, Instagram is an important platform in plastic surgery but is not included in the calculation of AAS.39-43 This has been highlighted by Sathianathen et al, who developed a new score (UroSoMe-Score) that has been shown to have better predictability for citation counts compared with AAS in urology journals.28
Although our study evaluated over 1000 articles across 6 plastic surgery journals, it has certain limitations. We only included articles in 6 plastic surgery journals over a 1-year period, which limits the generalizability of our results. The popularity of social media has been increasing over the last few years, and higher AAS could potentially be attained by assessing more recently published articles. However, the year 2016 was chosen to allow enough time for citation accumulation and meaningful correlation analysis. Few journals provided the number of downloads, which limited our ability to analyze this variable. As shown in our results, the correlation between AAS and citation counts increased as more time passed for citations. However, we could not assess the change of AAS over time because this information is not available in the Altmetrics database, and it has been shown that AAS plateaus within 14 days of publication.36 The correlation between citation count and AAS provides a measure of association rather than causation. It is not clear whether the factors driving citation count and AAS are similar: the underlying importance of the article or whether gaining public attention will ultimately lead to higher citations. The answer might be a combination of both. From the current study, we can summarize that AAS and citations are poorly correlated and that AAS may not be utilized as an early metric for future prediction of citations. However, perfect correlation should not be the goal. These 2 metrics assess different aspects of an article’s reach and measure the interest of different audiences.44 Whereas AAS assesses the public interest of scholarly work, citations assess the impact it has in the scientific community. Therefore, these metrics should be utilized in a complementary manner. It is still too early to determine whether AAS should be employed in determining promotions, grant applications, and tenures. Future studies can validate the accuracy of AAS in measuring social media visibility in the field of plastic surgery and analyze other metrics that would serve as a better representation of online attention.
CONCLUSIONS
PRS and ASJ had higher AAS compared with other plastic surgery journals, possibly due to their expanded social media presence. Overall correlation between citations and AAS was weak, and AAS may not be an accurate early predictor of future citations. The 2 metrics seem to measure different aspects of the impact of scholarly work and should not be utilized interchangeably.
Disclosures
The authors declared no potential conflicts of interest with respect to the research, authorship, and publication of this article.
Funding
The authors received no financial support for the research, authorship, and publication of this article.
References

