


Abstract
Archaeobotanists and palaeoecologists use geometric morphometrics extensively to identify plant opal phytoliths. Particularly when applied to assemblages of phytoliths from concentrations retrieved from closed contexts, morphometric data from archaeological phytoliths compared with similar data from reference material can allow taxonomic attribution. Observer variation is one aspect of phytolith morphometry that has received little attention but might be an important source of error and a potential cause of misidentification of plant remains.
To investigate inter- and intra-observer variation in phytolith morphometry, eight researchers (observers) from different laboratories measured 50 samples each from three phytolith morphotypes (Bilobate, Bulliform flabellate and Elongate dendritic) three times, under the auspices of the International Committee for Phytolith Morphometrics (ICPM).
Data for 17 size and shape variables were collected for each phytolith by manually digitizing a phytolith outline (mask) from a photograph, followed by measurement of the mask with open-source morphometric software.
Inter-observer variation ranged from 0 to 23 % difference from the mean of all observers. Intra-observer variation ranged from 0 to 9 % difference from the mean of individual observers per week. Inter- and intra-observer variation was generally higher among inexperienced researchers.
Scaling errors were a major cause of variation and occurred more with less experienced researchers, which is likely to be related to familiarity with data collection. The results indicate that inter- and intra-observer variation can be reduced substantially by providing clear instructions for and training with the equipment, photograph capturing, software, data collection and data cleaning. In this paper, the ICPM provides recommendations to minimize variation. Advances in automatic data collection might eventually reduce inter- and intra-observer variation, but until this is common practice, the ICPM recommends that phytolith morphometric analyses adhere to standardized guidelines to assure that measured phytolith variables are accurate, consistent and comparable between different researchers and laboratories.
INTRODUCTION
Phytoliths are microscopic bodies of opal silica (SiO2.nH2O) formed in cells, cell walls and intercellular spaces in living plants. Given that they preserve far longer than organic matter in a wide range of conditions, they have relevance in many scientific fields, including archaeology, palaeoecology, evolutionary studies, taxonomy and climate studies. In archaeology, phytolith analysis can provide taxonomic attribution (identification) of plant remains and distinguish plant parts to answer questions about vegetation, plant use and related socio-economic aspects of former societies (Piperno, 2006; Ryan, 2014; Ball et al., 2016a).
There are various ways to classify phytoliths; typically, phytoliths are classified into morphotypes, based on simple visual observations of shape, surface structure and size (ICPT, 2019). Some morphotypes have a unique anatomical origin and a repetitive, well-determined and easily identifiable shape, allowing for distinction of plant parts and/or taxonomic groups (Brown, 1984; Mulholland and Rapp, 1992). However, because many morphotypes are found in multiple taxa and/or multiple plant parts (redundancy) and because there can be considerable variation within morphotypes owing to genetic and environmental factors, the utility of this approach is constrained. Morphotype classification can also be subjective and difficult to replicate. One method that has been used to overcome these problems is morphometry, which is the measurement of phytolith size and shape. This method, when applied to populations (assemblages) of phytoliths with adequate sample size (Ball et al., 2016b), is often used to differentiate typologically identical phytoliths found in closely related taxa, including cereal crops, from archaeological contexts (e.g. Pearsall, 1978; Piperno, 1984; Lu and Liu, 2003; Ball et al., 2006, 2009; Lu et al., 2009; Portillo et al., 2009; Gu et al., 2013; Ball et al., 2016a; Wang et al., 2019; Out et al., 2022; see also Portillo et al., 2020). It is also used in palaeoecological and evolutionary studies (Liu et al., 2016; Hošková et al., 2022; Solomonova et al., 2023; Brightly et al., 2024). While the method can be applied in various ways, it works particularly well when phytoliths are collected from concentrations of decomposed plant material from primary contexts (Berlin et al., 2003; Piperno, 2006; Portillo and Albert, 2011; Shillito, 2011; Madella and Lancelotti, 2012; Ball et al., 2016b; Vrydaghs et al., 2016; Devos and Vrydaghs, 2023).
Initially, phytolith morphometry consisted of simple measurements of length and width. Nowadays, two geometric morphometric methods are available: (1) drawing complete phytolith outlines called masks, either using morphometric analysis, as pioneered by Ball and Brotherson (1992, Ball et al., 2016b), or elliptic Fourier analysis (for a comparison, see Díez-Pastor et al., 2020); and (2) Procrustes approaches, defining phytolith shape based on (semi-)landmarks (homologous points; e.g. Gallaher et al., 2020; Hošková et al., 2021). Three-dimensional (3D) analysis of phytoliths has recently been performed (Gallaher et al., 2020), and computer-assisted morphometry (i.e. automatic collection of measurements and, in some cases, detection of outlines) is increasingly used to classify phytoliths. While fully automatic phytolith morphometry is envisaged for the future (Power et al., 2015; Evett and Cuthrell, 2016; Díez-Pastor et al., 2020; Berganzo-Besga et al., 2022; Andriopoulou et al., 2023), analysis of two-dimensional (2D) shapes by manually drawing outlines (Out et al., 2014; Ball et al., 2016b) is currently the most common method used for morphometric phytolith studies.
Despite the increased use of phytolith morphometry, two aspects have been overlooked: inter- observer variation, i.e. differences in measurements between different researchers; and intra-observer variation, i.e. differences in measurements made by the same researcher. This topic has been addressed in biological studies (e.g. Von Cramon-Taubadel et al., 2007; Kaufman and Rosenthal, 2009; Fruciano, 2016; Robinson and Terhune, 2017; Verheyen et al., 2018), 14C dating (e.g. Scott et al., 2022), and is also recognized, on a smaller scale, in archaeology (Fisch, 1978; Newcomer et al., 1986; Gobalet, 2001; Lyman and VanPool, 2009; Shahack-Gross, 2016; Skals et al., 2018; Timbrell et al., 2022). Although the issue of possible inter- and intra-observer variation affecting the accuracy and repeatability of morphometric studies is recognized in archaeobotany (Jacomet, 2013; Steiner et al., 2015, Evin et al., 2020, 2022; Antolin, 2022; Roushannafas et al., 2023) and phytolith analysis (Ball et al., 2016b, 2017; Evett and Cuthrell, 2016; Díez-Pastor et al., 2020; Out, 2020), this variation has not yet been studied systematically in phytolith morphometry.
The aim of this study was to investigate the magnitude of inter- and intra-observer variation in morphometric measurements of phytoliths derived from manually drawing masks (outlines). Are data collected from masks repeatable and comparable, both for individual researchers and among researchers, and is the variation that occurs relevant for accurate taxonomic attribution? To investigate these issues, phytolith specialists from different laboratories with varying degrees of experience with phytolith morphometry were enlisted to collect measurements of three different phytolith morphotypes three times. The outcomes were used to develop new, additional recommendations to standardize phytolith morphometry on behalf of the International Committee for Phytolith Morphometrics (ICPM).
MATERIALS AND METHODS
Experimental set-up
To investigate inter-observer variation, eight researchers collected morphometric measurements from 50 photographs each of phytoliths from three different morphotypes: Bilobate (including Cross and intermediate shapes), Bulliform flabellate (formerly cuneiform bulliform, hereafter called Bulliform) and Elongate dendritic (hereafter called Dendritic) (see Supplementary Data File S1 for further details. Related publications: Contreras et al., 2014; Dal Corso et al., 2017; Dal Corso, 2018; Out et al., 2021, 2022). Apart from the Bilobate photographs, all photographs were taken specifically for morphometric measurements.
To investigate intra-observer variation, all researchers repeated all measurements during three different weeks over a period of 2 months (Table 1). Measurements were collected using ImageJ 1.53k (Rasband, 1997–2018) and the macro PhytolithsBatch (Ball et al., 2016b; see Supplementary Data File S1 for details and Supplementary Data File S2 for the revised installation and troubleshooting guide). The software instructs the user to obtain a mask of a phytolith by manually tracing its outline from a photograph using a drawing tablet (Supplementary Data Fig. S1), from which the software automatically generates 18 commonly used metrics of size and shape (Table 2). Note that two of these metrics, Breadth and Width, provide identical results (Supplementary Data File S1).
Experimental set-up for each participant, showing the order in which morphotypes were measured and the order in which photographs were presented automatically by the software (except for researcher 3) during three measurement sessions occurring in different weeks.
| Week (repetition) | Batch order within each week | Photograph order within each batch |
|---|---|---|
| 1 | 50 Bilobate | Order 1 (1, 2, 3, …) |
| 1 | 50 Bulliform | Order 1 (1, 2, 3, …) |
| 1 | 50 Dendritic | Order 1 (1, 2, 3, …) |
| 2 | 50 Bulliform | Order 2 (32, 50, 17, …) |
| 2 | 50 Dendritic | Order 2 (35, 29, 26, …) |
| 2 | 50 Bilobate | Order 2 (30, 43, 6, …) |
| 3 | 50 Dendritic | Order 3 (39, 24, 30, …) |
| 3 | 50 Bilobate | Order 3 (6, 27, 46, …) |
| 3 | 50 Bulliform | Order 3 (23, 22, 31, …) |
Variables of phytolith size and shape generated by the macro PhytolithsBatch; descriptions after Ball et al. (2016b) and Out et al. (2014).
| Type | Variable | Description | Unit |
|---|---|---|---|
| Size | Area | The area inside the phytolith defined by the Perimeter | μm2 |
| Size | Convex area | Area within a taut string around the phytolith; area of the Convex hull polygon (= Area/Solidity) | μm2 |
| Size | Perimeter | The length of the phytolith boundary, calculated from the centres of the boundary pixels | μm |
| Size | Convex perimeter | Length of a taut string around the phytolith; Convex hull or Convex polygon calculated from pixel centres | μm |
| Size | Length (Feret) | Largest axis length = the longest distance between two points in the perimeter | μm |
| Size | Breadth | The largest axis perpendicular to the Feret (not necessarily colinear) | μm |
| Size | Fibre length | Length of the phytolith along its medial axis | μm |
| Size | Width | The minor dimension of the phytolith. Calculated as the diameter of the smallest hole through which it can pass. | μm |
| Size | Equivalent diameter (EquivD) | Diameter of a circle with the same area as the phytolith | μm |
| Size | Inscribed radius (MinR) | Radius of the largest circle that can be drawn in the phytolith | μm |
| Shape | Form factor (Circ) | 4 × Area/(π × Perimeter2); it is one for a perfect circle and diminishes for irregular shapes | – |
| Shape | Roundness | 4 × Area/(π × Length2), it is one for a perfect circle and diminishes with elongation of the phytolith | – |
| Shape | Convexity | Convex perimeter/Perimeter, it is one for a perfectly convex shape and diminishes if there are surface indentations | – |
| Shape | Solidity | Area/Convex area, it is one for a perfectly convex shape and diminishes if there are surface indentations | – |
| Shape | Compactness | Sqrt[(4/π) × Area]/Length or alternatively EquivD/Length | – |
| Shape | Aspect ratio | Length/Breadth | – |
| Shape | Elongation | Equals fibre length/width | – |
| Shape | Curl | Equals length/fibre length | – |
Training and instructions
While seven of the eight researchers had some experience with phytolith morphometry, only four had any experience collecting phytolith geometric morphometric measurements, drawing masks and/or using a drawing tablet and digital pen (Supplementary Data Table S1). To assure minimum competence, researchers were instructed to practise using the drawing tablet for 2 months before the start of the experiment; to familiarize themselves with the software; and to collect measurements from a training set of 20 Bilobate, 20 Bulliform and 20 Dendritic. To reduce observer differences further, researchers were instructed on: how to set the scale (zooming in was allowed); to set the scale (calibrate) at the beginning of every measurement session for each batch (n = 50 of a single morphotype) and to apply that same scale to all 50 photographs in that batch; to zoom in on the photographs a fixed number of times during the collection of the measurements: 2× for Bilobate, 1× for Bulliform and 0× for Dendritic; and to digitize the outer border of the phytoliths manually (by drawing the line on the border and not beside the phytolith).
Data cleaning
Measurement errors were removed from the initial data set to gain a better understanding of inter- and intra-observer variation. This was done by visual inspection of the generated masks, inspection of the box plots summarizing the measurements and analysis of the notes taken by each researcher during data collection. Adjustments that resulted in the final data set included the following (see also Supplementary Data Table S2):
removal of five photographs (of each morphotype and the same for each researcher and week) that introduced sources of variation other than inter- and intra-observer variation;
removal of a scale error that was introduced in the experiment unintentionally;
correction of outliers that could be discerned visually within single batches of 50 phytoliths, which occurred particularly among data generated by inexperienced researchers (it was assumed that such errors can also be recognized during data cleaning in real morphometric studies); and
correction of a major scaling error affecting Dendritic collected during two weeks by researcher 7. This error affected two complete batches, which would have made the error relatively difficult to detect if comparison with data from other researchers had not been possible. Although the error was not ignored, it was corrected because it was so large that it hampered the understanding of more subtle inter- and intra-observer differences among all morphotypes.
Statistical analysis
To investigate the magnitude of inter- and intra-observer effects on the measured variables, the statistical analysis defined various models that describe the data. A first mixed model (Pinheiro and Bates, 2000) calculated factor-specific variances. Photograph, nested in Type, was considered as a fixed factor (i.e. expected to cause fixed differences). Observer (researcher), Week (repetition) and Batch were regarded as random factors (i.e. random variation). The observer effect is interpreted as inter-observer variance, the week effect as intra-observer variance, and the batch effect represents the interaction of week and (morpho)type (e.g. Bilobate in week 1), an additional variance caused by the study design. Based on the first model, a pseudo R2 was calculated (Nakagawa and Schielzeth, 2013) to understand the proportion of the variance that can be explained by the influence factors of the model, i.e. how well the model fits the data.
A second mixed model was used to calculate observer- and week-specific means. This model included Week, Type and Observer, in addition to all their interaction terms (2-fold and 3-fold) as fixed factors. Photo was regarded as a random factor or repetition. Based on a graphical residual analysis, the residuals of the two models were assumed to be normally distributed and, for the second model, heteroscedastic with respect to the factor Type (Carroll and Ruppert, 1988). Based on the second model, an ANOVA was conducted, followed by multiple contrast tests (Hothorn et al., 2008; see also Bretz et al., 2011) to compare the several levels of Observer and Week to gain a better understanding of the inter- and the intra-observer effect. Here, the significance of pairwise differences was not considered essential, because this depends on the sample size (Middlemis Maher et al., 2013), which was rather large in this study (resulting in significant differences based on dissimilarities of <1 %). Instead, the focus was on the difference from the overall mean (see also Nakagawa and Cuthill, 2007). A difference of >5 % was considered meaningful and relevant. This number is arbitrary, selected to ignore minor variation while at the same time intentionally kept to a minimum to enable development of robust morphometric data-collection standards. Model development and subsequent statistical analyses were carried out using the statistical software R (R Core Team, 2023; for the code, see Out et al., 2024).
RESULTS
Figures 1 and 2 and Supplementary Data Table S3 and Fig. S2 summarize the measurements. The raw data are presented by Out et al. (2024). As explained in the ‘Data cleaning’ subsection of the Materials and Methods, the data set has been corrected for a calibration error affecting the Dendritic collected during two weeks by researcher 7, resulting in values multiplied by ~ 250×, and for smaller irregularities that were recognizable within batches of 50 photographs of a single morphotype from individual researchers.
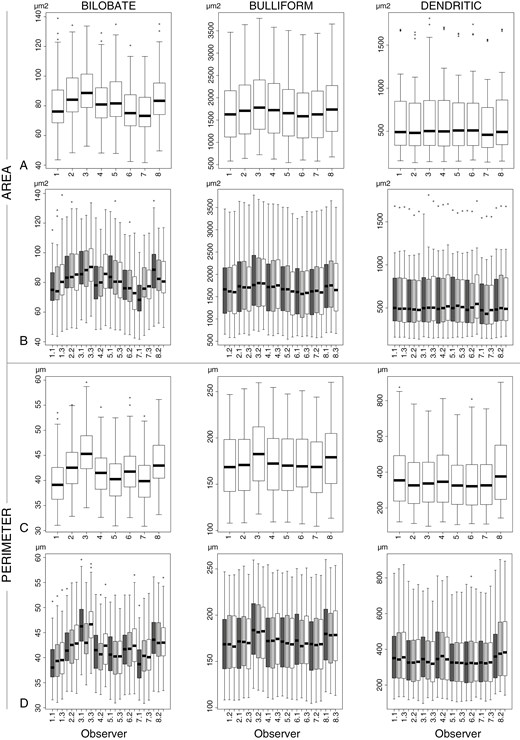
Measurements of the size variables Area and Perimeter for Bilobate, Bulliform and Dendritic. (A, B) Area. (C, D) Perimeter. (A, C) Sorted by observer and type. (B, D) Sorted by observer, week and type. Symbols: Ο = outlier, >1.5× and <3× interquartile range.
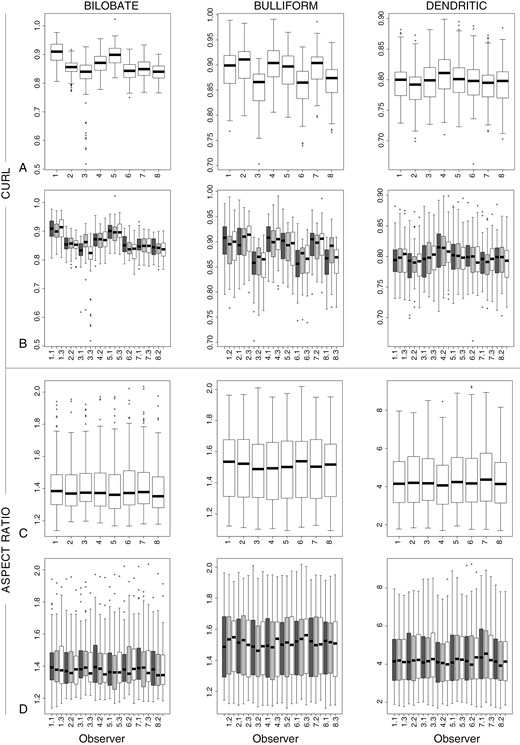
Measurements of the shape variables Curl and Aspect ratio for Bilobate, Bulliform and Dendritic. (A, B) Curl. (C, D) Aspect ratio. (A, C) Sorted by observer and type. (B, D) Sorted by observer, week and type. Symbols: Ο = outlier, >1.5× and <3× interquartile range.
Factor-specific variances
Model 1 described the standard deviation (s.d.) corresponding to the random factors Observer (researcher, reflecting inter-observer variation), Week (repetition, reflecting intra-observer variation) and Batch (the interaction between week and type), in addition to the residual error and pseudo R2 (Supplementary Data Table S3A). The s.d. of the various variables explained by Observer ranged from 0 to 39.8, by Week from 0 to 0.6 and by Batch from 0 to 7.4, and the residual error ranged from 0 to 60.9 (unit of measurement, depending on the variable: –/μm/μm2). The s.d. of size variables was larger than that of shape variables. The s.d.s of the variables with relatively high values, such as Convex area and Area, were largest, while those of all shape variables, many of which have low values between zero and one, were <0.007. Although differences were small, the residual error was always larger than the s.d. of the investigated factors, indicating that factors other than those analysed were the main source of variation. Importantly, this implies that the observers were not the main cause of variance. The pseudo R2 values indicated that ≤1.5 % of the variance of the size variables could not be explained by the modelled influence factors, with the exception of Curl (influenced by Fibre length; see Table 2), where 21 % of the variance was not explained by the model. The latter can probably be explained by strongly deviating values of Fibre length, affecting Elongation and Curl, of nine Bilobate in week 3 by researcher 3.
Analysis of variance
The ANOVA, based on model 2, tested the effects of Observer, Week, Type (morphotype), and the interactions Batch (Week:Type), Week:Observer, Type:Observer and Week:Type:Observer. With one exception, the interaction effect of all factors was significant for all variables (Supplementary Data Table S3B), implying that the effects of Observer, Week and Type depended significantly on each other.
Inter-observer variation
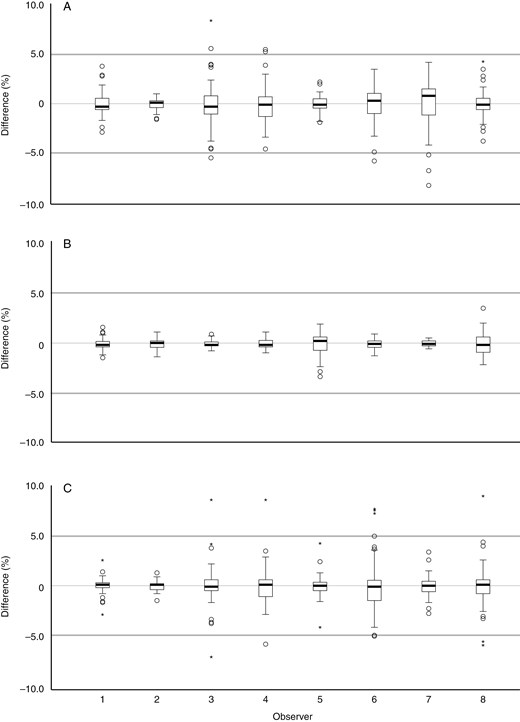
The measurements for all weeks combined, based on model 2, enabled examination of the inter-observer variation. The P-values of most observers, morphotypes and variables indicated significant differences for each observer from the mean of all observers. The Bilobate measurements differed by ±0–10 % per observer and variable from the overall mean of all observers (mean difference per variable for all observers together max. ±5 %), the Bulliform measurements differed by ±0–7 % (mean difference per variable max. ±3.5 %), and Dendritic measurements differed by ±0–23 % (mean difference per variable max. ±10 %) (Fig. 3; Supplementary Data Table S3C). The highest value of 23% was measured by one researcher for one variable during a single week.

Inter-observer variation, difference from the mean per observer for all variables and weeks together: (A) Bilobate; (B) Bulliform; and (C) Dendritic. Symbols: Ο = outlier, >1.5× and <3× interquartile range; * = extreme outlier, >3× interquartile range. Outlying values represent a mean of one variable and one participant for 1 week.
All researchers generated measurements >5 % different from the mean for at least one morphotype and two variables. Researchers 3, 6 and 7, all of whom were inexperienced with applying the ImageJ macro PhytolithsBatch, produced measurements that most often differed maximally from the mean.
For Bilobate and Bulliform, mostly size variables differed by >5 % from the mean (Area, Convex area, Perimeter and Fibre length), but also the shape variable Form factor (Supplementary Data Table S3C; Fig. S3). For Dendritic, various size variables differed by >5 % (Area, Convex area, Perimeter, Breadth and Inscribed radius), as did multiple shape variables (Roundness, Convexity and Solidity).
Intra-observer variation
The measurements per week, type and observer based on model 2 enabled an examination of intra-observer variation. The P-values indicated significant differences for each observer for variables for at least two morphotypes. Intra-observer differences of >5 % different from the mean occurred substantially less than inter-observer differences (Fig. 4; Supplementary Data Table S3D; Fig. S4). The Bilobate measurements per week and observer differed by ±0–8 % from the overall mean of all weeks (mean difference per variable max. ±3 %), the Bulliform measurements differed by ±0–4 % (mean difference per variable max. ±1 %), and the Dendritic measurements differed by ±0–9 % (mean difference per variable max. ±3 %).
Intra-observer variation (based on data per week), difference from the mean per observer for all variables together: (A) Bilobate; (B) Bulliform; and (C) Dendritic. Symbols: Ο = outlier, >1.5× and <3× interquartile range; * = extreme outlier, >3× interquartile range.
Differences of >5 % from the mean were generated by researchers 3, 4, 6, 7 and 8. Apart from researcher 8, these researchers were inexperienced. Several researchers generated measurements >5 % different from the mean for more than one morphotype and for more than one week.
For Bilobate, variables differing by >5 % from the mean were mostly size variables (Area, Convex area, Fibre length and Inscribed radius) along with the shape variable Form factor. For Dendritic, variables of both size (Area and Perimeter) and shape (Form factor, Roundness and Solidity) differed by >5 % from the mean.
Figure 5 shows the scale differences that arose during the calibration process. The researchers were instructed to calibrate once per batch (i.e. once per 50 phytoliths of a particular morphotype that were ideally drawn in one session). Almost every researcher did this once per batch, sometimes more often owing to interruptions and corrections. Researcher 7 always applied the same scale per morphotype, thus reducing intra-observer differences, apart from the initial large scaling error for Dendritic reported in the section ‘Data cleaning’ in the Materials and Methods. The maximum difference between and among observers was 0.4, 0.125 and 0.525 pixels/μm for Bilobate, Bulliform and Dendritic, respectively. For all three morphotypes, some observers applied scales with no overlap with scales applied by some of the other observers, indicating that calibration was a major cause of inter-observer variation. The wide scale range, for observers 3 and 4 in particular, indicates that scaling also affected intra-observer variation.

Scale (in pixels per micrometre) applied during data collection of the corrected data set: (A) Bilobate; (B) Bulliform; (C) Dendritic, and the original scale for Dendritic of participant 7. This figure is based on the extremes per batch and observer (the value most different from the mean). Absolute scale differences between the morphotypes relate to morphotype size and photograph characteristics.
Supplementary Data Videos S1–S5 show the variation induced by drawing the phytolith. With a few exceptions, the variation was relatively small for Bilobate and Bulliform, which have simple shapes that are relatively easy to draw, and larger for the more complex Dendritic.
Phytolith size affected the intra-observer variance of size variables and certain shape variables (Supplementary Data Figure S2A–D). For example, large Dendritic showed more intra-observer variation than small Dendritic.
DISCUSSION
The comparison of phytolith morphometric measurements collected three times from 50 photographs of three different morphotypes by eight researchers shows that, as in any experiment including multiple researchers and repetitions, there is both inter- and intra-observer variation. The following questions arising from this study will be discussed:
(i) How large is the variance and how do inter- and intra-observer variation relate to each other?
(ii) How much inter- and intra-observer variation is acceptable, and which variables are most relevant?
(iii) What are the causes of inter- and intra-observer variation in phytolith morphometry and how can they be reduced?
As one of the outcomes, the ICPM provides new, additional recommendations towards the standardization of phytolith morphometry.
How large is the variance and how do inter- and intra-observer variation relate to each other?
The size effect of inter- and intra-observer variation varies between morphotypes and variables examined. Inter-observer differences reached values of up to 10, 7 and 23 % difference from the overall mean of all observers for Bilobate, Bulliform and Dendritic, respectively. In comparison, intra-observer differences reached values of up to 8, 4 and 9 % difference from the overall mean of all weeks for the three morphotypes. Because the maximum inter-observer variation was larger than the maximum intra-observer variation for each morphotype, it is relevant to keep the number of researchers involved in a single study limited when possible. When multiple researchers are involved, observer-related variation might be reduced by group training sessions, close cooperation (using standardized protocols) and following the guidelines provided below in the subsection ‘What are the causes are the causes of inter- and intra-observer variation in phytolith morphometry, and how can the variation be reduced?’ The outcome also implies that when multiple researchers are involved in data collection of multiple taxa, all researchers should collect some morphometric data from all taxa to avoid inter-observer variation that could result in false taxonomic differences.
For Bilobate and Bulliform, inter-observer variation is relatively small for some shape variables (Solidity, Compactness and Aspect ratio) and larger for size variables (see Supplementary Data Fig. S3). For Dendritic, some size variables show remarkably little variation, whereas there is more variation in shape variables (including Solidity; see Supplementary Data Fig. S3). However, instead of choosing variables to distinguish taxa based on low inter- and intra-observer variation, it is recommended to choose diagnostic variables based on existing attribution criteria (identification criteria) and/or morphometric analysis of reference collections (see next subsection).
How much inter- and intra-observer variation is acceptable, and which variables are most relevant?
Given that some inter- and intra-observer variation in phytolith morphometry is unavoidable, how much difference is acceptable? The amount of acceptable variation is highly dependent on the similarity in size and shape of morphotypes from the taxa being studied: the larger the overlap in size and shape between phytoliths of different taxa, the more observer variation might affect the resulting taxonomic attribution. Taxonomic differentiation can be accomplished e.g. by comparing measurements of single variables and by using discriminant functions that are generated by discriminant analysis of multiple variables measured from reference material (e.g. Zhao et al., 1998; Burns and Burns, 2009; Smith, 2014). An advantage of discriminant functions is that they describe the magnitude of differences between taxa, the percentage of phytoliths correctly attributed to each taxon in a training set, and which variables are most diagnostic. In the case of closely related taxa whose phytoliths are distinguishable only by using geometric morphometrics, classification based on multivariate analysis is usually required in order to obtain a correct attribution of more phytoliths.
Studies of Bilobate in millets, including sorghum, Dendritic in wheat, barley and oat, and Bulliform in rice show that there is considerable overlap between morphometric variables of taxa, indicating that a relatively low threshold for inter- and intra-observer variation is appropriate (Portillo et al., 2009; Gu et al., 2013; Out and Madella, 2017a). Therefore, we recommend permitting a maximum of 5 % variation of a variable from the mean.
For Bilobate, discriminant functions that distinguish between four millets indicate that many different variables are required for optimal taxonomic attribution (Out and Madella, 2016, 2017a, b). Direct comparison of data from that study (ibid.) with this one is not possible because of differences in software (different ImageJ plugins resulted in partially different variables). Nevertheless, the overlap between taxa indicates that increasing observer variation would increase the chances of incorrect attribution. For Dendritic, the variable Largest width has been suggested as diagnostic (Ball et al., 1999; applied by Out et al., 2016), but the significance of additional variables is unknown because no discriminant functions were provided. Observer variation of 5 % of the Width of C3 Dendritic would probably not affect their attribution, because this variation is relatively small in comparison to overlap between taxa. However, observer variation of 20 % would be problematic, because this is as large as the maximum overlap between taxa and could result in much higher incorrect attribution. Morphometric studies of Bulliform in the literature have been based on simple measurements and ratios, with varying degrees of success in taxa differentiation. Including more complex size and shape variables using the protocol of this study might improve the utility of Bulliform for taxonomic attribution purposes.
What are the causes of inter- and intra-observer variation in phytolith morphometry, and how can the variation be reduced?
Given that this experiment showed that inter- and, to a lesser degree, intra-observer variation in phytolith morphometry of >5 % occurred, we need to understand the causes of the variation to ensure that phytolith morphometry will be even more useful in the future.
Variation caused by calibration
A major source of inter- and intra-observer variation in this study occurred during calibration (i.e. setting the scale). Errors affecting more than a single measurement per batch came mostly from inexperienced researchers, suggesting that further training with morphometry procedures and the analysis software can reduce the variation. Large errors sometimes occurred when researchers remeasured photographs, which interrupted the standard workflow and possibly resulted in the application of the scale for one morphotype to another type. When affecting only part of a data set, large errors are easily recognized during data inspection. Scale errors for complete data sets can still be detected by critical assessment and comparison with values reported in the literature.
To minimize both inter- and intra-observer variation caused by calibration, the ICPM recommends to:
standardize the microscope magnification during photograph collection in individual studies or analyse photographs taken with different magnifications separately;
zoom in when calibrating, assuring maximal precision;
write down the scale (pixels per micrometre) applied during the first session of a study and always use precisely the same scale afterwards within a single study by fixing the scale before each digitizing session using the software settings (Supplementary Data File S2);
insert scale bars without side bars into photographs, thus avoiding confusion regarding whether one or both of these side bars should be included (if there are two side bars, only one side bar should be included during calibration);
optionally for experienced researchers, write an ImageJ script that automatically applies a specific scale to all photographs (cf. Out et al., 2014, unpublished data);
visualize results in boxplots to look for and understand outliers;
check whether measurements obtained are realistic; and
publish masks used to obtain morphometric data from reference collections in order that these can be remeasured by other scholars within the framework of new morphometric studies, thus reducing inter-observer scale differences that could affect attribution criteria.
Variation caused by data collection
A second major cause of variation stemmed from data collection, including photograph quality, the validity of masks and measurements, and mask and measurement precision. Photograph quality, although not quantified in this study, can have a strong effect. For example, Bilobate in this study, in contrast to the two other morphotypes, were photographed for publication purposes rather than morphometry, leading to less clarity of phytolith borders. Bilobate specifically photographed for morphometric studies (using the same microscope and camera settings) would generate less inter- and intra-observer variation. In addition, variation was particularly high for some Bulliform photographs with unclear phytolith borders; these were eventually excluded from the analysed data set.
The validity of masks and resulting measurements can be checked by examining all generated masks (binary images) and discarding measurements of white masks and of black masks with white dots or lines inside. Generating boxplots and checking for outliers might help to detect invalid masks and measurements.
Mask and measurement precision depends on morphotype complexity and, possibly, on observer experience. Bilobate and Bulliform are relatively simple shapes, whereas Dendritic are much more complex shapes. Morphotype complexity affects the digitization process because the software requires drawing a single, uninterrupted line to draw a mask. There is no simple option to correct for minor mistakes (other than redoing the complete outline), which can lead to errors owing to tiredness or impatience and might adversely affect measurements of more complex shapes. Finally, it is impossible to capture the 3D shape of phytoliths precisely, especially for more complex morphotypes, such as Dendritic, in two dimensions.
The ICPM recommendations to minimize differences caused by data collection are as follows:
know the 3D morphotype shape in advance;
gain substantial training and experience with photograph collection and drawing masks before data collection;
define which aspects of a morphotype are being measured precisely (e.g. orientation, abaxial/adaxial/random surface) when presenting attribution criteria and which are not;
collect high-quality photographs that most accurately portray the phytolith aspect being measured and collect the photographs in a consistent way, because the focus applied during photograph collection defines where the border of the phytolith will be drawn during measurement collection;
check the collected masks for irregularities;
explore and understand the collected data and outliers, e.g. by creating boxplots;
Use standardised software and work with standardized variables;
always share raw data and outlines (masks) of morphometric studies to facilitate future comparison of data and the possible role of variation caused by software, variables and observers; and
improve the software PhytolithsBatch to include options to redo part of a drawing without redoing the complete mask (cf. Out et al., 2014), include automatic detection of a closed shape when drawing outlines and avoid unintended workflow cancellation.
Automatic data collection might improve measurement precision in the future. However, for both manual and automatic data collection, standardization of software and variables will remain important to avoid inter-observer variation and to assure comparability of studies performed by various research groups.
Experience
Researcher experience also affected inter- and intra-observer variation in this study. Both large scaling errors found and removed from the final data set, including the unintentionally introduced experimental scale error, and a substantial part of the remaining inter- and intra-observer differences were generated by inexperienced researchers (for details, see Results). Also, part of the intra-observer variation in scale was related to experience. Training on using the software, calibration, drawing masks and thoroughly understanding all aspects of data collection and data cleaning will most probably reduce inter- and intra-observer differences substantially. Before embarking on a new morphometric study, the ICPM recommends that both inexperienced and experienced researchers train with data collection (for images that can be used for training, see Out et al., 2024) while closely following the guidelines presented above, and practise until consistency is achieved.
CONCLUSIONS
As phytolith studies in archaeology, palaeobotany and palaeoecology have proliferated, researchers have recognized the need to standardize data collection to enable comparison of research outcomes. Recent progress in this direction includes the uniform classification of morphotypes (Madella et al., 2005; ICPT, 2019) and the development of open-source software to collect morphometric data (Out et al., 2014; Ball et al., 2016b). This study conducted by members from the International Committee for Phytolith Morphometrics offers a new perspective by focusing on the analysis of inter- and intra-observer variation in phytolith morphometry. The results of this study are relevant for phytolith analysis in archaeology and palaeoecology and for any other biological field that uses morphometry.
The controlled experiment on inter- and intra-observer variation in phytolith morphometry presented in this study shows that although variation is unavoidable and that substantial variation occurred, there is considerably more variation in data collected by inexperienced compared with experienced researchers. This last aspect is positive, because training, standardization of calibration, data visualization, data cleaning and thoroughly understanding the process of data collection and interpretation can reduce this source of variation relatively easily. Collection of comparable and consistent data is thus a manageable goal. Moreover, in order to reduce inter- and intra-observer variation in phytolith morphometry, this paper provides recommendations and standard procedures, which enable direct comparison of data collected by researchers and laboratories worldwide. A revised installation and troubleshooting guide for the existing phytolith morphometry software is also provided. If researchers adhere to these new ICPM protocols, phytolith morphometry using PhytolithsBatch will be an even more useful research method.
To make the identification criteria of major economic plants available and applicable for all phytolith researchers, suggestions for future studies involving phytolith morphometry other than the presented recommendations are as follows: (i) the application of discriminant analysis to already collected morphometric data and/or renewed collection of phytolith morphometric data for taxa with no discriminant functions yet available, particularly cereals and other major economic plants; (ii) to investigate the role of inter- and intra-observer variation among other phytolith morphometry methods; and (iii) additional methodological studies on automatic data collection and 3D analysis in phytolith morphometry, which will undoubtedly lead to future modification of the ICPM protocols presented above, are merited. Automatic data collection might overcome some of the major causes of inter- and intra-observer variation, such as the variation caused by data collection, although others, such as photograph quality, the choice between 2D and 3D analysis and the use of uniform software and variables might remain. Importantly, availability of tools at little to no cost, as is the case in this study, is an important factor to achieve the ICPM goal of facilitating the application and standardization of phytolith morphometry by researchers worldwide.
SUPPLEMENTARY DATA
Supplementary data are available at Annals of Botany online and consist of the following.
Data File S1: materials and methods, further details. Data File S2: revised installation instructions and troubleshooting information for ImageJ and PhytolithsBatch. Figure S1: Screenshots of a selection of steps of the macro PhytolithsBatch (photographs by J. Ruiz-Pérez). Figure S2: measurements of size variables Area and Perimeter and shape variables Curl and Aspect Ratio for Bilobate, Bulliform and Dendritic. Figure S3: inter-observer variation, difference from the mean per variable, for all observers and weeks together: (A) Bilobate; (B) Bulliform; and (C) Dendritic. Figure S4: intra-observer variation (based on data per week), difference from the mean per variable, for all observers together: (A) Bilobate; (B) Bulliform; and (C) Dendritic. Table S1: researcher experience with morphometry of phytoliths and other microfossils. Table S2: adjustments made to the data set. n = number. Table S3A: the standard deviation per factor, the residual error and the pseudo R2 for each variable. Table S3B: the P-values of the ANOVA testing the effect of Week (repetition), Type (morphotype), Observer and the interactions Batch (Week:Type), Week:Observer, Type:Observer and Week:Type:Observer on the measured values. Table S3C: absolute value, relative difference and statistical significance per observer and morphotype, presented per variable as well as mean of all photos,observers and weeks per morphotype. Table S3D: absolute value, relative difference and statistical significance per week, morphotype and observer, presented per variable as well as mean of all weeks per observer and morphotype.
Video S1: compilation of 8 × 3 masks of a Bilobate (masks from eight researchers and three repetitions). Video S2: compilation of 8 × 3 masks of a Bulliform that showed relatively little variation. Video S3: compilation of 8 × 3 masks of a Bulliform that showed relatively greater variation, illustrating the importance of clear photographs and border concepts. Video S4: compilation of 8 × 3 masks of a Dendritic that showed relatively little variation. Video S5: compilation of 8 × 3 masks of a Dendritic that showed relatively greater variation.
AUTHOR CONTRIBUTIONS
W.O.: conceptualization, funding acquisition, methodology, project administration, resources, visualization, investigation, formal analysis, writing—original draft, writing—review and editing. R.E.: funding acquisition, conceptualization, resources, investigation, writing—review and editing. K.H.: conceptualization, resources, investigation, writing—review and editing. R.C.P.: conceptualization, resources, investigation, writing—review and editing. J.R.-P.: conceptualization, resources, visualization, investigation, formal analysis, writing—review and editing. M.T.: conceptualization, resources, investigation, writing—review and editing. L.V.: conceptualization, resources, visualization, investigation, writing—review and editing. K.W.: conceptualization, resources, investigation, writing—review and editing. M.H.: conceptualization, methodology, software, validation, data curation, visualization, formal analysis, writing—original draft, writing—review and editing.
FUNDING
W.O. received financial support from the Hugo de Vries fund, The Netherlands (HDVF2021-09) and Moesgaard Museum.
ACKNOWLEDGEMENTS
The authors are very grateful to the Hugo de Vries fund, The Netherlands, for financial support (HDVF2021-09), Moesgaard Museum for financial support, A. Jesus for discussion, M. Portillo, K. Neumann and M. Madella for their support in the fund-raising stage, M. Langeveld and T. A. Out for discussing the experimental set-up, M. Dal Corso for providing images of Bulliform phytoliths, A. Schenkel for help with software installation (one observer), Urban Brussels to allow L.V. to participate in the study, the Graphics Department of Moesgaard Museum for help with the illustrations and the reviewers for kind and constructive comments.
