


Abstract
Plant genomes contain many retrotransposons and their derivatives, which are subject to rapid sequence turnover. As non-autonomous retrotransposons do not encode any proteins, they experience reduced selective constraints leading to their diversification into multiple families, usually limited to a few closely related species. In contrast, the non-coding Cassandra terminal repeat retrotransposons in miniature (TRIMs) are widespread in many plants. Their hallmark is a conserved 5S rDNA-derived promoter in their long terminal repeats (LTRs). As sugar beet (Beta vulgaris) has a well-described LTR retrotransposon landscape, we aim to characterize TRIMs in beet and related genomes.
We identified Cassandra retrotransposons in the sugar beet reference genome and characterized their structural relationships. Genomic organization, chromosomal localization, and distribution of Cassandra-TRIMs across the Amaranthaceae were verified by Southern and fluorescent in situ hybridization.
All 638 Cassandra sequences in the sugar beet genome contain conserved LTRs and thus constitute a single family. Nevertheless, variable internal regions required a subdivision into two Cassandra subfamilies within B. vulgaris. The related Chenopodium quinoa harbours a third subfamily. These subfamilies vary in their distribution within Amaranthaceae genomes, their insertion times and the degree of silencing by small RNAs. Cassandra retrotransposons gave rise to many structural variants, such as solo LTRs or tandemly arranged Cassandra retrotransposons. These Cassandra derivatives point to an interplay of template switch and recombination processes – mechanisms that likely caused Cassandra’s subfamily formation and diversification.
We traced the evolution of Cassandra in the Amaranthaceae and detected a considerable variability within the short internal regions, whereas the LTRs are strongly conserved in sequence and length. Presumably these hallmarks make Cassandra a prime target for unequal recombination, resulting in the observed structural diversity, an example of the impact of LTR-mediated evolutionary mechanisms on the host genome.
INTRODUCTION
Long terminal repeat (LTR) retrotransposons make up the predominant fraction of plant genomes. Their copy-and-paste transposition allows their proliferation within the genome, resulting in large genome size differences even between related species (reviewed in Bourque et al., 2018). The gene products for amplification and transposition of LTR retrotransposons are encoded by the gag and pol open reading frames (ORFs) located between the LTRs. Based on the order of the functional domains of these ORFs, LTR retrotransposons are classified as either Ty1-copia or Ty3-gypsy elements (Kumar and Bennetzen, 1999; Hull, 2001). Canonical LTR retrotransposons carry their essential transcriptional signals within the LTRs and rely on RNA polymerase II (pol II) transcription (Bowen, 2003; Havecker et al., 2004; Schulman, 2013).
Nevertheless, absence of the coding domains does not necessarily lead to retrotransposon inactivation. Autonomous LTR retrotransposons are the source of a variety of non-autonomous derivatives, e.g. terminal-repeat retrotransposons in miniature (TRIMs; Witte et al., 2001; Antonius-Klemola et al., 2006; Yang et al., 2007), large retrotransposon derivatives (LARDs; Kalendar et al., 2004) and terminal-repeat retrotransposons with a GAG domain (TR-GAGs; Chaparro et al., 2015). These retrotransposons lack all (TRIMs, LARDs) or parts (TR-GAGs) of their coding capacity. Large conserved non-coding DNA stretches (often >4 kb) replace the gag-pol ORF in LARD retrotransposons, whereas TRIM elements usually contain very short internal regions (Wicker et al., 2007; Yin et al., 2015). Despite their lack of coding capacity, TRIMs retain the structural hallmarks of an LTR retrotransposon, such as the LTR sequences, a primer binding site (PBS), and the polypurine tract (PPT) for strand synthesis. In addition, the flanking 5-bp target site duplications (TSDs) demonstrate their capability for genuine integration (Witte et al., 2001; Wicker et al., 2007). Non-coding retrotransposons are usually highly variable even between related plant genomes, with only narrow family distribution patterns (Seibt et al., 2020).
In contrast, a special group of TRIMs, the Cassandra retrotransposon family, is unusually widespread across various angiosperms (Kalendar et al., 2008; Gao et al., 2016). As Cassandra was already observed in monocots, eudicots and ferns (Antonius-Klemola et al., 2006; Kalendar et al., 2008; Yin et al., 2014; Gao et al., 2016), this family is assumed to be ancient. The main feature of the Cassandra retrotransposons is the 5S RNA promoter for RNA polymerase III (pol III) residing in the highly conserved LTR. Thus, Cassandra retrotransposons are independent of canonical pol II transcription (Kalendar et al., 2008). Due to the generally short overall length (variable between 560 and 860 bp), the Cassandra LTR contributes to more than two thirds of the total retrotransposon length (2 * 240–350 bp) (Kalendar et al., 2008). Cassandra TRIMs vary in abundance, ranging from low (9) to moderate (130) copy numbers of full-length elements in some Brassica and Rosaceae species and rice (Kalendar et al., 2008; Sampath and Yang, 2014; Yin et al., 2014), and even reach >1000 full-length copies in woodland strawberry (Yin et al., 2014).
Due to the high number of similar copies, LTR retrotransposons are often involved in genome restructuring, recombination and re-shuffling (Ma et al., 2004; Vitte and Bennetzen, 2006; Wollrab et al., 2012). Unequal homologous recombination may occur within one full-length element (intra-element) or between two different copies (inter-element), leading to the formation of solo LTRs or tandemly arranged sequences with more than two LTRs (Devos et al., 2002). Chimeric full-length copies originate from co-packing of different LTR retrotransposons during reverse transcription, thus contributing to the vast genetic variability of LTR retrotransposons (Sanchez et al., 2017; Drost and Sanchez, 2019). Whether the short Cassandra retrotransposons with the relatively long, conserved LTRs are exceptionally favoured for recombination is not yet clear.
The Amaranthaceae plant family within the Caryophyllales harbours various crops, some with genome sequences available, such as sugar beet (RefBeet1.2; Dohm et al., 2014), spinach (Spinacia oleracea; Xu et al., 2017) and quinoa (Chenopodium quinoa; Yasui et al., 2016; Jarvis et al., 2017). Sugar beet plays a vital role in agriculture, with beet as the sole source of sugar in temperate climates. Sugar beet’s genome size ranges between 731 and 758 Mb, as estimated by flow cytometry and kmer analyses (Arumuganathan and Earle, 1991; Dohm et al., 2014). As in most reference genomes of non-model organisms (Peona et al., 2018), the published beet assembly comprises only 567 Mb (Dohm et al., 2014), indicating an under-representation of repetitive regions. Nevertheless, the repeat content of the beet genome is already well known, with detailed explorations of tandem repeats, retrotransposons and DNA transposons available (Zakrzewski et al., 2010; Weber et al., 2010, 2013; Menzel et al., 2012; Wollrab et al., 2012; Heitkam et al., 2014; Schwichtenberg et al., 2016). Therefore, it provides optimal prerequisites for the study of the more elusive non-autonomous LTR retrotransposons.
In this study, we survey the Cassandra landscape in the B. vulgaris genome and investigate its structure and organization. Using molecular approaches and comparative high-throughput read analyses, we quantify the distribution of Cassandra in related species to trace their evolutionary history. Based on internal sequence regions, we subdivided Cassandra TRIMs into subfamilies and discuss possible scenarios for their evolution. We argue that the strong conservation of the LTR and the variability of the internal region leads to structural variation, detectable as tandem arrangements and solo LTRs. Therefore, the Cassandra retrotransposon landscape is marked on the one hand by the strongly preserved LTRs and on the other hand by restructuring through a wide variety of recombination processes.
MATERIALS AND METHODS
Identification of Cassandra retrotransposons
Initial identification of Cassandra elements in Beta vulgaris was performed via BLASTn (BLAST+ ver. 2.3.0; Camacho et al., 2009) against the recent B. vulgaris genome assembly (RefBeet1.2; Dohm et al., 2014) with wordsize 11, gap-opening/extension scores of 5/2 and match/mismatch scorings of 2/−3. We used multiple query sequences in a single BLAST search with exemplary plant Cassandra sequences from Lotus japonicus (AY603364.1), Medicago truncatula (AY603369.1), Brassica oleracea (AY860307.1), Arabidopsis thaliana (AY923749.1), Pisum sativum (DQ788719.1) and Silene latifolia (KC686837.1) as queries, which led to a potential sugar beet Cassandra candidate. This candidate sequence was iteratively refined by BLASTn against the sugar beet assembly and subsequent multiple sequence alignment with MUSCLE (Edgar, 2004) to generate a more representative reference Cassandra sequence. To estimate copy number and abundance of the Ama_Cassandra family, the reference Ama_Cassandra sequence was used as a custom library to screen the assembled genome (RefBeet1.2; Dohm et al., 2014) of B. vulgaris using RepeatMasker (ver. 4.0.6; Smit et al., 2013) with default parameters and the ‘nolow’ option. The annotated sequences were extracted, manually inspected by displaying self-comparison dotplots, and assigned to structural groups. The assignment was based on various features, such as the presence/absence of the conserved 5S rDNA motif, complete LTRs with conserved terminal inverted repeats (TIRs), and the number of LTRs: Cassandra sequences with deletions of >5 % of the (average) full-length but conserved 5 LTR start and 3′ LTR end termini or LTR insertions are classified as indel sequences; deletions regarding truncation or complete loss of LTR sequences, either 5′ or 3′ or both, are grouped as truncated elements. All single LTR sequences with conserved length, termini and 5S rDNA regions were classified as solo LTRs. Cassandra elements with additional LTR and internal sequences are grouped as tandemly arranged elements. Target site duplications were detected separately for all identified copies and structural variants by checking the flanking regions manually (one mismatch allowed). Identification of Cassandra retrotransposons in published genome assemblies of the distant relatives S. oleracea and C. quinoa was performed using RepeatMasker (default options) with the representative Ama_Cassandra sequence as custom search query.
RepeatMasker output sequences were manually edited to exclude remnant sequences, which are usually <200 bp in length and characterized either as truncated solo LTRs, LTR fragments or short RepeatMasker artefacts of genomic 5S rDNA. The output was processed for visualization on pseudochromosomes in MapChart (Voorrips, 2002). Mapping was computed using start and stop positions of Cassandra copies on anchored scaffolds (reference B. vulgaris assembly RefBeet1.2). Length differences of Cassandra copies are comprehensible due to their line width.
In order to find a possible autonomous partner of Cassandra TRIMs in sugar beet, nucleotide hidden Markov models (nHMMs) were created from (1) the alignment of all full-length Cassandra LTR sequences and (2) manually curated alignments from Ty1/copia and Ty3/gypsy reverse transcriptases. Similar to our search for SINE/LINE partnerships (Seibt et al., 2020), Cassandra-derived sequences and RT candidates were annotated using nhmmer (Wheeler and Eddy, 2013) and filtered according to distance of RT motifs and nearby Cassandra sequences.
To verify that the tandemly arranged copies were an artefact from a potentially erroneous assembly, we scanned long single-molecule real-time (SMRT) reads (PacBio, 1.5× coverage; GenBank accession number SRX3402137) for their presence. For this, we also used the custom nHMMs of the Cassandra LTR and searched the long reads with nhmmer (Wheeler and Eddy, 2013) with default settings. Reads producing more than three LTR hits were extracted and dotplots were generated with FlexiDot (Seibt et al., 2018) with wordsize of 9. Manual inspection of the dotplots served to identify longer putative tandemly arranged Cassandra members.
Sequence comparison and visualization by dotplots and dendrograms
In order to compare multiple Cassandra sequences, we calculated alignments, dotplots and comparative dendrograms. For pairwise and self dotplots, we used the internal dotplot tool of Geneious with high sensitivity settings, wordsize 5 and threshold 22 (Kearse et al., 2012). For all-against-all dotplot comparisons, we used FlexiDot (Seibt et al., 2018) with a wordsize of 20 allowing six mismatches, automated shading according to the longest common subsequence, and annotation of the 5S promoter on the middle diagonal (parameters: -k 20 -S 6 -p 2 -x y -w y -y 2 -Y 20 -r N -P 20 -A 1 -F 0.03).
Comparative dendrograms of full-length Cassandra sequences and the variants of Cassandra internal regions were constructed using the neighbour-joining method (Saitou and Nei, 1987) based on a manually refined MUSCLE alignment (Edgar, 2004). Evolutionary distances were computed in MEGA7 (Kumar et al., 2016) using the p-distance method (Nei and Kumar, 2000) and all positions containing ambiguities were removed for each sequence pair using the pairwise deletion option.
Calculation of Cassandra insertion times
To estimate the retrotransposon insertion time, we used the divergence of the 5′ and 3′ LTRs. Therefore, we calculated the number of mismatches between the LTRs using the p-distance method in MEGA7/MEGA X (Kumar et al., 2016) with default settings. Using the nucleotide substitution rate determined for the Adh locus in A. thaliana and (1.5 × 10⁻⁸; Koch et al., 2000), we transformed the substitution rate into the estimated age of the insertion with the equation T = d/2k, where d is the distance value and k the substitution rate for the Adh locus (A. thaliana). Boxplots to visualize the age variation of the Ama_Cassandra copies were created using the package ggplot2 (Wickham, 2016) in R (version 3.4.3, R Development Core Team, 2008).
Insertion times for tandemly arranged copies were calculated as described above. For each copy we calculated a range of possible insertion times, regarding possible LTR comparisons and therefore different distances.
Read mapping analyses
To analyse transcriptional silencing, 6.75 million sugar beet small RNAs (smRNAs; Zakrzewski et al., 2011) were mapped against representative Cassandra sequences using bowtie2 (Langmead and Salzberg, 2013). The necessary bowtie2 indices were built using the two representative Ama_Cassandra sequences for each subfamily. The smRNA reads were mapped using a seed length of 22. No mismatches were allowed. Matching smRNAs were filtered for length (21–22/24–26 nt) according to the silencing mechanisms. The coverage for each full-length sequence was evaluated using bedtools (Quinlan and Hall, 2010). For validation of whether mapped smRNA molecules are Cassandra-specific, we performed an additional mapping routine with identified Cassandra smallRNAs as custom library in bowtie2 with the --sensitive-local preset on the Cassandra-masked (RepeatMasker ver. 4.0.6; Smit et al., 2013) sugar beet assembly (RefBeet1.2).
For Cassandra quantification, read mapping of Illumina short reads (paired end) from sugar beet and beet relatives was conducted with bowtie2. Therefore, six million reads for each species from Beta vulgaris, Beta lomatogona, Beta nana, Patellifolia patellaris, Patellifolia procumbens, C. quinoa and S. oleracea (SRR3929720, SRR3740394, SRR3680879) were randomly selected for each organism via seqtk (Shen et al., 2016) and (if necessary) shortened to a length of 100 bp using the trimmer function of the fastx toolkit (http://hannonlab.cshl.edu/fastx_toolkit/). Bowtie2 indices were built as described above. Mapping was performed with bowtie2 using the local preset on default parameters (--local --sensitive-local). Statistical information (e.g. number of mapped reads) was extracted from the output data using samtools (Li et al., 2009). Visualizations of mapped reads for both smRNA and genomic Illumina reads were generated in R using ggplot2 (Wickham, 2016).
Plant material, DNA, RNA isolation and cDNA synthesis
Sugar beet seeds of the sequenced genotype Beta vulgaris vulgaris ‘KWS2320’ were obtained from KWS Saat SE (Germany). Wild beet and outgroup species were provided by the IPK Genebank of the Plant Genome Resources Center Gatersleben (Germany): B. vulgaris ssp. cicla (chard) ‘Lucullus’, B. patula (BETA 548), B. corolliflora (BETA 408), B. lomatogona (BETA 674), B. macrorhiza (BETA 545), B. nana (BETA 546), Patellifolia patellaris (BETA 534), P. procumbens (BETA 951), Chenopodium quinoa (CHEN 125) and Spinacia oleracea ‘Matador’. Genomic DNA was isolated from leaves of plants grown under long-day conditions, using the CTAB (cetyltrimethyl/ammonium bromide) protocol (Saghai-Maroof et al., 1984).
Sugar beet RNA was isolated using the PureLink™ RNA Mini Kit (Thermo Scientific) with additional TRIzol® reagent according the manufacturer’s instructions. DNAse treatment of RNA was performed using the DNA-free™ DNA removal kit (Invitrogen). First-strand cDNA was synthesized using the RevertAid First Strand cDNA Synthesis kit (Thermo Scientific). As a control, to rule out potential DNA contamination, cDNA synthesis was also conducted without RNA template.
Polymerase chain reaction
Amplification of Cassandra LTR fragments was carried out with the sugar beet-specific primers listed in Supplementary Data Table S1. To avoid cross-hybridization with genomic 5S rDNA in Southern or fluorescent in situ hybridization (FISH), LTR primers were designed to anneal upstream/downstream of the conserved 5S rDNA promoter region. For verification of tandemly arranged (TA) Cassandra sequences identified in the sugar beet reference genome, we designed flanking primers (Supplementary Data Table S1). The PCR was performed in 50-µL volumes containing 80 ng of template DNA, 0.2 mm dNTPs, 10 pg of the primer, 1× DreamTaq buffer and 1 U DreamTaq (ThermoFisher Scientific). Standard PCR conditions were 94 °C for 5 min, followed by 35 cycles of 94 °C for 2 min, primer-specific annealing temperature (56 °C) for 30 s, 72 °C for 30 s, and final incubation at 72 °C for 5 min. For longer TA Cassandra copies we chose an elongation time of 90 s.
The reverse transcription (RT)–PCR reaction was carried out using Cassandra-specific primer sets for LTR and internal sequences with standard PCR conditions. In order to check for mRNA contamination, we amplified a fragment of histone H3 with a length of 420 bp in RNA probes with and without reverse transcriptase.
For sequencing and probe preparation, PCR products were purified using the Invisorb NucleoSpin purification kit (Invitek) and ligated in pGEM-T plasmids (ThermoFisher Scientific) using the manufacturer’s conditions.
Southern hybridization
Genomic DNA was restricted with the endonuclease DraI (Thermo Scientific) and separated on 1.2 % agarose gel in 1× TAE buffer. Alkaline transfer onto Hybond-N+ nylon membranes (GE Healthcare) and hybridization were performed according to standard protocols using probes labelled with 32P by random priming (Sambrook et al., 1989). Membranes were hybridized at 60 °C. Washing steps were conducted at 60 °C for 10 min in 2× standard saline citrate (SSC)/0.1 % sodium dodecyl sulphate (SDS) followed by 10 min in 1× SSC/0.1 % SDS.
Chromosome preparation, probe labelling and FISH
Young sugar beet leaves were incubated for 3–5 h in 2 mm 8-hydroxyquinoline followed by fixation in methanol:acetic acid (3:1). The fixed plant material was macerated in an enzyme mixture containing 2.0 % (w/v) cellulase from Aspergillus niger (Sigma–Aldrich), 4.0 % (w/v) cellulase Onozuka-R10 (Serva), 5 % (v/v) pectinase from A. niger (Sigma–Aldrich), 0.5 % (w/v) pectolyase A. niger (Sigma–Aldrich) and 2.0 % (w/v) cytohelicase from Helix pomatia (Sigma–Aldrich). The nucleus suspension was spread onto slides as described by Desel et al. (2001). Specific Ama_Cassandra probes were labelled indirectly by PCR with biotin-11-dUTP (ThermoFisher Scientific). The reference probe pXV1 (sugar beet 5S rDNA; Schmidt et al., 1994) was labelled directly by PCR in the presence of DY415-dUTPs or DY647-dUTPs.
We performed FISH according to Heslop-Harrison et al. (1991) with modifications for sugar beet chromosomes (Schmidt et al., 1994). During the procedure, stringencies of 76 % for hybridization and 79 % for washing were used. Chromosome preparations were counterstained with 4′,6-diamidino-2-phenylindol (DAPI) and mounted in antifade solution. We examined the slides with an Axioplan 2 Imaging microscope (Carl Zeiss) in combination with the digital FISH analysis system GenASIs (Applied Spectral Imaging). Images were captured for each channel with a high-resolution CCD camera (SDI BV300-20A) and processed using Adobe Photoshop 5 software.
Data availability
Reference Ama_Cassandra sequences are available in GenBank for subfamily 1 (MK216566.1) and subfamily 2 (MK216567.1). An Amaranthus palmeri Cassandra sequence is also available in GenBank under MT230479 (Kalendar et al., 2020). Additional sequence data for Cassandra full-length and tandemly arranged sequences are available at https://doi.org/10.5281/zenodo.3872802. The most recent version of the assembled sugar beet genome is available at The Beta vulgaris Resource (http://bvseq.boku.ac.at/). Read data are available on the NCBI short-read archive under the following accession numbers: SRR3929720 (B. vulgaris), SRR3740394 (C. quinoa) and SRR3680879 (S. oleracea).
RESULTS
Structural features of Ama_Cassandra elements
In order to identify Cassandra TRIMs in the sugar beet (B. vulgaris) genome, we used BLASTn with a multiple sequence query of plant Cassandra sequences obtained from Gao et al. (2016) as described in the Materials and methods section. Based on our sugar beet-specific Cassandra reference sequence, we identified 638 Cassandra-related sequences via RepeatMasker, contributing 0.034 % to the sugar beet genome. Out of these candidates, we identified 61 canonical Cassandra full-length sequences and six additional full-length sequences with LTR insertions. With an average pairwise identity of 84 % in their LTR region, Cassandra sequences were classified as a single family named Ama_Cassandra (Amaranthaceae Cassandra).
Ama_Cassandra members have an average length of 802 bp with two 282-bp long LTRs. The LTRs show conserved termini with a canonical 5′-TG … CA-3′ structure and TIRs with a length of 11 nt characterized by the 5′-TGTAAYACCCC-3′ sequence. Within the Cassandra LTRs, a 60-bp region is homologous to the genomic 5S rRNA gene of B. vulgaris with a high nucleotide identity of 88.3 %. This region is located 100 bp downstream from the LTR start (Fig. 1A). Overall alignment of the 5S rRNA gene and Cassandra LTR shows less conservation, with a pairwise identity of 67 %. The 5S rDNA homologous region of the Cassandra LTRs contains the typical motifs of an RNA pol III-type promoter: an A box, an intermediate element (IE) and a C box (Szymański et al., 2003; Garcia et al., 2012).
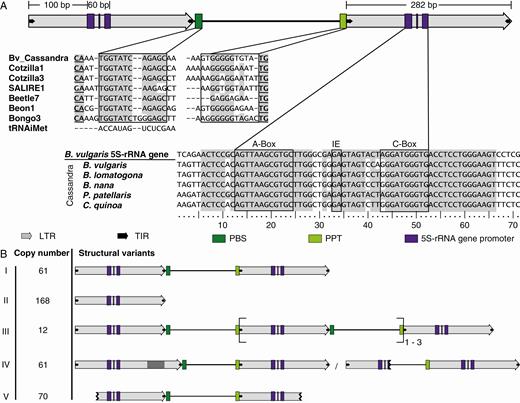
Structural features and variants of Ama_Cassandra. (A) Structure of Ama_Cassandra full-length elements. Arrows represent LTRs (grey) and TIRs (black). Coloured rectangles indicate the priming sites for the reverse transcriptase, the PBS (dark green) and the PPT (light green), as well as the 5S rDNA-derived RNA pol III promoter motifs (purple), namely A box, intermediate element (IE) and C box. Nucleotide sequences of the conserved PBS, PPT and 5S rDNA promoter motifs are provided (boxed), including flanking sequences. PBS and PPT are compared with other sugar beet retrotransposons representing the superfamilies Ty1-copia (Weber et al., 2010) and Ty3-gypsy (Weber and Schmidt, 2009; Weber et al., 2013). For the conserved 5S rDNA region within the LTR, Cassandra sequences from different Amaranthaceae are aligned with the genomic 5S rRNA gene of B. vulgaris. Matching nucleotide positions are highlighted in grey. (B) Structural variants of Ama_Cassandra are presented, along with the respective copy numbers. This includes the canonical Ama_Cassandra full-length sequence (I) as well as rearranged Cassandra-derivatives (II–V): solo LTRs (II); TA Cassandra elements (III); Cassandra sequences with internal deletions or insertions in or between the two LTR sequences, often affecting conserved sites such as the PBS, PPT or 5S rDNA region (IV); and 5′ or 3′ truncated Cassandra retrotransposons (V).
We identified no remains of a coding structure in the internal region between the LTRs. Despite the lack of coding capacity, Ama_Cassandra sequences harbour highly conserved domains, presumably necessary for replication. The PBS comprises a 12-nt sequence with high identity to an initiator methionine tRNA and PBS regions of autonomous sugar beet LTR retrotransposons (Fig. 1A). A PBS region similar to this initiator tRNA is a common feature for both LTR retrotransposon superfamilies, Ty1-copia and Ty3-gypsy, in sugar beet (Weber et al., 2010, 2013) and more generally in plants. Upstream of the 3′ LTR we identified a 11-bp long PPT required for reverse transcription. The Ama_Cassandra elements are flanked by 5-bp long TSDs, indicating that the identified elements represent genuine insertions (Kumar and Bennetzen, 1999; Wicker et al., 2007; Gao et al., 2016).
Ama_Cassandra members are variable in length and structure
Manual inspection of the identified Cassandra retrotransposon candidates revealed structural variability. Depending on the presence of conserved and intact LTRs (including the 5S promoter), TIRs, the PBS and the PPT, we assigned the detected sequences to one of five groups (groups I–V; Fig. 1B, Table 1). Out of the 638 detected Cassandra-related candidate sequences only 61 copies are full-length sequences (group I) possessing conserved LTR and TIR structures as well as intact PBS, PPT and 5S promoter motifs. We found evidence for unequal homologous recombination within one Cassandra copy (intra-element recombination) in the form of 95 solo LTR (group II) copies flanked by TSDs. Moreover, recombination between different Cassandra copies (inter-element recombination) putatively led to the formation of 73 solo LTRs without TSDs. The occurrence of 12 TA Ama_Cassandras (group III) also suggests involvement of intrachromosomal recombination processes. Five multimeric products were found without intact TSD sequences, pointing to recombination between the two most proximal LTRs of two elements. Contrarily, seven TA copies with TSDs may indicate their competence for subsequent transposition. Out of these 12 TA copies we observed differing numbers of LTRs: most common were three LTRs (n = 9), but also copies with four (n = 1) or five (n = 2) were identified. We were able to confirm nine out of 12 TA Cassandra sequences by PCR and/or detection in SMRT read data (Supplementary Data Fig. S1). The formation of larger TA Cassandra clusters with 10 or more LTRs, as recently reported for other plant families (Kalendar et al., 2020), was not observed in sugar beet. As intra-element recombination preserves flanking TSDs whereas inter-element recombination likely leads to TSD loss, we examined the presence of TSDs in the Ama_Cassandra groups I, II and III (Table 1). In total, >50 % of the group members were flanked by TSDs.
Number of identified Cassandra sequences in the sugar beet genome according to their structural integrity. Numbers of elements with intact TSD sequences are detailed
| Group | Structure | No. of elements | Proportion of elements (%) | No. of elements with TSD |
|---|---|---|---|---|
| I | Intact elements | 61 | 9.9 | 28 |
| II | Solo LTRs | 167 | 26.2 | 95 |
| III | Tandemly arranged Cassandras | 12 | 1.9 | 7 |
| IV | Indel | 61 | 9.5 | 9 |
| V | Truncated elements | |||
| 5′ truncated | 41 | 6.1 | 0 | |
| 3′ truncated | 20 | 3.1 | 0 | |
| 5′ and 3′ truncated | 9 | 1.4 | 0 | |
| Remnants | 267 | 41.8 | 0 | |
| Total | 638 | 100 | 138 |
Truncated copies were characterized by either partial or complete loss of their LTR sequences. Depending on the position of the truncation, we subdivided these copies into 5′-truncated (n = 41), 3′-truncated (n = 20), or 5′- and 3′-truncated (n = 9). Indel-Cassandra sequences (group IV) comprise six identified Cassandra copies with LTR insertions as well as Cassandra copies with at least 5 % length loss. These length losses are results of internal body or LTR deletions, especially those affecting conserved regions such as the PBS, the PPT and the pol III promoters. As these regions are essential for replication, these deletions likely occurred after insertion (Bennetzen et al., 2005). Fragmented sequences, due to their short length or diversified sequence information not assignable to one of the described structural groups, were classified as remnants (Table 1).
Internal region of Ama_Cassandra elements reveals different ages of two subfamilies
The alignment of all identified Ama_Cassandra full-length copies has an average pairwise identity of 76.8 %, whereas the corresponding LTR alignment shows higher pairwise identities of 82.6 %. The discrepancy is due to the high sequence variability of the internal region between the 5′ and 3′ LTR. The alignment and dendrogram analysis of internal Ama_Cassandra regions reveals a split into two subfamilies (Fig. 2A, B and Supplementary Data Fig. S2) in sugar beet, termed subfamily 1 and subfamily 2. Out of 61 canonical full-length sequences (excluding sequences with LTR insertions), 36 sequences can be assigned to subfamily 1 and 25 sequences to subfamily 2. The two subfamilies share the same conserved 282-bp LTR sequences (Supplementary Data Fig. S2). With 84.5 % pairwise identity, the subfamily 1 internal region shows an average length of 261 bp and higher conservation compared with subfamily 2 internal sequences, which are on average shorter (215 bp) and more diverged (72.6 % pairwise identity). Based on LTR sequences of each individual copy, we calculated the approximate insertion time for each subfamily member (Fig. 2C). In line with the pairwise identity values, subfamily 1 sequences are not only more conserved but they generally integrated more recently and often have TSDs (Fig. 2B, C). Especially the most recent Cassandra copies with the highest LTR identity and flanking TSDs are exclusively assigned to subfamily 1. Within the internal region of both subfamilies, the 3′ part is most similar (Fig. 2A, D), with an 84-bp shared region upstream of the PPT (Fig. 2A). The identified Ama_Cassandra subfamilies show no similarities to already described autonomous LTR retrotransposons in sugar beet (Weber et al., 2010, 2013; Wollrab et al., 2012; Nachtigall et al., 2016).
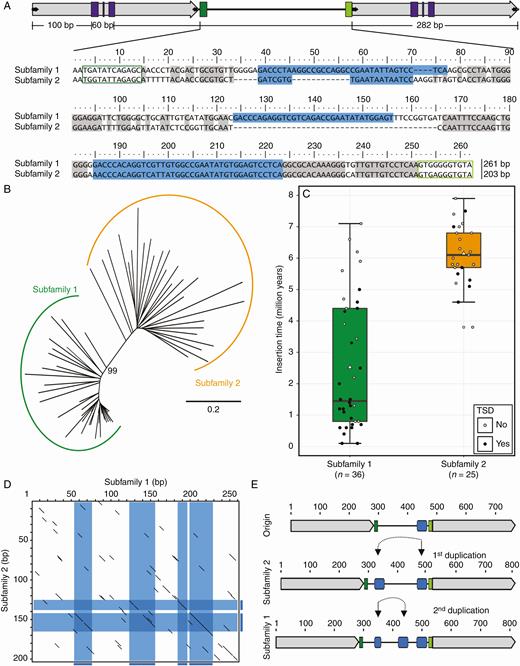
Sugar beet Ama_Cassandra internal sequences represent two main variants. (A) Alignment of representative internal regions of the Ama_Cassandra subfamilies. Internal sequences for the two main Ama_Cassandra variants are compared and are referred to as subfamily 1 and subfamily 2. Matching nucleotide positions are highlighted in grey. Conserved structures are framed in colour (PBS, dark green; PPT, light green). Potentially duplicated regions are highlighted in light and dark blue. (B) Neighbour-joining dendrogram of internal sequences for all 61 full-length Ama_Cassandra sequences. The two main variants, namely subfamily 1 (green) and subfamily 2 (orange), are clearly separated, with the shortest branch lengths observed for subfamily 1 members. The dendrogram is drawn to scale, with branch length units corresponding to the evolutionary distance (p-distance). (C) Insertion times of full-length Cassandra retrotransposons of subfamilies 1 and 2. Fill colour of individual data points indicates the presence (black) or absence (grey) of flanking TSDs for each analysed Cassandra. Most Cassandras of subfamily 1 integrated within the last 5 million years and are often flanked by TSDs. In contrast, Cassandras of subfamily 2 are older on average, with fewer TSDs. (D) Comparative dotplots (wordsize 5) of the internal regions of subfamily 1- and 2-reference sequences. Potential duplication events are highlighted in blue. (E) Evolutionary scenario for the generation of two Ama_Cassandra subfamilies in beet. Two duplications are sufficient for the emergence of the slightly larger subfamily 1.
We propose a possible scenario for Ama_Cassandra evolution according to which internal sequence duplications may have led to the split into two subfamilies (Fig. 2D, E). Due to the length difference between the subfamilies and the earlier integration and higher divergence of subfamily 2 members, we propose that subfamily 2 represents the ancestral variant. Thus, we hypothesize the formation of subfamily 1 sequences based on duplication events within an original Cassandra copy (Fig. 2D, E). We assume an initial enlargement of the internal region creating subfamily 2 variants, beginning with a duplication of a 38-nt sequence originating from the conserved 3′ region (Fig. 2A), as marked blue in a comparative dotplot visualization (Fig. 2D). A second duplication, as illustrated in Fig. 2E (blue), presumably generated the slightly larger subfamily 1 variant.
The unambiguous assignment of different structural variants to a defined subfamily was only possible for some truncated (20 %; S1, n = 3; S2, n = 11) and indel sequences (24.4 %; S1, n = 14; S2, n = 7), due to both the diverged character of these sequences and the partly shared internal regions between Cassandra subfamilies. In contrast, for most tandemly arranged Cassandra retrotransposons the internal regions could be specifically assigned to one of the subfamilies. Although most copies show internal regions exclusively belonging to either subfamily 1 or subfamily 2, we also observed combinations of both variants within a single TA copy (Table 2). These three copies (TA_05, 06, 10) represent hybrids between retrotransposons from different subfamilies. One of these mosaic copies was verified via PCR and subsequent sequencing (Supplementary Data Fig. S1). Regarding possible age values for TA Cassandras, we considered time ranges based on divergence values for each copy, definable by the availability of multiple distance rates to arise from possible LTR combinations. Aligning with LTR divergence for canonical full-length Cassandra sequences, subfamily 1 TA elements (TA_01, 03, 04, 07, 09) generally inserted more recently than subfamily 2 elements (TA_11/12; Table 2, Supplementary Data Fig. S3). Out of the hybrid sequences of subfamily 1 and 2 (TA_05, 06, 10), only one seems to be more recent, presumably integrating less than two million years ago.
Overview of the TA Cassandra copies and assignment of individual internal sequences to subfamily 1 or 2
| Structure | No. of internal regions | Subfamily 1 | Subfamily 2 | Not assignable |
|---|---|---|---|---|
| TA_01 | 2 | 2 | 0 | 0 |
| TA_02 | 2 | 0 | 1 | 1 |
| TA_03 | 4 | 4 | 0 | 0 |
| TA_04 | 2 | 2 | 0 | 0 |
| TA_05 | 3 | 1 | 1 | 1 |
| TA_06 | 2 | 1 | 0 | 1 |
| TA_07 | 4 | 4 | 0 | 0 |
| TA_08 | 2 | 0 | 2 | 0 |
| TA_09 | 2 | 2 | 0 | 0 |
| TA_10 | 2 | 1 | 1 | 0 |
| TA_11 | 2 | 0 | 2 | 0 |
| TA_12 | 2 | 0 | 2 | 0 |
| Tandemly arranged (TA_01-12) | 29 | 17 | 9 | 3 |
Ama_Cassandra sequences localize on all chromosomes with a preference for the distal euchromatin
To analyse Cassandra’s localization along the sugar beet chromosomes, we used both in silico methods and in situ hybridizations. First, we determined their physical positions along the pseudochromosomes of the sugar beet genome assembly (RefBeet1.2). For this purpose, all Ama_Cassandra structural variant groups, except for remnants, were mapped on the B. vulgaris pseudochromosomes (Fig. 3A). We found Cassandra instances on all pseudochromosomes. On pseudochromosomes 5 and 6, we observed a Cassandra accumulation, contrasting with the remaining pseudochromosomes. Consistent with the computational detection, FISH along mitotic metaphase and interphase chromosomes showed similar patterns (Fig. 3B); we detected dispersed signals along all chromosomes with a preference for distal chromosomal regions. Increased signals in DAPI-weak, euchromatic regions indicate a preference of Cassandra elements for less condensed regions. In interphase nuclei, Cassandra signals were excluded from heterochromatic hotspots. As a control, hybridization was performed with a sugar beet-specific probe for genomic 5S rRNA, which forms large arrays close to the centromere of chromosome 4 as previously described (Schmidt et al., 1994). This allowed us to exclude 5S rDNA cross-hybridization and to confirm that our probe specifically targets Cassandra retrotransposons.
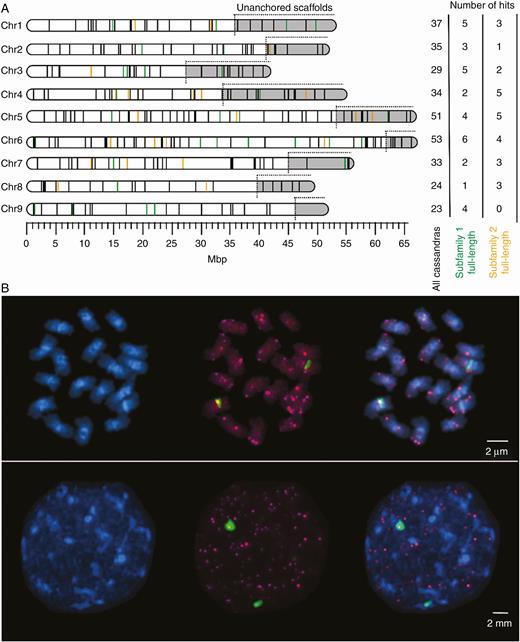
Chromosomal localization of Ama_Cassandra TRIMs. (A) Mapping of structural variants of Ama_Cassandra along B. vulgaris pseudochromosomes (RefBeet1.2; Dohm et al., 2014). Each line represents the chromosomal position of one Ama_Cassandra hit. Unanchored scaffolds are highlighted in grey and are appended to the corresponding chromosomes, but exact physical positions are not determinable. Coloured lines refer to full-length sequences, assigned to either subfamily 1 (green) or subfamily 2 (orange). Black lines correspond to rearranged structural variants (groups II–V) of Ama_Cassandra (except for remnants). The number of mapped sequences for each pseudochromosome is given on the right. Cassandra hits on scaffolds that are not assigned to any chromosome are not shown. (B) FISH with Ama_Cassandra-derived probes on sugar beet metaphase and interphase chromosomes. Ama_Cassandra-specific LTR probe signals are indicated in magenta (Cy3) on DAPI-stained chromatin (blue). Green (FITC) fluorescence signals indicate hybridization with genomic 5S rDNA (pXV1) on chromosome 4.
Transcription and silencing of Ama_Cassandra in sugar beet
To assess if Ama_Cassandra retrotransposons are actively transcribed, we performed RT–PCR from total RNA with Ama_Cassandra-specific primer pairs. As tissue culture often leads to activation of transposable elements (Smulders and de Klerk, 2011), we specifically screened for the presence of transcripts in sugar beet callus. For this experiment five primer combinations were tested, as illustrated in Fig. 4A: primers positioned within the LTR (lane a), within the internal regions of subfamily 1 (lane b) and subfamily 2 (lane c), and primer combinations spanning the internal regions and parts of the LTR(s) (lanes d, e).
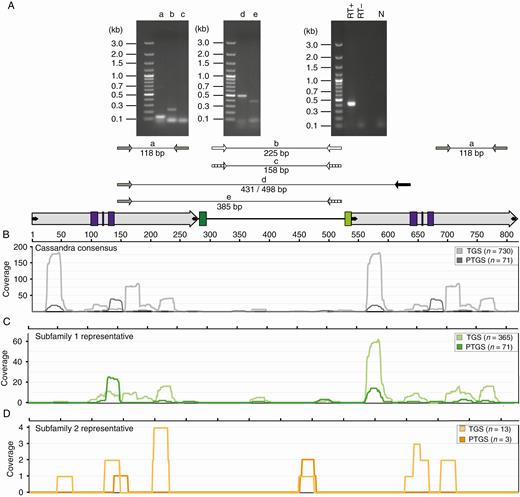
Transcriptional activity and epigenetic silencing of Ama_Cassandras in sugar beet. (A) RT–PCRs with Cassandra-specific primers on callus cDNA. Lanes (a–e) indicate the primer combinations as indicated below the gel images. Expected amplicon sizes are indicated. Control experiments were performed using histone H3 primers with RT-positive (RT+) and RT-negative (RT−) templates. Primer combinations for the internal regions of subfamilies 1 (lane b) and 2 (lane c) detect different transcriptional activity for both subfamilies. (B–D) Position-specific coverage of the Cassandra subfamily references with small RNA molecules. Small RNA sequences (n = 6.75 million) were mapped against a representative Cassandra consensus (grey, B) and reference sequences for subfamily 1 (green, C) and subfamily 2 (orange, D). According to their length, small RNAs were categorized as typical of either post-transcriptional gene silencing (PTGS, 21–23 nt) or transcriptional gene silencing (TGS, 24–26 nt). Differences in small RNA mapping patterns for subfamilies 1 and 2 (C, D) reference sequences are results of SNPs within the 5′ and 3′ LTR sequences.
We observed various Cassandra-specific RT–PCR products (Fig. 4A) indicative of Ama_Cassandra transcription. While we did obtain a PCR product for the LTR (lane a) and the internal region of subfamily 1 (lane b), no product for the more diverged subfamily 2 was amplified (lane c). This finding was verified by combining Ama_Cassandra LTR primers with subfamily-specific internal primers and an additional LTR primer (Fig. 4A, lanes d, e). We observed Cassandra PCR products spanning the complete retrotransposon from LTR to LTR (excluding conserved 5S rDNA region) and from LTR to the internal region of subfamily 1. These observations were validated by amplicon sequencing. Based on the detection of cDNA PCR products with various primer combinations, we conclude that Ama_Cassandra transcription starts within the LTRs upstream of the used LTR primer.
Due to the ability to invade new genomic positions, retrotransposon activity might lead to gene disruption or regulatory changes (Lisch, 2013; Chuong et al., 2017). To avoid damage of important genes the host restricts the activity of transposable elements via epigenetic silencing. Epigenetic silencing refers to a non-mutational means for the loss or inactivation of genes. One way for the host to accomplish this is using smRNAs, which contribute to either RNA-mediated DNA methylation (transcriptional gene silencing, TGS) or RNA interference (post-transcriptional gene silencing, PTGS; Fultz et al., 2015).We estimated the extent of Cassandra regulation by RNA silencing by mapping sugar beet smRNA sequences against a representative sequence for all Cassandra full-length copies and the cloned reference sequence for subfamilies 1 and 2. For all full-length types we detected smRNAs in size ranges typical of both PTGS (21–23 nt) and TGS (24–26 nt). The amount of detected smRNA molecules differs greatly between both subfamilies: as subfamily 1 shows a smRNA occurrence of n1 = 436 molecules, molecules for subfamily 2 are strongly decreased, with n2 = 16. In both subfamilies the number of mapped TGS smRNAs (n1 = 365, n2 = 13) was higher than the number of PTGS smRNAs (n1 = 71, n2 = 3; Fig. 4C, D). This indicates preferred Ama_Cassandra silencing by DNA methylation in the sugar beet genome. Notably, most smRNA molecules matched the conserved LTR sequences (Fig. 4B–D). As the consensus sequence (Fig. 4B) has identical 5′ and 3′ LTRs, the smRNA profiles are similar, illustrating the reproducibility of our analysis. In contrast, the cloned reference sequences for subfamilies 1 (Fig. 4C) and 2 (Fig. 4D) do not harbour identical 5′ and 3′ LTR sequences, due to accumulation of SNPs and (in the case of subfamily 2) minor deletions. Therefore, the smRNA mapping patterns for 5′ and 3′ LTRs differ. Regarding the deviating internal regions of the subfamilies 1 and 2, we found a moderate number of smRNA molecules matching the more recent and less diverged subfamily 1 members and only a small number of hits for the presumably older subfamily 2.
To ensure that the mapped smRNAs are specific to Cassandra elements, only perfect matches were considered. In addition, the identified Cassandra smRNA molecules were used as a custom library against the Cassandra-masked sugar beet genome. No Cassandra-unspecific hits were found, e.g. for sequence motifs, which are generally common for LTR retrotransposons.
Distribution of Ama_Cassandra and its subfamilies within the Amaranthaceae
To evaluate the phylogenetic distribution of Ama_Cassandra sequences within the Amaranthaceae, we performed comparative read mapping (Fig. 5A) and Southern hybridizations to DraI-restricted genomic DNA of representative Betoideae and Chenopodioideae species (Fig. 5B–D). In order to comparatively quantify Cassandra retrotransposons, we mapped whole-genome shotgun Illumina reads against three species-specific Ama_Cassandra reference sequences: a consensus sequence representing both subfamilies and reference sequences for internal regions of subfamilies 1 and 2 (Fig. 5A).We observed positive mapping signals for all Amaranthaceae species for the representing Cassandra consensus sequence, ranging in hit numbers from 192 to 4488 reads. A high abundance of Ama_Cassandra within the Corollinae and Nanae was detected by read mapping for each of the three references. For the more distantly related species spinach and quinoa we only observed mapping for the consensus sequence, but not for the internal regions of subfamilies 1 and 2, suggesting only hits for conserved Cassandra LTRs. No canonical Cassandra full-length sequences were observed in the spinach assembly (Xu et al., 2017), which also explains the lack of the highly conserved Cassandra-specific hybridization signals (Fig. 5B). For spinach, additional sequence analysis in the recent assembly retrieved short remnants with incomplete LTR sequences similar to Ama_Cassandra, which explains matching reads for the consensus sequence (Fig. 5A). To verify the presence of Cassandra in the quinoa outgroup, we also searched the quinoa genome assembly (Jarvis et al., 2017). Although read mapping only indicated faint bands, we identified 25 full-length Cassandra TRIM sequences in the C. quinoa genome, further referred to as subfamily 3. High LTR sequence similarity between Ama_Cassandra subfamily 1/2 and subfamily 3 (87.5 %) allowed us to assign the quinoa Cassandra to the same family as the Ama_Cassandra retrotransposons. As the 208-bp internal region of subfamily 3 shows low similarities to subfamily 1 (~51 %) and subfamily 2 (~63 %), quinoa Cassandras represent a third subfamily within the Amaranthaceae. This high LTR similarity also explains the quinoa signal in read mapping analysis and after Southern hybridization (Fig. 5A, B, Supplementary Data Fig. S4). The pairwise identity over the full length of all subfamilies is 74.4 %, with the internal region of subfamily 3 accounting for most of the differences (Supplementary Data Fig. S5). The comparison with a Cassandra sequence from Amaranthus palmeri recently identified by Kalendar et al. (2020) reveals similar patterns: high identity values for Cassandra LTRs (74.5 %) and an additional very short fourth variant of internal sequences (Supplementary Data Figs S4 and S5). All Amaranthaceae Cassandra sequences share the same PBS sequence and a similar LTR length, ranging from 271 to 291 bp.
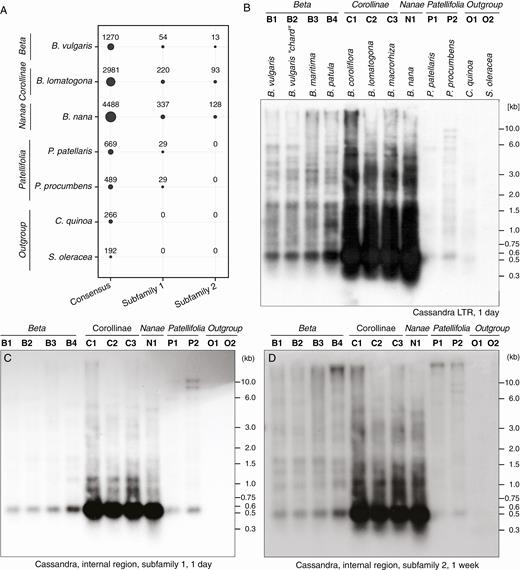
Abundance of Ama_Cassandra in beet and related species. (A) Comparative mapping of six million randomly selected genomic reads to Ama_Cassandra consensus sequences, and two reference sequences representing the internal regions of subfamilies 1 and 2. Circle areas indicate the number of mapped reads. (B–D) Genomic DNA of B. vulgaris and related Amaranthaceae species was restricted by DraI and hybridized with Ama_Cassandra probes specific for the LTR (B) and the internal regions of subfamily 1 (C) and subfamily 2 (D), respectively. Exposure times are indicated below the images (B–D). The estimated Cassandra-specific length of the most prominent fragment varies between 540 bp (B, C) and 480 bp (B, D).
To complement our bioinformatic analysis, hybridization was performed using three different probes: a probe for Ama_Cassandra LTRs (Fig. 5B) and two internal probes specific for Ama_Cassandra subfamily 1 (Fig. 5C) and Ama_Cassandra subfamily 2 (Fig. 5D). The LTR probe shows highly conserved hybridization signals in all species except spinach (S. oleracea), indicating a strong structural conservation of Ama_Cassandra sequences within all species. The most prominent signal, at ~500 bp, is explained by a conserved DraI restriction site within the 5′ and 3′ LTRs, generating a 544-bp fragment for subfamily 1 and a smaller 504-bp fragment for subfamily 2, bridging the internal region. We were able to detect the Cassandra LTR-specific signal in all species except spinach (Fig. 5B). Notably, the observed subfamily 3 fragment in quinoa (C. quinoa) is slightly shorter than in the two beet genera, causing a shift in the hybridization signals.
In contrast, both probes for the internal variants of subfamily 1 and subfamily 2 were detectable for all members of the Betoideae, but not for the more distant crops quinoa and spinach (Fig. 5C, D). Interestingly, all three autoradiograms show the strongest hybridization signals in the three wild beets of the Corollinae section and in Beta nana, the only species of the section Nanae, aligning with read mapping results.
Cassandra retrotransposons show broad sequence conservation in the plant kingdom
In contrast to other TRIM elements, Cassandra has been described in a wide range of plant species (Kalendar et al., 2008; Gao et al., 2016). In total, 50 additional Cassandras from 15 families spanning pteridophytes as well as mesangiosperms were examined. To evaluate the sequence conservation among the Cassandra elements from different plants, we compared LTRs and internal sequences of the 50 reference elements with Ama_Cassandra subfamilies 1 and 2.
Our comparative all-against-all dotplot of the LTR sequences shows a perceivable sequence similarity (Supplementary Data Figs S6 and S7). All angiosperm Cassandra LTRs share the 5S rDNA region, with the conservation partially exceeding the promoter motifs.
Although we clearly observed long conserved LTR structures within each plant family, shorter regions adjacent to the 5S rDNA gene were also conserved across Cassandras from the Poaceae, Amaranthaceae, Cannabaceae and Fabaceae. Surprisingly high LTR similarities to the Amaranthaceae Cassandra LTRs were observed in the monocotyledonous Poaceae family (Supplementary Data Fig. S6). Nevertheless, a plant family-specific clustering of Cassandra TRIMs prevailed.
Internal regions of plant Cassandras are much more diverse (Supplementary Data Fig. S7), with high variation in sequence and length across the phylogenetic groups. Nevertheless, we observe plant family-specific Cassandra conservation in the Poaceae, Rosaceae, Brassicaceae and Fabaceae, indicating vertical transmission. As observed for the Ama_Cassandra elements, there is often a considerable diversity of Cassandra internal sequences even within the same plant family, contrasting with the high LTR conservation, e.g. in the Fabaceae. Ama_Cassandra’s internal sequences of subfamilies 1 and 2 show a moderate similarity to some Poaceae representatives, but overall the internal Ama_Cassandra regions seem to be unique to the Amaranthaceae.
In contrast to the high variation between the internal Cassandra regions, we strikingly detected some instances of Cassandra conservation between distantly related species. High Cassandra sequence identities between e.g. Garcinia mangostana (Supplementary Data Fig. S7, lane 37) and Medicago truncatula (Supplementary Data Fig. S7, lane 51) may point to horizontal transmission of the Cassandra retrotransposon (LTR, 67 %; internal region, 79 % sequence identity). Nevertheless, as these high cross-species similarities are in the minority, we suggest an overall vertical transmission with limited instances of horizontal transfer.
DISCUSSION
Here we present the molecular and bioinformatic characterization of Cassandra TRIMs in the genome of B. vulgaris and related Amaranthaceae species. We identified 638 Cassandra sequences in the sugar beet reference genome assembly, including 61 (9.6 %) Ama_Cassandra full-length elements.
Cassandra’s 5S rRNA promoter: an atypical but presumably beneficial feature of LTR retrotransposons
The typical Ama_Cassandra sequence shows a total length of 802 bp with 282-bp long LTRs (Fig. 1). This corresponds to the size range of Cassandra elements from other angiosperms, between 550 and 860 bp (Kalendar et al., 2008; Sampath and Yang, 2014; Yin et al., 2014). Due to their conserved LTR lengths and high nucleotide identity values with similarities aligning well with the 80–80–80 suggestion by Wicker et al. (2007), we assigned all detected Cassandra TRIMs in Beta to the Amaranthaceae_Cassandra (Ama_Cassandra) family. The similarity to the 5S rDNA covers 60 bp of the LTR, is located 100 bp downstream of the LTR 5′ terminus and contains the pol III promoter motifs. Compared with other plant Cassandra families, in which the 5S rDNA-derived region may span 120 bp, this sequence stretch is shorter in beet (Kalendar et al., 2008; Yin et al., 2014).
Usage of a pol III promoter is uncommon for plant retrotransposons, as the majority rely on RNA pol II (Kumar and Bennetzen, 1999). Exceptions are short interspersed nuclear elements (SINEs) and Cassandra TRIMs, both short and non-autonomous retrotransposons. Cassandra’s 5S rDNA promoter may thus have been acquired by one of two routes.
(1) The promoter may have been acquired by the retrotransposition of a 5S rDNA-derived SINE into an LTR, as suggested by Kalendar et al. (2008). This scenario seems unlikely, as 5S RNA-derived SINEs have so far only been identified in zebrafish and a few mammals, such as fruit bats and springhare (Kapitonov and Jurka, 2003; Gogolevsky et al., 2008, 2009).
(2) The 5S rDNA promoter may have been directly transferred, e.g. following extrachromosomal amplification processes as described for the 5S rDNA (Cohen et al., 2010). Similar recruitment of cellular components by transposable elements is not unfamiliar: Within the class II DNA transposons, helitrons and Pack-MULEs are well known examples of the acquisition of cellular components in plants, thereby driving gene and transposable element evolution (Bennetzen, 2005).
Availability of the 5S rRNA promoter in the LTR allows transcription by RNA pol III independently of RNA pol II recognition. The preservation of the Cassandra LTR sequences and the pol III promoter across angiosperm phylogeny indicates a potential evolutionary advantage. As activation of the pol III promoter is associated with open chromatin (White, 2011), this promoter switch may be accompanied by a changed integration preference; indeed, canonical pol II-transcribed LTR retrotransposons often accumulate in the heterochromatic regions of the chromosomes (Lippman et al., 2004; Du et al., 2010). However, the Cassandra family occupies the distal, euchromatic chromatin in beet. This prioritization of gene-rich regions was also observed for Cassandra retrotransposons in other genomes (Kalendar et al., 2008; Sampath and Yang, 2014; Yin et al., 2014). As other plant TRIMs also accumulate in the euchromatin (Witte et al., 2001; Gao et al., 2012, 2016), this tendency may also be linked to their small overall length, as proposed for other short repeats, such as miniature inverted-repeat transposable elements (MITEs) and SINEs (Seibt et al., 2020).
small RNA silencing of the conserved LTR allows Cassandra regulation in beet
To prevent negative effects and damage to the genome, host genomes have developed various strategies to inhibit the movement of transposable elements (Fultz et al., 2015). Due to Ama_Cassandra’s preference for open euchromatin, transcriptional regulation may be challenging, as epigenetic silencing might interfere with the expression of nearby genes (Slotkin and Martienssen, 2007; Feschotte, 2008). The detection of cDNA fragments corresponding to Cassandra retrotransposons in sugar beet despite the occurrence of smRNAs indicates that not all copies are silenced, or that Cassandra silencing is specific for certain tissues and developmental stages.
Most of the Ama_Cassandra silencing by smRNA molecules takes place at the LTR, as observed for many LTR retrotransposons (Cantu et al., 2010; Domingues et al., 2012). As the LTR is usually specific for a retrotransposon family, this allows the selective regulation of individual families by the host. For some retrotransposons, specific structural features are targeted by smRNAs, e.g. for maize LTR retrotransposons of the Sirevirus lineage, the targeting primarily corresponds to a 19-bp palindrome within the LTRs (Bousios et al., 2016). However, no similar structure has been observed in the targeted Ama_Cassandra LTRs.
In addition to the suppression of retrotransposition, DNA methylation also reduces the accessibility of DNA for the initiation of recombination (Melamed-Bessudo and Levy, 2012). This may be especially relevant for Cassandra elements in beet as they are predominantly localized in the distal, open euchromatin, which are regions prone to double-strand breaks and recombination (Drouaud et al., 2013; Kent et al., 2017). Along these lines and as discussed below, we have frequently observed that Cassandra is targeted by the recombination machinery in beet. As TE silencing was reported to suppress TE-mediated recombination in Arabidopsis and mammalian cell lines (REFs) (Mirouze et al., 2012; Zamudio et al., 2015), Cassandra silencing may also be involved in protection of the genome’s stability.
Cassandra members have strongly preserved LTRs but vary in body sequence and overall structure
In contrast to the highly conserved Cassandra LTR, the remaining retrotransposon sequences underlie far less selective pressures, visible in the accumulation of mutations and the high number of structural Cassandra variants.
The identification of several Ama_Cassandra subfamilies in the analysed Amaranthaceae shows that the internal region may tolerate mutations. Based on the similarity of the 5′ and 3′ LTRs, we propose relatively recent insertion times up to only 8 mya for Cassandra full-length members. However, traditional age calculations for LTR retrotransposons based purely on LTR similarity are limited, as other factors, such as recombination or nested integration, can obscure the age (Jedlicka et al., 2020). Customarily, only LTR retrotransposons flanked by TSDs are considered for age calculations, as TSDs mark genuine transposable element insertions as opposed to recombined transposable elements. Here, we also include age estimates for all other elements to allow an easy comparison of element intactness and LTR divergence. Another limiting factor is the genic substitution rate traditionally used for age calculations. As transposable elements evolve faster than genes (SanMiguel et al., 1998), this measure is limited (Vitte et al., 2004). In addition, the Adh from A. thaliana very likely differs from that in B. vulgaris. Consequently, the calculated integration times should not be considered as absolute measures. Instead, they allow a comparison of the divergence over time between different copies and variants. We observed a correlation between the relative age and the assignment to one of the subfamilies, with subfamily 1 members being less diversified than subfamily 2 members. In addition, >70 % of the subfamily 1 members are flanked by TSDs, whereas most subfamily 2 members lack these integration motifs. Therefore, we assume that subfamily 1 emerged from subfamily 2 by small internal duplication events.
Out of the 638 analysed Cassandra-derived sequences in beet, only 61 (9.6 %) were identified as full-length sequences without restructuring, insertions or deletions. Instead, most Cassandra sequences differed in structure, but retained a strongly preserved LTR. This indicates high rates of intra- and inter-element unequal recombination, which decrease copy number and counterbalance retrotransposon amplification (Devos et al., 2002; Vitte and Panaud, 2005; Ma and Bennetzen, 2006; Vitte and Bennetzen, 2006; Vitte et al., 2007).
Short Cassandra remnants (≤200 nt) make up a fraction of 41.7 % and correspond to heavily fragmented Cassandra retrotransposons or incomplete solo LTRs. If truncated Cassandra copies (lacking parts of the 5′ region, 3′ region or both regions) and indel-Cassandra members are added, incomplete Cassandra sequences even surpass 60 %. Likely causes of Cassandra fragmentation are nested integrations and illegitimate recombinations between direct repeats anywhere in the element (Lenoir et al., 2005; McGurk and Barbash, 2018). These mechanisms may lead to long and short internal deletions (Fig. 6A–E) as well as to solo LTRs (Fig. 6A; Devos et al., 2002; Ma et al., 2004; Ma and Bennetzen, 2006). For Cassandra in beet, we observed many solo LTRs (ratio of solo LTRs to full-length elements, 2.4:1). This is in line with high Cassandra solo LTR fractions in other genomes: in rice, solo LTRs outnumber the full-length elements by a factor of three (Kalendar et al., 2008) and in Rosaceae genomes the highest solo LTR to full-length ratio was 1.67:1 (Yin et al., 2014).
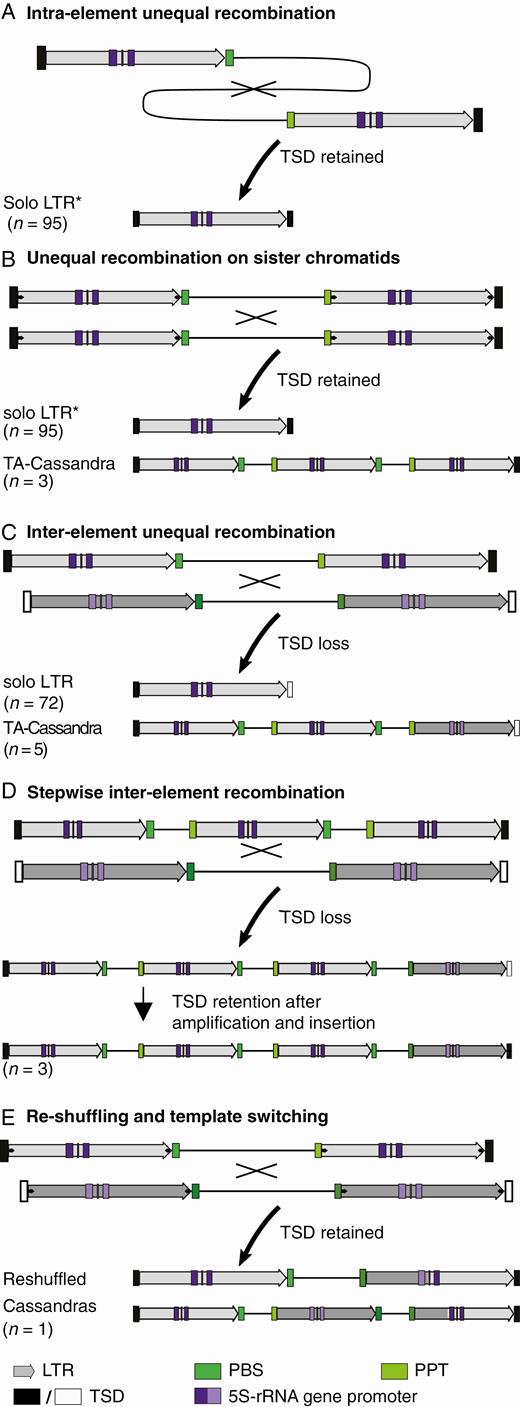
Cassandra recombination and re-shuffling results in structural variants. The number of identified sequences assignable to each recombination mechanism is given in brackets. Asterisks mark unambiguously assignable sequences. Sequence information for all TA Cassandra sequences is provided as additional data at https://doi.org/10.5281/zenodo.3872802. (A) Solo LTRs with TSDs are most likely a result of recombination within one Cassandra copy, leading to the deletion of one LTR and the internal region. (B, C) Solo LTRs and TA Cassandras emerge from inter-element unequal recombination between either Cassandra copies from the same locus on sister chromatids or homologous chromosomes (B) or two distinct Cassandra copies (C). While solo LTRs are a result of the deletion of one LTR and the internal region, TA Cassandras are formed by merging two copies in association with the loss of one LTR. In these cases TSDs are only preserved upon inter-element recombination between orthologous Cassandra copies on sister chromatids or homologous chromosomes. (D) Stepwise recombination of full-length and TA copies leads to Cassandras with two or more additional copies of LTR and internal sequences. (E) Template switching during reverse transcription can create chimeric full-length or TA copies, harbouring sequence information of both template Cassandras. Those re-shuffled Cassandras gain TSDs during their integration process.
In contrast, we also observed sequence expansion for Cassandra retrotransposons. This can be explained by either nested integration or unequal recombination.
First, nested integrations into the Cassandra LTR lead to a length increase (SanMiguel et al., 1996). Already two decades ago, in maize and the nightshades several TRIMs were found to harbour further retrotransposon insertions in their LTRs (Witte et al., 2001).
Second, unequal recombination may generate complex Cassandra elements containing more than two LTRs and several internal regions. If two full-length copies recombine unequally and excise an LTR, a chimera with two internal regions and three LTRs is formed (Fig. 6C; Devos et al., 2002; Vicient et al., 2005; Yin et al., 2014). In this case, the resulting tandemly arranged copy does not form TSDs (Fig. 6C). In contrast, the recombination of two Cassandra sequences between the same loci of homologous chromosomes would retain the TSDs, as also described for Alu elements in the human genome (Fig. 6B; Lee et al., 2015). Nevertheless, the occurrence of tandemly arranged copies with TSDs primarily indicates the ability for active retrotransposition (Yin et al., 2014). Interestingly, it has been suggested that short distances between two longer LTRs can facilitate the initiation of unequal recombination (El Baidouri and Panaud, 2013). This is in line with the simultaneous occurrence of tandemly arranged Cassandras in several plant genomes (Kalendar et al., 2008, 2020; Yin et al., 2015; Gao et al., 2016).
This formation of short tandem structures has already been observed in plants, not only for TRIMs (Gao et al., 2016) but also for transposable elements of all types (Yin et al., 2014; Lee et al., 2015; Schwichtenberg et al., 2016; Seibt et al., 2016; McGurk and Barbash, 2018). These structures may also serve as a starting point for the evolution of satellite DNA (Meštrović et al., 2015; Satović et al., 2016). In maize, a tandemly arranged repeat originated from a centromeric retrotransposon, most likely a result of intrastrand deletions (Sharma et al., 2013). For Cassandra in beet, we did not detect these large, satellite-typical arrays. Instead, the largest Cassandra expansion consists of five LTRs, which frame three internal sequences as a result of stepwise recombination (Fig. 6D). Due to the observed frequency of intrachromosomal recombination between Cassandra sequences, these non-autonomous LTR retrotransposons can be considered as components that have a high potential to cause sequence loss and thus directly influence genome size.
During reverse transcription of Cassandra, template switching between two genomic RNAs may also lead to the observed multimeric Cassandra structures with several LTRs (Fig. 6E; Sabot and Schulman, 2007). As already observed 30 years ago, this co-packaging of two different RNA molecules drives retroviral recombination (Hu and Temin, 1990). Reverse transcriptase is able to displace the RNA template during cDNA synthesis and can perform multiple template jumps leading to recombination (Luo and Taylor, 1990; Sabot and Schulman, 2007; Yadav et al., 2012). In sugar beet, re-shuffling of retrotransposons due to recombination was reported for errantiviruses of the Ty3-gypsy superfamily (Wollrab et al., 2012). Recently, this recombination process via template switching was experimentally confirmed for naturally occurring LTR retrotransposons in Saccharomyces cerevisiae and Arabidopsis thaliana (Bleykasten-Grosshans et al., 2011; Sanchez et al., 2017). This extrachromosomal mechanism of reverse transcription-mediated recombination might help the members of a retrotransposon clan to evolve and to reduce mutations that accumulated during their long period of persistence (Drost and Sanchez, 2019). It is therefore very likely that this extrachromosomal process also contributes to the formation of the complex Cassandra copies in sugar beet.
Cassandra retrotransposons are evolutionarily ancient, without an autonomous partner in beet
The widespread distribution of Cassandra TRIM sequences in angiosperms over long evolutionary times is remarkable and illustrates the successful colonization by radiation (Kalendar et al., 2008; Sampath and Yang, 2014; Yin et al., 2014; Gao et al., 2016). However, despite the assumed vertical transmission, we also observed high similarity between Cassandra LTR sequences of distantly related taxa, such as monocots and eudicots. Similarly, high identity of internal regions between phylogenetically separated species may point to additional Cassandra amplification by horizontal transfer. Horizontal transfer is thought to be a major player in plant evolution, contributing to the spread of various transposable elements across phylogenetic borders (Gilbert et al., 2010; Schaack et al., 2010; Walsh et al., 2013). Therefore, Gilbert and Feschotte (2018) even propose that it may be mandatory for transposable elements that persist over evolutionary long time-spans. Therefore, horizontal amplification mechanisms may have also played a role in supporting Cassandra’s ubiquitous dispersal.
As TRIMs are non-autonomous LTR retrotransposons, their active retrotransposition may rely on an autonomous partner, which provides the required proteins for amplification and integration (Witte et al., 2001). However, despite Cassandra’s ubiquitous presence in the plant kingdom, including not only angiosperms but also lycophytes and non-vascular plants (Gao et al., 2016), an autonomous Cassandra partner has not been identified in any of the species investigated so far. As a general rule, a transposable element partnership may either stringently rely on sequence similarity or may non-stringently be based on other principles, e.g. recognition of the RNA signals or secondary structures, as discussed below.
(1) If non-autonomous and autonomous elements share a sequence, this should be detectable by a similarity search. In the past, only a few TRIM partnerships were detected, most in this way, pointing to partner Ty1-copia retrotransposons (Gao et al., 2016). There, short homologous regions were located either in the LTR (Liu et al., 2015; Gao et al., 2016) or in internal untranslated regions (Gao et al., 2012). For Cassandra in beet, we did not identify any sequences related to other retrotransposons. Nevertheless, we cannot exclude that the autonomous partner has diverged over time, and thus may have escaped our detection. Taking into account the short half-life of plant retrotransposons, amounting to only a few million years (Bennetzen, 2005), the disappearance of an autonomous partner retrotransposon seems plausible. Therefore, at least for modern beet, we assume that its genome does not harbour stringent Cassandra partner retrotransposons.
(2) Retrotransposon partnerships may also be possible without shared sequence regions, as demonstrated for the LINE–SINE interactions in mammals (Dewannieux et al., 2003; Ahl et al., 2015). This raises the question of whether TRIMs may have also developed non-stringent recognition mechanisms. Partnerships may rely on the structural interactions between the Cassandra RNA and necessary proteins of an autonomous partner element rather than sequence similarity. The Cassandra RNA may either harbour packaging signals for the retrotranspositional machinery of autonomous elements (Feng et al., 2000) or may fold in such a way as to recruit the necessary proteins. Due to variable internal Cassandra regions, different Cassandra subfamilies may also differ in their RNA signals or RNA fold, thus influencing Cassandra proliferation.
(3) Due to Cassandra’s sequence similarity to the ribosomal 5S rRNA, we can also imagine that Cassandra RNA was transported to the ribosome. As observed for mammalian Alu SINEs (Ahl et al., 2015), it may persist there until the proteins required for its transport and transposition are translated, then use the newly generated proteins for its proliferation. This putative mode of amplification is independent of the host genome’s composition and the individual sets of autonomous retrotransposon families. Therefore, we assume that it represents the most likely strategy for the spread of the ubiquitous Cassandra TRIMs.
Conclusions
To summarize, Cassandra TRIMs were retained over long evolutionary time-spans, with strong conservation of their LTRs and the embedded promoter. Thus, Cassandra’s persistence may serve as an example of successful evolutionary strategies of short, non-coding retrotransposons. (1) Due to their small size and insertion preferences into distal, euchromatic regions, Cassandra retrotransposons may be tolerated in the genome, with only small effects on gene function and host fitness. (2) By the acquisition of a pol III promoter, Cassandra TRIMs gain independence from pol II activation. (3) Recombination mechanisms lead to the re-shuffling of Cassandra variants and generate new mosaic retrotransposon copies. The structural innovation results in a genetic turnover, ensuring Cassandra fitness and long-term survival.
SUPPLEMENTARY DATA
Supplementary data are available online at https://dbpia.nl.go.kr/aob and consist of the following. Figure S1: experimental verification of tandemly arranged Cassandra sequences in sugar beet. Figure S2: cluster analysis of identified sugar beet. Figure S3: calculated relative insertion time-points for tandemly arranged Cassandras. Figure S4: Cassandra LTR sequences compared between different Amaranthaceae species and comparative dotplot of Ama_Cassandra LTR sequences. Figure S5: Cassandra internal sequences compared between different Amaranthaceae and comparative dotplot of Ama_Cassandra internal sequences. Figure S6: comparative dotplot analysis of 52 plants’ Cassandra LTR sequences. Figure S7: comparative dotplot analysis of 52 plants’ Cassandra internal sequences. Table S1: primer sequences and annealing temperatures for RT–PCR experiments and PCR validation of tandemly arranged Cassandra sequences.
FUNDING
This work has been part of the research in the framework of the BMBF grant ‘AnnoBeet’ (FKZ 0315962C). K.M.S. was supported by the German Federal Ministry of Education and Research (KMU-innovativ-18 grant 031B0224B) to T.S.
ACKNOWLEDGEMENTS
We miss Dipl.-Ing. (FH) Ines Walter and Prof. Dr Thomas Schmidt and will remember their friendship and mentorship with fondness. We thank Susan Liedtke for her excellent technical assistance and Ludwig Mann for his help with part of the bioinformatics. The gene bank of the IPK Gatersleben is gratefully acknowledged for providing plant seeds. The authors declare no conflicts of interest.
