


Abstract
The biogeographic patterns of the East-Asia-endemic shrub Magnolia sieboldii, in which the range of the subsp. sieboldii is interposed with the disjunct distribution of subsp. japonica, implies a complex evolutionary history, involving rapid speciation and hybridization. Here, we aim to reveal the evolutionary and phylogeographic histories of the species with a particular focus on the time of subspecies divergence, the hypothesis of secondary hybridization and the Pleistocene survival of each subspecies, using a combination of genetic analyses and ecological niche modelling.
Genetic variation, genetic structures and phylogenetic relationships were elucidated based on nuclear low-copy genes, chloroplast DNA, and nuclear simple sequence repeats (SSRs). A scenario selection analysis and divergence time estimation were performed using coalescent simulation in DIYABC and *BEAST. Ecological niche modelling and a test of niche differentiation were performed using Maxent and ENMTools.
All marker types showed deep, but pronouncedly incongruent, west–east genetic divergences, with the subspecies being delineated only by the nuclear low-copy genes. Phylogenetic tree topologies suggested that ancient hybridization and introgression were likely to have occurred; however, this scenario did not receive significant support in the DIYABC analysis. The subspecies differentiated their niches, but both showed a dependence on high humidity and were predicted to have persisted during the last glacial cycle by maintaining a stable latitudinal distribution via migration to lower altitudes.
We found a deep genetic divergence and a pronounced phylogenetic incongruence among the two subspecies of M. sieboldii, which may have been driven by major paleogeographic and paleoclimatic events that have occurred since the Neogene in East Asia, including global cooling, climate oscillations and the formation of land bridges. Both subspecies were, however, considered to persist in situ in stable climatic conditions during the late Pleistocene.
INTRODUCTION
Climatic fluctuations and the changing geography that occurred during the Tertiary and the Pleistocene influenced the distribution of flora. Geographic range dynamics are thought to drive multiple biogeographic events of vicariance and migration, which are responsible for allopatric divergence (Heads, 1999; Qiu et al., 2011; Wen et al., 2016). Conversely, allopatric species can come into secondary contact during range expansion and form hybrid zones (Comes and Kadereit, 1998; Hewitt, 2011), which may facilitate speciation and adaptation (Rieseberg, 1997). The recent advances in molecular phylogenetics have led to novel insights into this subject, e.g. that ancient hybridization, which represents the ancestral occurrence of hybridization between currently non-hybridizing taxa, is not unusual in higher plants (Manen et al., 2010; Hinsinger et al., 2014; Ma et al., 2018).
East Asia harbours the highest diversity and endemism of temperate plants (Wu, 1998; Qiu et al., 2011), and the Japanese Archipelago occupies its eastern edge and exhibits extensive and complex patterns of phytogeographic relationships with its continental counterparts (Hotta, 1974). Phytogeographers have recognized two regions in continental Asia that are the most phytogeographically related to the Japanese temperate flora. One is found in the north-eastern coasts of East Asia, including the Korean Peninsula and North-east China, where cool-temperate deciduous plants with common origins, such as Juglans, Panax and Corylus, frequently occur (Milne and Abbott, 2002). The other is South-east China (and the southern tip of the Korean Peninsula), which has a particularly close affinity with West Japan (Hotta, 1974; Xie, 1997). Despite their geographical distances, they are associated with many corresponding or conspecific species and are characterized by the existence of endemic genera, such as Disanthus, Platycrater and Pterygopleurum (Xie, 1997).
Magnolia sieboldii (Magnoliaceae) may offer a model showing an interesting phytogeographic relationship between the Japanese Archipelago and continental East Asia. This is the easternmost species in the East-Asia-endemic section Oyama, and is disjunctly distributed in West Japan, the Korean Peninsula and East China (Fig. 1A). The classification proposed by Ueda (1980) recognized two subspecies based on distinct floral traits, such as stamen color; therefore, disjunct populations in East China and West Japan were treated as conspecific taxa (subsp. japonica) and delineated from those present in the Korean Peninsula (subsp. sieboldii). This may simply be attributed to an ancient divergence between the subspecies before the vicariant event; however, the existence of geographically intervening subspecies implies more complex evolutionary scenarios (Qiu et al., 2009). First, the Korean subspecies may be a recently diverged lineage that has evolved rapidly after the vicariant event in the subsp. japonica. Secondly, these currently allopatric subspecies may have experienced secondary contacts and undergone post-divergence hybridization. The Korean Peninsula and West Japan have been repeatedly connected via land bridges during the late Tertiary and the Pleistocene (Ohshima, 1990; Maruyama et al., 1997; Kitamura and Kimoto, 2006), which are thought to have served as routes for migration and gene flow (Dobson and Kawamura, 1998; Park et al., 2019). Moreover, clinal floral morphology in the subsp. japonica, the western populations of which have larger and more round-shaped flowers that are more similar to those of the subsp. sieboldii (S. Kikuchi, unpubl. res.), may suggest past inter-subspecific gene flow. However, there is little empirical evidence for inferring the evolutionary dynamics of the species.
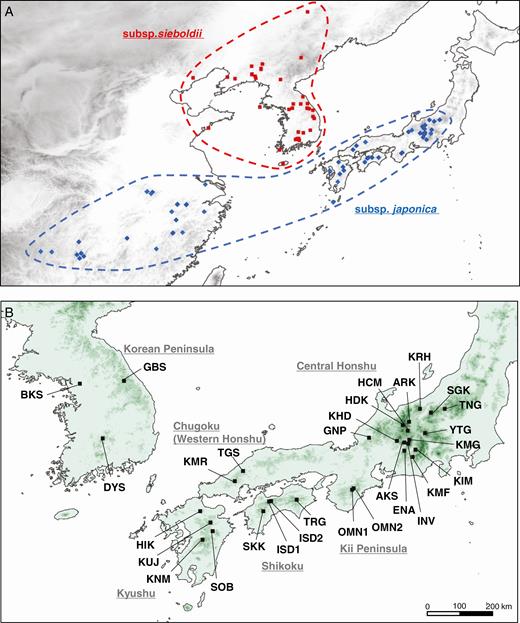
Distribution (A) and sampling locations (B) of Magnolia sieboldii subsp. sieboldii and subsp. japonica. The distribution was based on available detailed information sourced from the database of the Chinese Virtual Herbarium, Ueda (1980) and the sampling location in this study. The details of the sampling locations are provided in Table 1. Population abbreviations: TNG, Mt. Tanigawa; SGK, Shigakogen Highlands; KRH, Mt. Kurohime; YTG, Mt. Yatsugatake; KIM, Mt. Kimen; KMF, Mt. Kumabushi; ARK, Mt. Ariake; HDK, Mt. Hodaka; HCM, Mt. Hachimori; KMG, Mt. Kisokomagatake; INV, Ina Riv.; AKS, Akasawa Natural Recreational Forest; ENA, Mt. Ena; KHD, Mt. Kohide; GNP, Mt. Genanpo; OMN1, Mt. Misen; OMN2, Mt. Daifugen; TGS, Mt. Tenguishi; KMR, Mt. Kanmuri; TRG, Mt. Tsurugi; ISD1, Mt. Kamegamori; ISD2, Mt. Kanpusen; SKK, Shikoku Karst; HIK, Mt. Hiko; KUJ, Mt. Taisen; SOB, Mt. Sobo; KNM, Mt. Kunimi; GBS, Mt. Gyebangsan; DYS, Mt. Dukyusan; and BKS, Mt. Bukhansan.
Over the past decade, the development of temperate plant diversity in East Asia has attracted considerable attention (Harrison et al., 2001; Qiu et al., 2011). In addition, the combination of ecological niche models (ENMs) with genetic data has provided a powerful tool for inferring potential refugia and population histories in the course of the past climatic changes (e.g. Sakaguchi et al., 2012; Qi et al., 2014; Cao et al., 2016).
Here, we aimed to reveal the evolutionary histories of M. sieboldii. We focused on the relationships between the two intraspecific taxa, the subsp. sieboldii and the subsp. japonica, by examining their extent of divergence and ancient hybridization using nuclear and plastid genetic markers, including nuclear low-copy gene sequences, which have a reportedly high utility in phylogenetic reconstruction (Sang, 2002; Zimmer and Wen, 2013). In addition, ENMs were generated to test the niche differentiation between the subspecies and to infer the Pleistocene survival of both subspecies by comparing within-subspecies genetic structures.
MATERIALS AND METHODS
Study species and sample collection
Magnolia sieboldii KOCH subsp. japonica UEDA is a shrub with a height of 1–3 m and pale-yellow stamens that is disjunctly distributed in West Japan and East China. It is usually scattered or rare, growing in the altitudinal zone of cool-temperate to sub-alpine coniferous forests at 1000–2000 m a.s.l. In contrast, M. sieboldii subsp. sieboldii reaches 3–10 m in height and has flowers with purplish-red stamens. It is distributed in North-east Asia and is rather common in temperate to sub-alpine forest zones at 100–1500 m a.s.l.
Sample collections for DNA analysis were carried out from 1998 to 2009. Leaves were collected from 510 samples at 27 sites for subsp. japonica in Japan and at 67 samples for three populations of subsp. sieboldii in the Republic of Korea (Fig. 1B). In addition, one sample each from Magnolia wilsonii and Magnolia sinensis of the sect. Oyama were obtained as outgroups for phylogenetic analysis. The details of the sampling sites are provided in Table 1. DNA was extracted from pulverized leaf tissues using a DNeasy Plant Mini kit (Qiagen, MD, USA) and diluted to a concentration of approx 1 ng µL–1. Voucher specimens of samples from each of the subspecies were deposited in the herbarium at the Forestry and Forest Products Research Institute (TF, HDA-001310–HDA-001324).
Details of the sample locations analysed in the present study
| Country/Region | Location | Population code | Latitude | Longitude | Altitude (m) | No. of samples |
|---|---|---|---|---|---|---|
| Japan (subsp. japonica)/ | ||||||
| Central Honshu (Kanto/Chubu) | Mt. Tanigawa | TNG | 36.8324 | 138.9423 | 1407 | 19 (4) |
| Shigakogen Highlands | SGK | 36.7088 | 138.4897 | 1597 | 4 (4) | |
| Mt. Kurohime | KRH | 36.8249 | 138.1325 | 1598 | 28 (4) | |
| Mt. Yatsugatake | YTG | 36.0368 | 138.2955 | 1549 | 8 (5) | |
| Mt. Kimen | KIM | 35.4926 | 137.9890 | 1811 | 15 (2) | |
| Mt. Kumabushi | KMF | 35.2603 | 137.8945 | 1558 | 17 (4) | |
| Mt. Ariake | ARK | 36.4049 | 137.7733 | 1414 | 21 (3) | |
| Mt. Hodaka | HDK | 36.2964 | 137.5753 | 1313 | 37 (3) | |
| Mt. Hachimori | HCM | 36.1157 | 137.7279 | 1337 | 30 (7) | |
| Mt. Kisokomagatake | KMG | 35.8177 | 137.7805 | 1617 | 21 (4) | |
| Ina Riv. | INV | 35.6941 | 137.7498 | 1153 | 17 (6) | |
| Akasawa Natural Recreational Forest | AKS | 35.7297 | 137.6218 | 1141 | 12 (4) | |
| Mt. Ena | ENA | 35.4605 | 137.6190 | 1390 | 2 (4) | |
| Mt. Kohide | KHD | 35.7767 | 137.3822 | 1706 | 11 (4) | |
| Mt. Genanpo | GNP | 35.8866 | 136.4648 | 1386 | 11 (5) | |
| Kii Peninsula (Kansai) | Mt. Daifugen | OMN2 | 34.2284 | 135.9633 | 1648 | 32 (0) |
| Mt. Misen | OMN1 | 34.1796 | 135.9123 | 1791 | 9 (7) | |
| Western Honshu (Chugoku) | Mt. Tenguishi | TGS | 34.7922 | 132.3429 | 1132 | 24 (4) |
| Mt. Kanmuri | KMR | 34.4667 | 132.0753 | 1254 | 27 (4) | |
| Shikoku Island | Mt. Tsurugi | TRG | 33.8572 | 134.0996 | 1724 | 3 (0) |
| Mt. Kanpusen | ISD2 | 33.8135 | 133.2624 | 1634 | 30 (0) | |
| Mt. Kamegamori | ISD1 | 33.7951 | 133.1932 | 1799 | 16 (5) | |
| Shikoku Karst | SKK | 33.4792 | 133.0095 | 1391 | 32 (4) | |
| Kyushu Island | Mt. Hiko | HIK | 33.4803 | 130.9340 | 1026 | 9 (4) |
| Mt. Taisen | KUJ | 33.1068 | 131.2745 | 1482 | 24 (4) | |
| Mt. Sobo | SOB | 32.8303 | 131.3459 | 1628 | 30 (4) | |
| Mt. Kunimi | KNM | 32.5466 | 131.0173 | 1668 | 21 (4) | |
| Rebublic of Korea (subsp. sieboldii)/ | ||||||
| Gangwon-do | Mt. Gyebangsan | GBS | 37.7465 | 128.4435 | 908 | 30 (7) |
| Jeonbuk-do | Mt. Dukyusan | DYS | 35.8643 | 127.7458 | 1436 | 29 (4) |
| Seoul | Mt. Bukhansan | BKS | 37.6527 | 126.9968 | 242 | 8 (4) |
| Magnolia wilsonii | Purchased from Sakatanotane Co. (Yokohama, Japan) | 1 (1) | ||||
| Magnolia sinensis | Sapporo Yurigahara Park | 1 (1) |
The number of samples at each location genotyped for nSSRs and cpDNA polymorphism is also given, with the number of samples used for sequencing analysis of the nuclear COS genes indicated in parentheses.
DNA polymorphism analysis
Nuclear genetic variation was investigated using simple sequence repeats (SSRs) and direct nucleotide sequencing. The five nuclear SSRs (nSSRs; Supplementary data Table S1) used in the present study were selected from loci developed for Magnolia obovata (Isagi et al., 1999). Nuclear gene sequences were obtained from low-copy genes (COS genes), which are present at single- or low-copy number within the genomes of a wide range of diploid angiosperms and have recently served as useful phylogenetic tools (Sang, 2002; Small et al., 2004; Zimmer and Wen, 2013). We sequenced three genes, i.e. the LEAFY (LFY), phytochrome A (PHYA) and alanine-glyoxylate aminotransferase (Agt1) genes. Universal primers developed in previous studies (Mathews and Donoghue, 1999; Liang et al., 2007; Li et al., 2008; Nie et al., 2008) were used for amplification and sequencing, and additional internal primers were designed for the sequencing of Agt1 and applied as required (Supplementary data Table S1).
Plastid DNA variation was explored using fragment analysis. Preliminary exploration was performed on 19 chloroplast intergenic regions using universal primers (Taberlet et al., 1991; Terachi, 1993; Demesure et al., 1995; Tsumura et al., 1995; Hamilton, 1999; Wang and Tsumura, 1999; Suyama et al., 2000), and the sequences were registered in the DNA Data Bank of Japan (DDBJ) database (GenBank accession nos LC491987–LC492072). Subsequently, eight markers, including six mononucleotide SSRs and two PCR–restriction fragment length polymorphism (RFLP) markers, were developed from seven polymorphic regions (trnH–trnK, psbA–trnS, trnG intron, atpF, trnK, psbB–psbF and rpl20–rps18). In the PCR–RFLP locus analysis, the TaqI or ClaI restriction enzymes were used to identify polymorphic restriction sites within the trnH–trnK and rpl20–rps18 regions, respectively. To enhance polymorphism resolution, PCR amplification of the trnH–trnK region was carried out using newly designed primers (Supplementary data Table S1). All original primers used in the present study were designed using OLIGO v6.65 (Molecular Biology Insights).
Fragment polymorphism analyses [nSSRs, chloroplast SSRs (cpSSRs) and PCR–RFLPs] were performed on all DNA samples. The amplification of the nSSR loci, excluding the M10D8 locus, was performed based on a multiplex reaction using a Qiagen Multiplex PCR Kit (Qiagen, Hilden, Germany), according to the manufacturer’s instructions. The other SSRs (cpSSRs and the M10D8 locus of the nSSR) were amplified individually in 6 µL reaction mixtures containing template DNA, 20 mm Tris–HCl (pH 8.4), 50 mm KCl, 1.5–2.0 mm MgCl2, 0.2 mm of each dNTP, 0.25 µm of each primer and 0.25 U of Takara Ex Taq polymerase (Takara, Shuzo, Japan). The PCR conditions included an initial denaturation step at 94 °C for 3 min, followed by 35–40 cycles of 30 s at 94 °C, 30 s at the annealing temperature of each primer pair (Supplementary data Table S1) and 30 s at 72 °C, and a final extension step at 72 °C for 5 min. PCR was performed on a PerkinElmer 9700 Thermocycler (PerkinElmer, Warrington, UK). The PCR amplicons were then subjected to electrophoresis using an ABI3130 Genetic Analyzer and sized using GeneMapper v4.0 (Applied Biosystems, Foster City, CA, USA). The amplification of the PCR–RFLP markers (trnH–psbA and rpl20–rps12) was carried out in a 10 µL reaction mixture containing reactants at the concentrations stated above and using the same PCR conditions as those described above, with the exception of longer incubation periods (35–40 cycles of 1 min at 94 °C, 1 min at the annealing temperature and 2 min at 72 °C). The products were digested using 2.0 mmTaqI (Nippon Gene, Tokyo, Japan) and ClaI (Takara Bio, Kusatsu, Japan) solutions by incubation for 2 h at 65 °C and 37 °C, respectively, and electrophoresed in 2 % agarose gels. The chloroplast haplotypes of individuals were determined using a combination of the cpSSRs and the PCR–RFLPs.
Sequencing analyses of the nuclear COS genes (LFY, Agt1 and PHYA) were conducted on 3–8 samples selected from each of the populations (131 individuals) using the M. sinensis and M. wilsonii samples as outgroups (Table 1). The target genes were amplified under the same conditions as those used for the PCR–RFLP markers. The amplicons were purified with EXOSAP-IT (Affymetrix, Santa Clara, CA, USA) and subjected to direct sequencing on an ABI3130 Genetic Analyzer using the BigDye Terminator v3.1 Cycle Sequencing Kit (Applied Biosystems). Sequences were read in both directions using forward and reverse amplifying primers, and internal sequencing primers if required, and were assembled using CodonCode Aligner v7.1.2 (CodonCode Corporation, Centerville, MA, USA), to generate consensus sequences. Multiple peaks at a single position were coded using IUPAC ambiguity codes. Sequence alignments were constructed using a MUSCLE algorithm and manually refined using SeaView v4.3.3 (Gouy et al., 2010). Aligned sequences were imported into DnaSP v5 (Librado and Rozas, 2009) to generate phased haplotypes from heterozygous sequences. All genotypes were registered in the DDBJ (GenBank accession nos LC491627–LC491986).
Genetic data analysis
Population genetic diversity indices, including the number of alleles (A), the observed (HO) and expected heterozygosity (HE) of the nSSRs, the number of haplotypes (NH) and the unbiased haplotype diversity (h) of the cpDNA markers, were computed using GenAlEx v6.5. (Peakall and Smouse, 2006). Because of the uneven sizes of the sampled populations, some of which contained very few individuals, the number of alleles per locus was corrected for sample size using rarefaction in HP-RARE v1.0 (Kalinowski, 2005). In the case of nSSRs, Hardy–Weinberg equilibrium (HWE) and the presence of null alleles were examined for each locus and population using GenePop (Rousset, 2008) and Micro-Checker (Van Oosterhout et al., 2004), respectively. Moreover, the neutrality of each nSSR marker was tested by the Ewens–Watterson test of neutrality (Manly, 1985) implemented in PopGene (Yeh et al., 1997).
A hierarchical partitioning of genetic variation was carried out by analysis of molecular variance (AMOVA) in Arlequin v3.5.2.2 (Excoffier et al., 2005) across three levels: within populations, among populations and among groups of populations (i.e. subspecies or genetic clusters).
Chloroplast haplotype data were also used to test the past population expansion hypothesis in a mismatch distribution analysis. Populations in demographic equilibrium are expected to have multimodal distributions of mismatches in nucleotide sequences, whereas unimodal distributions are expected when populations have experienced recent demographic expansions. The mismatch distribution analysis was performed using Arlequin v3.5.2.2., in which the goodness-of-fit of mismatch distributions to the expected distribution under a sudden expansion model was tested using the sum of squared deviations and the raggedness index (Rogers and Harpending, 1992).
The nSSR data were subjected to Bayesian clustering analyses in STRUCTURE v2.3.4 (Pritchard et al., 2000) to elucidate intraspecific genetic structures. In the STRUCTURE analysis, 20 independent runs were performed for varying K values (K = 2–11) with 10 000 burn-ins followed by 100 000 Markov chain Monte Carlo (MCMC) iterations under the admixture model, with allele frequency being correlated. The best-fit number of clusters was determined based on the method of Evanno et al., (2005) using Structure Harvester (Earl and von Holdt, 2011). The results obtained with the best-fit K were averaged using CLUMPP (Jakobsson and Rosenberg, 2007) and visualized using DISTRUCT (Rosenberg, 2003). The phased sequence data of the nuclear COS genes were used to compute haplotype diversity and nucleotide diversity for each subspecies and for the entire data set. Tests for non-neutral evolution were conducted by computing Tajima’s D (Tajima, 1989). In addition, we estimated Fu’s Fs (Fu, 1997) to evaluate population growth. All indices were computed using DNAsp v5, and P-values for each statistic were obtained from 10 000 coalescent simulations. Moreover, nucleotide non-synonymous to synonymous diversity within each subspecies (PiA/PiS ratio) and divergence among the subspecies (KA/KS) were estimated for each gene using DNAsp v5.
The genotypic and sequence data of each marker type were then subjected to phylogenetic inference. First, based on the nSSR data, the phylogenetic relationship among the six regional populations (Table 1: C Honshu, W Honshu, Kii Peninsula, Shikoku and Kyushu Island for the subsp. japonica and the subsp. sieboldii) were explored by Neighbor–Joining (NJ) trees based on DA distances (Nei et al., 1983), with branch support produced by 1000 bootstrapping over loci using the software Populations 1.2.32 (Langella, 1999).
The phylogenetic relationships among the haplotypes in chloroplast and nuclear COS genes were resolved by constructing a minimum spanning network using the Median-Joining method implemented in NETWORK v5.0.0.3 (Bandelt et al., 1999). One base pair size differences in the mononucleotide repeats of the cpSSRs were regarded as indels and assigned one-tenth lower weights of the substitutions.
The intraspecific phylogenetic relationships of nuclear genes were inferred by constructing a network as a combination of gene trees. First, gene trees were constructed for each nuclear COS gene using the Bayesian inference method in MrBayes v3.2.1 (Ronquist et al., 2012). Two independent runs containing four MCMC chains (one hot and three cold chains) were run over 1 million generations until the average standard deviation of split frequencies fell below 0.01, saving trees every 500 generations and discarding the first 10 % as burn-ins. The optimal model of nucleotide substitution for each locus was selected from 88 models based on the corrected Akaike information criterion in jModelTest v0.1.1 (Guindon and Gascuel, 2003; Posada, 2008). The best single-gene trees from each locus were then combined into a ‘consensus network’ using Splitstree v4.14.4 (Huson and Bryant, 2006). Different sequences of a given locus within individuals were arbitrarily combined to generate multilocus haplotype pairs within individuals.
Moreover, based on the chloroplast haplotypic data (including cpSSRs) and nuclear sequences, the phylogenetic relationships among the regional populations were inferred using a multilocus coalescent analysis in the species-tree inference method of *BEAST (StarBEAST) implemented in BEAST version 2.5.1 (Bouckaert et al., 2014). Moreover, divergence times were estimated using two calibration points in outgroup taxa, Liriodendron (Magnoliaceae) and Annona (Annonaceae).
Available comparable sequences of Liriodendron and Annona, as well as the chloroplast sequence of M. wilsonii, were obtained from GenBank, as listed in the Supplementary data Table S2. Posterior phylogenies and divergence time were estimated for chloroplast and nuclear genes separately, calibrating the root (Magnoliaceae + Annonaceae) node and the Magnolia + Liriodendron node at 113 and 93.5 Mya with a standard deviation of 1.0 Ma, respectively, according to previous molecular phylogenetic studies (Nie et al., 2008; Li et al., 2019) based on fossil records (Frumin and Friis, 1996; Mohr and Bernardes-de-Oliveira, 2004). Magnolia sinensis, which fell into different positions among loci, was excluded from this analysis. We applied a strict clock model with the HKY model of nucleotide substitution and chose a Calibrated Yule speciation process based on the Bayes factor test (data not shown). MCMC analyses were run for 10 million generations with parameters sampled every 5000 generations, and summary trees were generated using TreeAnnotator v2.5.1.
Finally, we performed an Approximate Bayesian Computation analysis in DIYABC version 2.1.0 (Cornuet et al., 2008) to infer the phylogeographic scenario of M. sieboldii. As our analysis focused on the divergence and hybridization among the subspecies, three sets of individuals were chosen and subjected to the simulation, for simplicity. The first set included 64 individuals of the subsp. japonica from Central Honshu, representing the ‘pure’ japonica lineage (see the Results) and was referred to as the CJ (central japonica) lineage. The second comprised 25 individuals of the subsp. japonica from Shikoku and Kyushu Districts, which exhibited incongruent phylogenetic signals (as stated below), and was referred to as the WJ (western japonica) lineage. The third included 15 individuals of the subsp. sieboldii from the Korean Peninsula and was termed the KS (Korean sieboldii) lineage.
A scenario selection analysis was conducted by comparing three potential evolutionary scenarios regarding the divergence patterns and the occurrence/non-occurrence of secondary introgression: scenario 1 assumed an ancient subspecies divergence (CJ vs. KS), followed by the occurrence of hybridization, thus yielding the WJ lineage. In contrast, scenarios 2 and 3 attributed the phylogenetic incongruence to incomplete lineage sorting. Scenario 2 assumed ancient subspecies divergence, followed by intra-subspecific (CJ vs. WJ) divergence, whereas scenario 3 assumed the rapid evolution of the subsp. sieboldii (KS) after the vicariance of the subsp. japonica (CJ vs. WJ).
The generation time was assumed to be 20 years, because individuals of M. sieboldii under natural conditions may require a much longer time for flowering than the 5–7 years reported for cultivated M. wilsonii (Callaway, 1994). The prior substitution rates per generation per nucleotide in the chloroplast genome were based on the values of 1.3–4.8 × 10⁻⁹ substitutions per site per year reported for the chloroplast genes of trees and shrubs (Wolfe et al., 1987). The average and individual-locus substitution rates in nuclear genes were set to 0.036–0.986 × 10⁻⁸ and 0.003–2.288 × 10⁻⁸ substitutions per site per year, respectively (Huang et al., 2012). A total of 3 million simulations (1 million per scenario) were performed, and the most likely scenario was evaluated by comparing the posterior probabilities based on a logistic regression on the 1 % of simulated datasets closest to the observed data. The further details of the model comparison steps are described in the Results. The goodness-of-fit of the scenarios was assessed by the DIYABC option of model checking with a principal component analysis (PCA), which compared the deviation of summary statistics of the posterior predictive distribution with the observed data. Confidence in a chosen scenario was evaluated by computing both type I and type II errors.
Ecological niche modelling
Potential changes in suitable M. sieboldii habitats were predicted via the generation of ENMs using the maximum entropy modelling implemented in MAXENT v3.3.3 (Phillips et al., 2006). The occurrence data were sourced from the sampling sites of our study, in addition to 32 records of the specimens with distinct geographic information from the Chinese Virtual Herbarium (http://www.cvh.ac.cn/). Current climatic data included 19 bioclimatic data layers (bio1–bio19) at 2.5 arcmin resolution available at the WorldClim 1.4 database (Hijmans et al., 2005). The current ENMs established separately for each subspecies were then projected onto the paleoclimatic dataset for the Last Glacial Maximum (LGM: approx. 22 000 years ago) and Last Interglacial (LIG: approx. 120 000–140 000 years ago) climate conditions of the MIROC-ESM model (Watanabe et al., 2011) and the CCSM4 model (Gent et al., 2011).
The niche differentiation hypothesis was also tested among the subspecies. First, a PCA was run to compare the bioclimatic variables at the locations of occurrence of the subspecies using the R package ade4 (Dray and Dufour, 2015). The significance of niche differentiation between the two climatic clouds was examined using the between-class inertia percentage and 99 Monte Carlo randomization tests. In addition, we employed niche identity and background similarity tests in ENMTools v.1.4 (Warren et al., 2010). In the niche identity test, Schoener’s D index of niche overlap between the subspecies was calculated using Maxent-generated ENMs, and was then compared with the distribution of niche overlap scores generated by 100 replicates under the null hypothesis that the niches of the subspecies are identical. A background test was performed with 100 pseudoreplicates in reciprocal directions (comparing the niche of subsp. sieboldii with the background of subsp. japonica, and vice versa). The background areas for each subspecies were defined as the potential niches of each subspecies above the minimum training presence threshold from the Maxent outputs stated above.
RESULTS
Nuclear SSR analysis
The nSSR loci generated 93 alleles, of which 56 and 11 alleles were unique to subsp. japonica and subsp. sieboldii, respectively. The highest population genetic variation (indicated by NR, HO and HE) was observed in the GBS population of the subsp. sieboldii, followed by the SOB population of the subsp. japonica. Conversely, three populations at peripheral mountains in Central Honshu (KIM, KMF and GNP) were monomorphic. The population-level genetic variation and inbreeding parameters are summarized in Supplementary data Table S3. At the population level, the F-statistics showed low but significantly positive inbreeding coefficients (FIS = 0.155 ± 0.021). The test for HWE found that 24 out of 106 available locus–population combinations were significantly deviated, with Micro-Checker revealing potential null alleles in 18 of them. Population genetic differentiation was high (FST = 0.575) and more pronounced in subsp. japonica (FST = 0.636) vs. subsp. sieboldii (FST = 0.140). According to the results of the AMOVA, 28 % of genetic variation in M. sieboldii occurred within populations. A large proportion (59 %) of genetic variation was observed among populations, while only 13 % of genetic variation existed between subspecies. However, based on the genetic groups revealed by the clustering analysis (see below), the genetic structures at higher hierarchical levels exhibited pronounced variation (23 % among groups vs. 49 % among populations). The Ewens–Watterson test did not reject the neutrality of all loci at the P < 0.05 level.
The STRUCTURE analysis revealed that the optimal number of ancestral populations was two, as indicated by a clear ∆K peak (Supplementary data Fig. S1), but also found a minor peak at K = 6. This suggests hierarchical genetic structures, in which there were two major gene pools that could be further divided into six genetic components. The Q-value bar plot (Fig. 2A) and pie charts (Fig. 3A) for K = 2 suggested that the major genetic boundary was discordant with the taxonomic delineation, but was present between the eastern and western populations of Japanese subspecies, with the former covering Central Honshu and Kii Peninsula, and the latter involving Chugoku, Shikoku and Kyushu District. The bar plot for K = 6 (Fig. 2B) indicated that the eastern gene pool was further divided into three regional genetic clusters, including two in Central Honshu and one in Kii Peninsula. In contrast, in the western gene pool, the subsp. sieboldii populations were distinctive, while the western subsp. japonica populations had a rather admixed ancestry. The NJ tree (Fig. 3B) indicated the phylogenetic distinctiveness of the eastern gene pool (C Honshu and Kii Peninsula), although the phylogenetic patterns among the six regional populations were rather star-like.
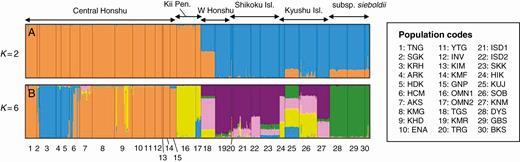
Results of the STRUCTURE analysis represented by the posterior probability of the population memberships (Q-values) of each individual for (A) K = 2 and (B) K = 6.
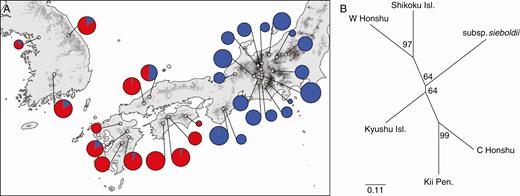
(A) Pie charts of the posterior membership coefficients in the K = 2 genetic clusters identified by STRUCTURE. The open circles indicate the sample locations. (B) Neighbor-Joining (NJ) dendrogram based on Nei’s DA for the six regional populations of M. sieboldii. Bootstrap values over loci are indicated for each node.
CpDNA analysis
The chloroplast genetic markers yielded 18 haplotypes within M. sieboldii and two unique haplotypes in M. sinensis and M. wilsonii, all of which were also identifiable by cpSSRs. The population genetic variation indices of cpSSRs are summarized in Supplementary data Table S3.
The haplotype network (Fig. 4A) indicated that the M. sieboldii haplotypes were clustered into three groups (clusters I–III), all of which differed by at least one nucleotide substitution. The M. sinensis haplotype was involved in cluster II. Magnolia wilsonii, in contrast, had a diverged haplotype, which was at a distance of ten steps from cluster II.
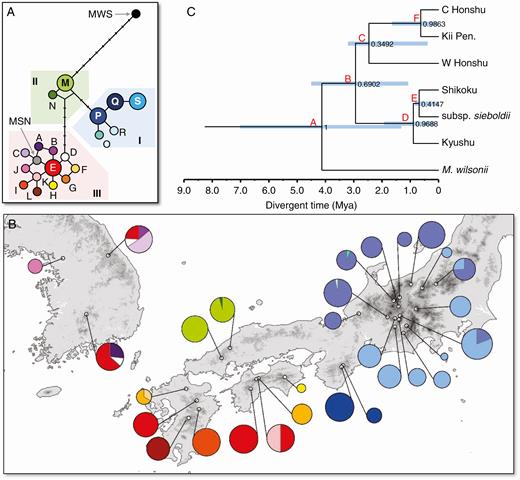
(A) Haplotype network showing the genealogical relationships among the 19 haplotypes detected in M. sieboldii (A–S), as well as M. wilsonii (MWS) and M. sinensis (MSN), and (B) frequencies of haplotypes in each population. (C) Phylogenetic relationships among the six regional populations for the chloroplast gene based on a coalescent analysis in *BEAST. Numbers at the nodes are posterior probabilities. Light blue bars on nodes represent the 95 % HPD intervals for node ages in Ma.
The haplotype composition in each of the populations is illustrated in the form of a pie chart (Fig. 4B). More than two-thirds of the populations were fixed for a single haplotype, although two Korean populations (GBS and DYS) exhibited high polymorphism (four and three haplotypes, respectively). Cluster I and II haplotypes were distributed exclusively in subsp. japonica populations in Central Honshu to Kii Peninsula and in Chugoku District, respectively, while the cluster III haplotypes were shared among subsp. sieboldii and subsp. japonica populations in the Shikoku and Kyushu Islands. The phylogenetic tree obtained in *BEAST (Fig. 4C) indicated a deep divergence between two chloroplast lineages: one contained the japonica populations in Honshu Island (with Cluster I and II haplotypes) and the other contained the japonica populations in Shikoku and Kyushu Islands, as well as the subsp. sieboldii (with Cluster III haplotypes), with short internal branches (Fig. 3C). The divergence time of two major lineages was estimated to be approx. 4.1274 Mya, while the divergence between the subspecies was dated to approx. 0.6883 Mya (Table 2).
| Genes | Nodes | Divergent times (Mya) | |
|---|---|---|---|
| Chloroplast | A | 4.1274 | (1.3126–7.0197) |
| B | 2.9338 | (1.0712–4.5013) | |
| C | 2.4632 | (0.3864–3.2035) | |
| D | 0.8904 | (0.1207–1.9237) | |
| E | 0.6883 | (0.0031–0.845) | |
| F | 0.6301 | (0.0363–1.6473) | |
| Nuclear gene | A | 3.3009 | (1.2593–5.8338) |
| B | 2.5351 | (0.51814–3.3107) | |
| C | 1.075 | (0.5007–1.8791) | |
| D | 0.9045 | (0.3205–1.2067) | |
| E | 0.6179 | (0.2202–0.9258) | |
| F | 0.3356 | (0.0767–0.55) |
The hierarchical AMOVA of cpSSRs revealed a high level of among-population genetic differentiation (70.3 %) vs. among-subspecies differentiation (25.2 %). However, the difference was attributed primarily to the differentiation among the genetic clusters, for which the AMOVA revealed 71.5 % of genetic variation, with only 24.8 % remaining among the populations within the clusters.
A mismatch distribution analysis revealed ragged distributions of pairwise nucleotide differences in each phylogenetic group (Supplementary data Fig. S2) (in both of which P > 0.05; Supplementary data Table S4). However, when each regional group of populations was analysed according to the ecological niche modelling, which showed long-term disjunction of distributions, the eastern populations (Central Honshu and Kii Peninsula and Chugoku District) showed non-significant deviation from the null hypothesis of rapid population expansion (P < 0.05; Supplementary data Table S4).
Nuclear COS gene analysis
The diversity indices of each of the genes (the NH, nucleotide diversity and haplotype diversity) are summarized in Table 3. For Agt1 and PHYA, all of the subspecies-level genetic diversity measures of subsp. japonica constantly exceeded those of subsp. sieboldii. LFY, however, exhibited higher haplotype and nucleotide diversities in subsp. sieboldii, although it harboured fewer haplotypes, suggesting divergence.
Diversity indices of the three nuclear genes analysed in the current study.
| Gene | Agt | LFY | PHYA | ||||||
|---|---|---|---|---|---|---|---|---|---|
| All | sieboldii | japonica | All | sieboldii | japonica | All | sieboldii | japonica | |
| No. of polymorphic sites | 15 | 5 | 1 | 35 | 5 | 11 | 5 | 2 | 0 |
| No. of haplotypes | 10 | 5 | 2 | 10 | 5 | 4 | 6 | 3 | 1 |
| Haplotype diversity | 0.734 ± 0.017 | 0.659 ± 0.018 | 0.063 ± 0.058 | 0.553 ± 0.036 | 0.421 ± 0.039 | 0.647 ± 0.046 | 0.615 ± 0.028 | 0.518 ±0.031 | 0 |
| Nucleotide diversity | 0.00119±0.00008 | 0.00074 ± 0.00004 | 0.00005 ± 0.00005 | 0.00447 ± 0.00056 | 0.00131 ± 0.00014 | 0.00701 ± 0.00055 | 0.00097 ± 0.00005 | 0.00073 ± 0.00005 | 0 |
| Tajima’s D | −1.08277 | 0.07553 | −1.14244 | −1.48681* | −0.0594 | 1.89832* | 0.26606 | 1.51046 | - |
| Fu’s Fs | −1.221 | 0.659 | −1.265 | 1.829 | 0.421 | 6.544* | 0.133 | 2.153 | - |
*P > 0.05
The neutrality tests revealed a significantly negative Tajima’s D value for LFY (Table 3). At the subspecies level, however, LFY had a significantly positive D in subsp. japonica, suggesting balancing selection or population decline. LFY also indicated a potential demographic decline in subsp. japonica, based on the significant Fu’s Fs values obtained. As summarized in Supplementary data Table S5, the KA/KS ratio of the LFY gene was essentially low, whereas one non-synonymous single nucleotide polymorphism (SNP) was found within the subsp. japonica. In contrast, although a valid KA/KS ratio was not obtained for the PHYA gene, two non-synonymous SNPs were contained in the subsp. japonica, leading to inter-subspecies non-synonymous divergence.
The haplotype networks of the nuclear genes are illustrated in Supplementary data Fig. S3. The best-fit models of nucleotide substitution were all different among the COS genes: jModelTest selected the Felsenstein (1981) model (F81) for Agt1, the Jukes–Cantor model for LFY and the Kimura-2-parameter (K80) model for PHYA. The Bayesian phylogenetic inference revealed the presence of distinctiveness between two subspecies of M. sieboldii in all loci (Supplementary data Fig. S4). However, the phylogenetic patterns were not strictly congruent: monophyletic clades were only recognized for the subsp. sieboldii in the Agt1 gene and for the subsp. japonica in the LFY gene. Magnolia sinensis belonged to the lineage of the subsp. japonica in Agt1 and PHYA genes, and to the sieboldii lineage in the LFY gene.
The consensus network that combined the gene trees (Fig. 5A) was split into two major groups corresponding to the subspecies classification, although M. sinensis was associated with the sieboldii group. The phylogenetic reconstruction using *BEAST (Fig. 5B) demonstrated that a deep inter-subspecific divergence occurred around 3.3009 Mya, while the divergence among the regional populations of the subsp. japonica was estimated to first occur at approx.1.075 Mya (Table 2).
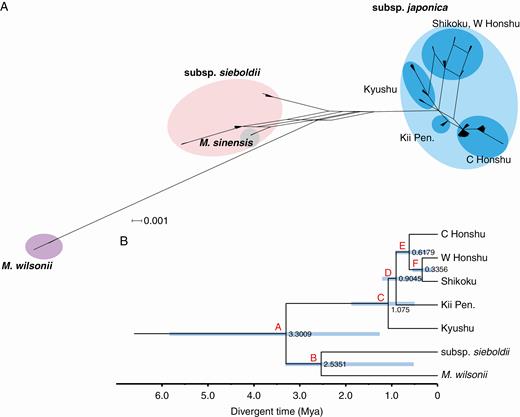
(A) Consensus network generated using Splitstree combining the gene trees for the nuclear COS genes. (B) Phylogenetic relationships among the six regional populations for the nuclear COS genes based on a coalescent analysis in *BEAST. Numbers at the nodes are posterior probabilities. Light blue bars on nodes represent the 95 % HPD intervals for node ages in Ma.
Combined inference of evolutionary history
The intraspecific phylogenetic patterns were incongruent, particularly with respect to the western populations of subsp. japonica, although all genetic marker types showed a major west–east sub-division (Figs 3–5); however, only the nuclear COS genes delineated the subspecies, with the other markers (cpDNA and nSSRs) indicating that the western genetic pool extended into the western half of the japonica populations. This phylogenetic incongruence among markers was potentially the result of either secondary introgression or incomplete lineage sorting.
In the *BEAST analyses, the splits of two major lineages in nuclear and chloroplast phylogenies occurred on similar time scales (3.30 Mya and 4.18 Mya, respectively), and the ages of the internal nodes relating the WJ lineage fell within the range of 0.37–1.08 Mya. Based on these preliminary results, we conducted a scenario selection analysis for three evolutionary scenarios. All scenarios assumed that the major (subspecies) divergence first occurred at time t2 with a prior distribution of 50 360–291 680 generations. The age of the hybridization (scenario 1), the intra-subspecific divergence (scenario 2) and the speciation of the subsp. sieboldii (scenario 3) were all assumed to have occurred at t1, sampled from a prior of 155–96 185 generations (Supplementary data Fig. S5).
The results of 1 million simulations for each scenario showed that scenario 1 (Supplementary data Fig. S5) had a higher posterior probability (0.3420) than did scenarios 2 (0.3281) and 3 (0.3300). The model checking procedure implemented in DIYABC suggested that scenario 1 fitted well with the data, as the observed data centred on the cluster of the posterior predictive distribution in the PCA plot (Supplementary data Fig. 6b). However, we did not obtain significant support using non-overlapping 95 % confidence intervals (CIs; Supplementary data Table S6; Fig. S6a). Moreover, the misclassification rate was high: the type I error for scenario 1 was 0.680 and type II errors for scenarios 1 to scenario 2 and 3 were 0.298 and 0.278, respectively, based on the direct approach.
Ecological niche modelling
A PCA of the climatic factors extracted from the 62 occurrence locations identified four components (with eigenvalues >1) that cumulatively explained 93 % of the total variation. The first component (PC1) accounted for 45 % of the total variation and was positively correlated with precipitation (bio12, bio14, bio17 and bio19), but negatively correlated with seasonality (bio2, bio4 and bio7). In contrast, the second component, PC2, which accounted for 25 % of the variance, was associated with temperature (bio1, bio5, bio6, bio 10 and bio11). The PCA plot revealed a clear niche differentiation between the subspecies, with a between-group inertia value of 0.322 (P = 0.001; Fig. 6). Subspecies japonica occupied a niche with higher rainfall, while subsp. sieboldii occupied a niche with a more continental climate and higher seasonality.
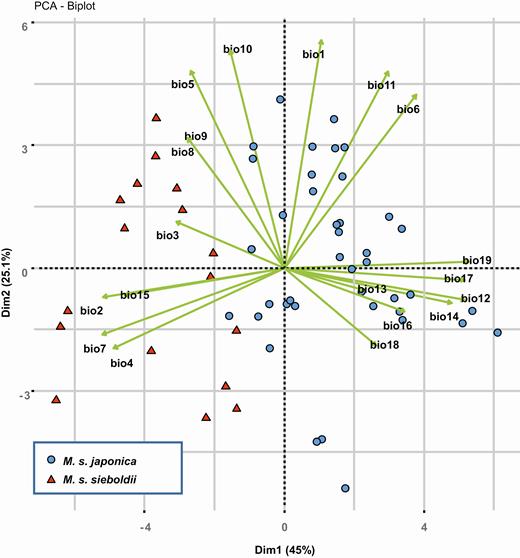
Principal component analysis based on 19 climatic variables at the 62 M. sieboldii occurrence locations.
Therefore, independent species distribution models were constructed for each subspecies that received high AUC scores (>0.99), indicating a good predictive model performance. Niche identity tests confirmed the divergence of the subspecies niches, yielding Schoener’s D (0.224) and Warren’s I (0.489) values that were both significantly (P < 0.05) lower than expected from the null hypotheses (D = 0.731, 95 % CI = 0.726–0.736; I = 0.931, 95 % CI = 0.929–0.937; Supplementary data Fig. S7). However, the niche divergences were not consistently supported by the background similarity tests: the ENM of subsp. japonica was more similar to the background of the range of subsp. sieboldii (D = 0.274, 95 % CI = 0.270–0.279; I = 0.566, 95 % CI = 0.560–0.572) than to that of the occurrence of subsp. sieboldii (t-test, d.f. = 99, P < 0.01), suggesting niche divergence. In contrast, the ENM of subsp. sieboldii was more similar to that of subsp. japonica (t-test, d.f. = 99, P < 0.01) than its background (D = 0.188, 95 % CI = 0.186–0.190; I = 0.444, 95 % CI = 0.441–0.448), suggesting niche conservatism.
The predicted distribution of subsp. japonica covered its known distribution range, including West Japan and East China (Fig. 7). The most important factor (contributing 30.9 % of the variance) was bio17 (precipitation of driest quarter), followed by bio14 (precipitation of driest month) and bio10 (mean temperature of warmest quarter), which contributed 27.9 % and 22.3 % of the variance, respectively. The predicted areas suitable for subsp. sieboldii spanned expansive areas from the central mountains to southern mountains of the Korean Peninsula (Fig. 7). However, the ENM also predicted fragments of ‘empty habitats’ in the Japanese Archipelago, scattered mainly in the pacific side of Central Honshu. The key contributing factors were bio18 (precipitation of warmest quarter; 33.5 %) and bio13 (precipitation of wettest month; 25.1 %).
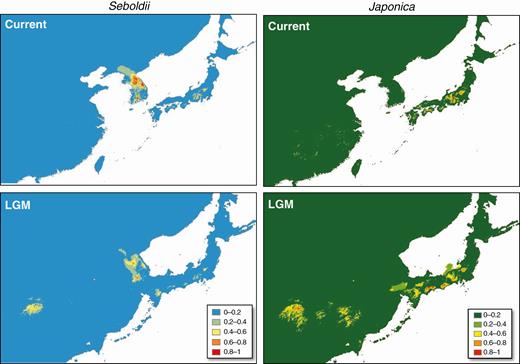
Ecological niche models (ENMs) showing the predicted distributions of the two M. sieboldii subspecies during the current, Last Glacial Maximum (LGM) and Last Interglacial (LIG) periods under the MIROC-ESM climate model.
The potential habitat ranges under the MIROC model (Fig. 7) showed that both subspecies had constant latitudinal distributions during the last glacial cycle. In contrast, the CCSM model predicted that the potential habitats of M. sieboldii were drastically reduced in the Korean Peninsula and Japanese Archipelago (Supplementary data Fig. S8). As the MIROC model is considered more realistic for East Asia than are other models, such as CCSM (Wang et al., 2017), we only considered the MIROC model henceforth.
Under the MIROC model, both subspecies were considered to have undergone vertical shifts in their distribution, as the mean altitude of suitable habitat (grid cells) for subsp. japonica and subsp. sieboldii shifted downward from 1415 ± 11.3 and 529 ± 6.73 m a.s.l. at present to 794 ± 6.8 and 298 ± 13.5 m a.s.l. at the LGM. Although the habitats of subsp. japonica were predicted to remain discontinuous, the fragments of potential areas were expected to have expanded during the LGM. In contrast, subsp. sieboldii was suspected to have declined during the LGM, with the number of grid cells of high existence probability (>0.5) in the Korean Peninsula being reduced from 1872 at present to 511 during the LGM. Although more suitable areas appeared in Japan and China, they were considered ‘empty niches’.
DISCUSSION
Phylogenetic incongruence within M. sieboldii
The key finding of the present study was that all genetic marker types revealed a major (west–east) genetic sub-division (Figs 3–5). However, the boundaries of the gene pools were substantially incongruent. Although the COS genes delineated the subspecies, the other markers (cpDNA and nSSRs) indicated that the western genetic pool extended to the western half of the japonica populations, resulting in the incongruent phylogenetic positions of the western populations of subsp. japonica.
Gene tree incongruence is generally considered as the result of either ancient hybridization or incomplete lineage sorting (Rosenberg, 2002; Maddison et al., 2006; Joly et al., 2009). Our DIYABC analysis did not provide any significant support for a particular scenario, although it favoured the scenario of ancient hybridization. However, the short internal branches leading to western subsp. japonica (WJ) lineages in both chloroplast (Fig. 4C) and nuclear COS (Fig. 5B) genes were topological features of phylogenetic incongruence caused by hybridization (Holder et al., 2001).
In any case, the extreme phylogenetic incongruence between nuclear markers may not be explained only by neutral processes: although the assayed nuclear sequences indicated no clear sign of divergent selection, with the exception of intra-subspecific non-synonymous variation within the subsp. japonica, the distinct inter-subspecies divergence detected only by the nuclear COS genes is considered to be driven by non-neutral processes, including divergent selection, adaptive introgression or genomic hitchhiking, which might not be accurately modelled by coalescent approaches (Padhukasahasram et al., 2008). Divergent selection can make diverse contributions to heterogeneous genomic divergence, and even neutral loosely linked loci can show a deeper divergence than do neutral unlinked loci (Nosil et al., 2009); moreover, heterogeneous interspecific divergence or an introgression pattern among nSSRs and sequenced loci have been demonstrated (Chen et al., 2017; Daïnou et al., 2017).
Nevertheless, to identify the evolutionary scenario that led to the phylogenetic incongruence in M. sieboldii, more detailed genomic information and more efficient simulation methods, such as forward-time simulations (Padhukasahasram et al., 2008), are required in a future study.
Divergence of the subspecies
Although East Asia was once viewed as a single sanctuary for Tertiary relict trees, currently a clear floristic division of the region into two northern and southern sections is recognized (Donoghue et al., 2001; Milne and Abbott, 2002). The northern section comprises North-east China, Korea and Japan, while the southern region extends from South-east China to the Himalayas and West Japan. These areas have been separated by an east–west-oriented arid climate zone (‘aridity barrier’) that has existed since the Eocene. This aridity belt retreated once during the Miocene because of humidification, and redeveloped as the late Miocene progressed (Tiffney and Manchester, 2001; Guo et al., 2008). This could have allowed the migration and subsequent sub-division of some Tertiary relict floras (Milne and Abbott, 2002), such as seen in Juglans (J. cathayensis and J.mandshurica, Bai et al., 2016) and Hamamelis (H. mollis and H. japonica, Xie et al., 2010).
Our estimation of the subspecies divergence (t2) was ancient, around 3.3–4.2 Mya in the Pliocene. This was somewhat more recent than the previously reported ages of the Asian sub-division in Juglans and Hamamelis (10.93 and 10.6 Mya, respectively). Subspecies sub-division in M. sieboldii might be triggered by additional cooling in late Miocene to early Pliocene (Zachos et al., 2001). Although the divergence time estimate was also much younger than the estimated divergence time of the subspecies (approx. 15–20 Mya) in Nie et al. (2008), it is likely that the multicalibration used in this study provided more robust estimates.
Although the subspecies rank was applied, the ancient divergence between the subspecies could be adequate for the evolution of the distinctive ecological traits. An early study (Ueda, 1980) recognized niche divergence between the subspecies based on altitudinal range, vegetation type and topography, together with distinctive morphological differences. The results of the present study further revealed a significant differentiation in the climatic envelopes occupied by the subspecies (Fig. 6). Although the background similarity test indicated niche divergence in one direction (japonica vs. the sieboldii background) and niche conservatism in the other (sieboldii vs. the japonica background), such counterintuitive results could be driven by the heterogeneity of the environments available for the two subspecies, implying that the changes in climatic preferences were forced to a certain degree (Nakazato et al., 2010). The PCA plot illustrates that precipitation in winter was a major factor that differentiated the habitats of the subspecies (Fig. 6); subsp. japonica preferred humid environments with higher winter precipitation, while subsp. sieboldii occupied drier, continental environments.
Ancient introgression among the subspecies
Introgression is a phenomenon that is quite common in plants and has a major impact on plant diversification and speciation (Rieseberg and Wendell, 1993). The disentangling of ancient hybridization and introgression among lineages that are no longer sympatric is hampered by methodological challenges (Twyford and Ennos, 2012); however, the existence of new variants in the introgressed genes (i.e. cpSSRs) is a typical sign of ancient introgression (e.g. Kikuchi et al., 2010; Godbout et al., 2012).
Although the DIYABC analysis performed here failed to identify plausible evolutionary scenarios, the estimated divergence time of the WJ lineage suggests that secondary introgression may have occurred during the Pleistocene (approx. 1.08 Mya or later). During the Pleistocene, the Korean Peninsula and the Japanese Archipelago were repeatedly connected and disconnected via land bridges (Maruyama et al., 1997; Kitamura and Kimoto, 2006). These geomorphological circumstances and climatic oscillations in the Pleistocene may have facilitated range shifts in, and secondary contact between, diverged intraspecific lineages of M. sieboldii. The prediction under the two extremes in the last climatic cycle could provide insights into the potential range shifts (and, moreover, the possibility of sympatric distribution) during past glacial cycles. The model under the LGM predicted the occurrence of subsp. japonica on the Jeju and the Tsushima Islands (Fig. 7), allowing parapatric distribution of sieboldii and japonica, suggesting that there were infrequent opportunities of secondary contact. However, the Jeju Island, currently the southernmost distributed area of the subsp. sieboldii but not involved in this study, may have served as a contact zone.
Phylogeography of Magnolia sieboldii
Magnolia sieboldii subspecies typically grow in vegetation zones ranging from upper cool-temperate to lower cold-temperate coniferous forests (Ueda, 1980). However, they are confined to a lower latitude than expected based on the biomes in which they are found. The ENMs for the subspecies (Fig. 7) suggested that precipitation-related factors contributed significantly to their distributions (see above).
During the last glacial cycle, both subspecies were predicted to persist in stable latitudinal distributions by migrating to lower altitudes. Although this pattern is inconsistent with the general predictions of extensive latitudinal range shifts in temperate biomes (Harrison et al., 2001; Cao et al., 2016), similar patterns have been reported in some humid-dependent plants of Tertiary relics in South-east China and West Japan (Qi et al., 2014; Tang et al., 2018). Moreover, recent molecular phylogenetic studies have identified multiple glacial refugia for boreal and temperate flora in the Korean Peninsula (Zhang et al., 2014; Chung et al., 2017). Therefore, M. sieboldii is a plant type that survived according to the ‘phalanx’, model rather than the ‘pioneer’ model (Hewitt, 1996), under stable refugia in East Asia. The intra-subspecific phylogeographic histories were contrasting between the subspecies. The subsp. japonica showed strong evidence of long-term sub-division according to geographic regions. The potential distribution was never continuous at any of the available paleoclimatic points (Fig. 7), and matched well the sub-divided genetic structures (Figs 4B and 5). Conversely, a higher landscape connectivity during the LGM was predicted for subsp. sieboldii, and a much lower number of genetic structures was observed in subsp. sieboldii (Figs 3 and 5), with the exception of the BUK population, which was fixed with a unique chloroplast haplotype (Fig. 4B).
Within subsp. japonica, it was notable that the eastern populations were associated with higher inbreeding coefficients at nSSRs (Supplementary data Table S3). This may be at least partially explained by the presence of null alleles in the markers; however, it may also be attributed to more pronounced effects of genetic isolation in small populations in Central Honshu, as suggested in our previous studies (Kikuchi and Isagi, 2002, 2004). The results of a mismatch distribution analysis of the chloroplast data suggest that the Central and Western Honshu populations may have once severely contracted into a few refugia.
Phylogenetic utility of COS genes
The high variability of COS genes has enabled the uncovering of the phylogeny of plant species (Sang, 2002; Babineau et al., 2013; Zimmer and Wen, 2013). The COS genes assayed in the present study (Agt1, LFY and PHY) are markers that were identified as being universally accessible in a wide range of angiosperms (Sang, 2002; Li et al., 2008) and in Magnoliaceae (Nie et al., 2008). The present study further proved the utility of COS genes in the intraspecific phylogeography of magnolias. In addition, the nature of biparental inheritance of nuclear genes facilitates the untangling of the complex processes in the course of speciation, including hybridization and polyploidization (Brysting et al., 2007; Peng and Wang, 2008). Here, a deep divergence between the taxonomically recognized subspecies of M. sieboldii could not have been uncovered without the application of COS markers, suggesting the utility of COS genes for disentangling the evolutionary process of plants. However, even the COS genes showed some phylogenetic incongruence, especially in the positioning of M. sinensis. The understanding of the evolutionary process of the sect. Oyama will require more powerful genomic approaches in a future study.
Conclusions and future prospects
A combination of ecological niche modelling and genetic analysis revealed the evolutionary history and the phylogeography of M. sieboldii. The divergence of the two subspecies was deep, and potentially occurred during the Pliocene. Moreover, the data showed a pronounced intraspecific phylogenetic incongruence that might be the result of secondary contact and introgression during the Pleistocene. The evolutionary dynamics of M. sieboldii may have been driven by major paleogeographic and paleoclimatic events that occurred during the Neogene and Pleistocene in East Asia, including global cooling, climate oscillations and the formation of land bridges. It was also suggested that both subspecies were humidity dependent, although they were adapted to differentiated climate conditions and persisted under the late Pleistocene via altitudinal range shifts.
However, the limited genomic information and geographic samples could have hampered the understanding of the evolutionary dynamics of the species. Moreover, the intermediate traits in floral morphology observed in the WJ populations (S. Kikuchi, unpubl. res.) suggest the introgression of functional genes. Further studies employing genomic scan techniques and more extensive sampling activities would offer more accurate insights into the genomic patterns of divergence and introgression.
SUPPLEMENTARY DATA
Supplementary data are available online at https://dbpia.nl.go.kr/aob and consist of the following. Figure S1: plot of the delta K values from STRUCTURE runs for K = 2 – 10. Figure S2: mismatch distributions of cpDNA haplotypes for each phylogenetic group. Figure S3: haplotype networks of three nuclear genes. Figure S4: gene trees for the nuclear COS genes constructed using Bayesian inference. Figure S5: three competing scenarios of M. sieboldii lineage divergence and introgression. Figure S6: results of a logistical model comparing the posterior probability of each scenario, and PCA analysis based on the posterior distributions of scenario 1. Figure S7: results of the niche identity tests and background similarity tests. Figure S8: ecological niche models showing the predicted distributions of the two M. sieboldii subspecies during the Last Glacial Maximum. Table S1: primer sequences for PCR amplification and sequencing. Table S2: list of sequences obtained from GenBank. Table S3: within-population genetic diversity indices of the 30 populations studied. Table S4: results of mismatch distribution analysis for chloroplast DNA data for two phylogenetic groups and regional groups of populations. Table S5: non-synonymous to synonymous ratio of inter-subspecies divergence and intra-subspecies diversity. Table S6: posterior probability of each DIYABC scenario in the preliminary analysis.
ACKNOWLEDGEMENTS
We would like to express our deepest appreciation to Dr Jong-Hwan Lim, Korea Forest Research Institute, and Mr Woo-Sung Kim, who was a research assistant of Korea Forest Research Institute, for their help in collection of M. sieboldii subsp. sieboldii samples in the Republic of Korea. We also thank Mr Hideo Ihara, the Sapporo Yurigahara Park, for sending us M. sinensis samples. Our colleague Dr James Worth gave us valuable comments that greatly improved the manuscript.
FUNDING
This study was financially supported by the the Japanese Society for the Promotion of Science (JSPS KAKENHI grant number 17H00797).
