


Abstract
Hosting several global biodiversity hotspots, the region of the Qinghai-Tibetan Plateau (QTP) is exceptionally species-rich and harbours a remarkable level of endemism. Yet, despite a growing number of studies, factors fostering divergence, speciation and ultimately diversity remain poorly understood for QTP alpine plants. This is particularly the case for the role of hybridization. Here, we explored the evolutionary history of three closely related Gentiana endemic species, and tested whether our results supported the mountain geo-biodiversity hypothesis (MGH).
We genotyped 69 populations across the QTP with one chloroplast marker and 12 nuclear microsatellite loci. We performed phylogeographical analysis, Bayesian clustering, approximate Bayesian computation and principal components analysis to explore their genetic relationship and evolutionary history. In addition, we modelled their distribution under different climates.
Each species was composed of two geographically distinct clades, corresponding to the south-eastern and north-western parts of their distribution. Thus Gentiana veitchiorum and G. lawrencei var. farreri, which diverged recently, appear to have shared at least refugia in the past, from which their range expanded later on. Indeed, climatic niche modelling showed that both species went through continuous expansion from the Last Interglacial Maximum to the present day. Moreover, we have evidence of hybridization in the northwest clade of G. lawrencei var. farreri, which probably occurred in the refugium located on the plateau platform. Furthermore, phylogenetic and population genetic analyses suggested that G. dolichocalyx should be a geographically limited distinct species with low genetic differentiation from G. lawrencei var. farreri.
Climatic fluctuations in the region of the QTP have played an important role in shaping the current genetic structure of G. lawrencei var. farreri and G. veitchiorum. We argue that a species pump effect did occur prior to the Last Interglacial Maximum, thus lending support to the MGH. However, our results do depart from expectations as suggested in the MGH for more recent distribution range and hybridization dynamics.
INTRODUCTION
The establishment of remarkable levels of biodiversity in mountain systems may result from dynamic geological processes combined with climate fluctuations (Hoorn et al., 2010; Antonelli et al., 2013; Favre et al., 2015; Cheng et al., 2018; Muellner-Riehl, 2019; Perrigo et al., 2019), as stated in the mountain geo-biodiversity hypothesis (MGH, Mosbrugger et al., 2018). On the one hand, high ruggedness would not only foster the immigration of pre-adapted lineages, but would also help buffer against extinction during climate modifications by providing suitable habitats within short dispersal distances. On the other hand, climate fluctuations would generate a so-called species pump effect (Muellner-Riehl, 2019) by causing repeated modifications of species’ distributions. In such a dynamic system, populations would encounter cycles of fragmentations (possibly involving allopatric divergence) and secondary contacts, when hybridization may occur (Hewitt, 2000; Abbott et al., 2013; Ru et al., 2018). The role of hybridization as a source of biological novelty remains poorly known in the region of the Qinghai-Tibetan Plateau (QTP), particularly in the context of the MGH.
The region of the QTP, including hotspots of biodiversity such as the mountains of Southwest China and the Himalayas (Myers et al., 2000; Marchese, 2015), harbours a rich and rather young flora with a high proportion of endemics. This region has been identified as the biogeographical source area for several large alpine lineages, such as Gentiana (Favre et al., 2016), Saxifraga (Ebersbach et al., 2017) and others (Hagen et al., 2019). Moreover, multiple explosive radiations, which make up an important portion of the local flora (Wen et al., 2014), seem to have occurred within the last five million years, thus significantly overlapping with climatic fluctuations (Muellner-Riehl et al., 2019) and providing some support to the MGH. The geological and climatic history of the QTP is very complex, and some debate still persists with regard to the timing and sequence of geological and climatic events. Following the collision of the Indian plate with Eurasia ~55–40 Ma, the uplift and expansion of the QTP proper was continuous, with a final extension after 10 Ma (Favre et al., 2015). Towards the end of this process (from approximately the beginning of the Miocene to today), massive mountain ranges emerged, including the Hengduan Mountains and the Himalayas (Favre et al., 2015). In contrast to the QTP proper, these mountain ranges are characterized by high ruggedness. Within this timeframe, the onset of the monsoon system occurred (Lu and Guo, 2014). Today, the complex topography of this area profoundly impacts regional patterns of precipitation, radiation, wind activity, water vapour transmission and soil characteristics, creating a variety of local small-scale environments on the QTP (Scherrer and Körner, 2011; Cheng et al., 2018). A plethora of studies on organismic evolution in mountain systems have associated geological events with diversification (Muellner-Riehl et al., 2019), yet a number of radiations seem to have started long after the onset of these geological processes (Hughes and Aitchison, 2015), thus hinting at a role for climate modifications in divergence and diversification, especially in the last few million years (Muellner-Riehl et al., 2019). Indeed, glacials and interglacials in the QTP region drastically modified the distribution of species, by causing fragmentation of their distribution range, or, to the contrary, favouring secondary contacts between recently diverged lineages (Wen et al., 2014). In fact, several botanical studies on the origin of the flora of the region of the QTP have suggested that the uplift of the plateau as well as climatic fluctuation significantly promoted diversification (Qiu et al., 2011; J. Q. Liu et al., 2014; Wen et al., 2014; Favre et al., 2015). Several recent studies have investigated the speciation process in alpine plants in the region of the QTP, as for example in Quercus (Meng et al., 2017), Saxifraga (Ebersbach et al., 2017; Gao et al., 2017), Rhodiola (Li et al., 2018), Spiraea (Khan et al., 2018) and Allium section Sikkimensia (Xie et al., 2019). However, only very few studies of the QTP’s flora have investigated the frequency and the role of hybridization in this process, as for example in Pinus densata (Ma et al., 2006), Picea purpurea (Y. S. Sun et al., 2014), Ostryopsis intermedia (B. B. Liu et al., 2014) and Cupressus duclouxiana (Ma et al., 2019). Hence, in large genera that have radiated recently, such as Gentiana, the frequency and the role of hybridization remain poorly known.
Gentiana is a large alpine genus including ~362 species (Ho and Liu, 2001), which occur in numerous mountain systems of the world. Hosting about 250 species (Ho and Pringle, 1995), the QTP and the surrounding mountain systems are the main centre of diversity for Gentiana and act as the primary source region for the colonization of a number of other mountain systems around the world (Favre et al., 2016). Similar to many other alpine taxa (Matuszak et al., 2016; Ebersbach et al., 2017; Yu et al., 2017), topographical and climatic changes associated with the uplift of the QTP were suggested to have triggered the more recent divergence events within the genus (Zhang et al., 2007, 2009; Lu et al., 2015; Favre et al., 2016; Fu et al., 2018). Although the biogeography and diversification of Gentiana at deeper times are well known, the actual mechanisms by which speciation has occurred within the genus have been overlooked. That is why, in this study, we focused on three closely related species endemic to the QTP: G. veitchiorum Hemsley, G. lawrencei var. farreri T. N. Ho and G. dolichocalyx T. N. Ho. The three species are perennials used in traditional Chinese and Tibetan medicine, and all belong to section Kudoa (Masamune) Satake & Toyokuni ex Toyokuni series Ornatae Marquand (Ho and Liu, 2001). As is the case in the Flora of China for Gentiana, some authors treat them as distinct species, whereas others consider G. dolichocalyx as a synonym of G. lawrencei var. farreri (Ho and Pringle, 1995).
Here, we investigated the population genetic structure and demographic history of the three Gentiana species, based on analysis of cpDNA and nuclear microsatellite loci, to (1) detect possible hybridization events between G. veitchiorum and G. lawrencei var. farreri, (2) explore genetic divergence between these species and identify factors contributing to it and confront our results with the MGH, and (3) confirm the taxonomic position of G. dolichocalyx.
MATERIALS AND METHODS
Study species and sampling
Among the 16 species in the series Ornatae, G. veitchiorum and G. lawrencei var. farreri are among the most common throughout the QTP, with significant overlap in their distribution range. These two species are easily distinguished from each other by differences in the morphology of their leaves, basal rosette and corolla (Ho and Pringle, 1995). In comparison, G. dolichocalyx has a very limited distribution range. This species is morphologically similar to G. lawrencei var. farreri with only minor morphological difference in the length of calyx tube and calyx lobes. Gentiana lawrencei var. farreri has a long calyx tube of 1.5–1.6 cm, which is one-third as long as the corolla, and calyx lobes that are at least 1.5 times longer than the calyx tube. In comparison, G. dolichocalyx has a calyx that is two-thirds to three-fifths as long as the corolla, with calyx lobes that are 2.3–3.5 cm long (Ho and Pringle, 1995; Ho and Liu, 2001).
We sampled 32 populations of G. veitchiorum throughout the QTP, totalling 410 individuals for this species (Supplementary Data Table S1, Fig. 1). A total of six populations of G. dolichocalyx were collected. For these, typical morphological trait values were verified, with a total of 69 individuals identified whose calyx lobes were about twice as long as calyx tubes. Finally, we used 410 individuals originating from 31 populations of G. lawrencei var. farreri described in Fu et al. (2018). Young leaves were dried in silica gel, and voucher specimens were deposited in the herbarium of the School of Life Science at Luoyang Normal University.
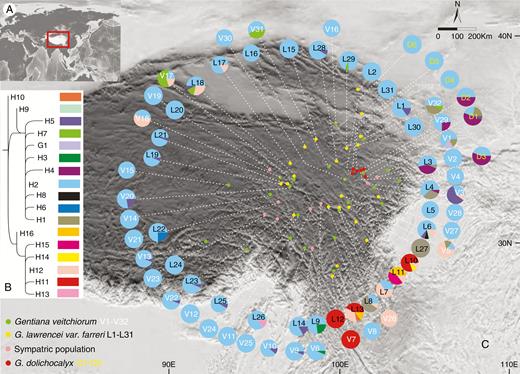
Geographical distribution of 17 cpDNA haplotypes recovered from 69 populations of Gentiana veitchiorum (L1–L31), G. lawrencei var. farreri (V1–V32) and G. dolichocalyx (D1–D6). (A) Distribution area of the three Gentiana species. (B) Phylogeny of chloroplast haplotypes detected in all three species (detailed tree with outgroups is presented in Supplementary Data Fig. S1). (C) Pie charts showing frequency of haplotypes for each sampling site (green dots, G. veitchiorum; yellow dots, G. lawrencei var. farreri). Pink dots represent localities where G. veitchiorum and G. lawrencei var. farreri are sympatric.
Molecular data acquisition
Total genomic DNA was extracted with a Dzup plant genomic DNA extraction kit (Sangon, Shanghai, China). The chloroplast gene ycf1, which was identified as polymorphic in a preliminary plastid genome comparison (Sun et al., 2018b), was amplified via PCR reactions according to Fu et al. (2018). The PCR products were sequenced on an ABI 3730XL automated capillary sequencer (Applied Biosystems, Foster City, CA, USA) with BigDye v3.1 chemistry (Applied Biosystems). In addition, and in order to confirm the systematic position of G. dolichocalyx, internal transcribed spacer (ITS) sequences and plastome sequences of closely related species were downloaded from GenBank or amplified in the laboratory (Supplementary Data Table S2).
All of the samples were genotyped at 12 microsatellite loci (Law4, Law5, Law24, Law32, Law37, Law41, Law45, Law57, Law71, Law77, Law88 and Law95), which were amplified and genotyped as described by Sun et al. (2018a). The forward primer 5′ ends were labelled with a fluorescent dye (FAM, ROX or HEX) (Sangon Biotech, Shanghai). The PCR reactions and profiles followed Sun et al. (2018a). The PCR products were detected using a 3730XL Genetic Analyzer (Applied Biosystems). Allele sizing was performed using GeneMapper v 4.0 (Applied Biosystems) by comparing alleles with a GeneScan-500LIZ size standard (Applied Biosystems).
Sequence data analysis
Chloroplast sequences were aligned and edited with Geneious PRO 3.5.6 (Kearse et al., 2012). Haplotypes were identified in DnaSP 5.1 (Librado and Rozas, 2009) and new sequences were deposited in GenBank (accession number MH481836). Gene diversity (h), nucleotide diversity (π) indices and FST were estimated in Arlequin 3.5 (Excoffier and Lischer, 2010). To estimate differentiation among populations, the coefficients of differentiation GST and NST were calculated using PERMUT (Pons and Petit, 1996). Spatial genetic structure of cpDNA data were analysed with SAMOVA 1.0 (Dupanloup et al., 2002). We used hierarchical analysis of molecular variance (AMOVA; Excoffier et al., 1992) to further quantify genetic differentiation in Arlequin with 1000 permutations. To build the phylogenetic relationship among haplotypes, maximum likelihood (ML) analyses were conducted with PhyML 3.0 (Guindon and Gascuel, 2003) using the HKY model, which was estimated in jModelTest 2.1.7 (Darriba et al., 2012). We extracted the sequences for outgroups from the plastid genomes of Gentiana straminea (NC_027441) and G. stipitata (NC_037984). We tested the robustness of the ML tree using 1000 bootstrap replicates. The median-joining (MJ) haplotype network was calculated with Network 4.6 (Bandelt et al., 1999).
To confirm the systematic position of G. dolichocalyx, protein-coding genes of each plastome were extracted in PhyloSuite (Zhang et al., 2018). Each gene was aligned using MAFFT (Katoh et al., 2002) and manually adjusted in Geneious PRO 3.5.6 (Kearse et al., 2012). A plastome matrix was constructed and comprised 65 shared protein-coding genes after the removal of genes (ndh, ycf15 and infA) that were absent in some species, and a gene with high sequence variability that made reliable alignment difficult (ycf1). Gentiana straminea and G. stipitata were used as outgroups. Maximum-likelihood analyses, based on plastome matrix and ITS data, were conducted in PhyML 3.0 (Guindon and Gascuel, 2003) with 1000 replicates, using the GTR model, and were estimated in jModelTest 2.1.7 (Darriba et al., 2012). We estimated the divergence times among cpDNA haplotypes using the Bayesian method implemented in BEAST 1.7.5 (Drummond et al., 2012) under the HKY substitution model, the Yule model and an uncorrelated lognormal clock model (Drummond et al., 2006). We constrained one of the nodes with the fossil of section Cruciata by lognormal priors with an offset at 5.0 Ma, a mean of 0.7 and a standard deviation of 1.0 (Favre et al., 2016). We ran three independent Monte Carlo Markov chains with 50 000 000 generations, sampling every 5000th generation and discarding the initial 20 % as a burn-in. Convergence was confirmed in Tracer 1.5 (http://tree.bio.ed.ac.uk/software/tracer/) and judged by effective sample size (ESS) values >200.
For exploring demographic history, Fu’s Fs (Fu, 1997) and Tajima’s D (Tajima, 1989) were also estimated to infer potential population growth or expansion using 10 000 simulations in Arlequin. Mismatch distribution analysis (MDA; Rogers and Harpending, 1992; Harpending, 1994) was used to test the null hypothesis of pure population growth and spatial expansion in Arlequin. We tested the goodness of fit with the sum of squared deviations (SSD) and Harpending’s (1994) raggedness index (HRag) with 1000 replicates. The time since sudden expansion was estimated by the equation t = τ/2kμ (Rogers and Harpending, 1992), where k is the average sequence length used for analysis (408 bp). For the substitution rate μ, we used the mean value of 4.62 × 10⁻⁹ substitutions per site per year based on the lower and upper ranges in angiosperms (Richardson et al., 2001; Luo et al., 2016).
Microsatellite data analysis
For microsatellite data, we checked the presence of scoring errors with Micro-Checker 2.2.3 (Van Oosterhout et al., 2004). Null allele frequency estimates were analysed following the expectation maximization algorithm (Dempster et al., 1977) in FreeNa (Chapuis and Estoup, 2007). Departure from Hardy–Weinberg equilibrium and tests of genotypic linkage disequilibrium were carried out using Arlequin 3.5 (Excoffier and Lischer, 2010). We calculated observed heterozygosity (HO), expected heterozygosity (HE) and pairwise FST using Arlequin 3.5 as well. The fixation index FIS and allele richness (RS) were calculated using FSTAT 2.9 (Goudet, 2001). AMOVA was used to further quantify genetic differentiation in Arlequin with 1000 permutations. We investigated the genetic structure among populations and individuals using the Bayesian clustering algorithm implemented in Structure 2.3.1 (Pritchard et al., 2000). We ran ten independent replicates testing for 1–65 clusters (K). Each run started with a burn-in of 50 000 followed by 500 000 iterations. The most likely true value of K was determined using the second rate of change in the likelihood distribution (ΔK; Evanno et al., 2005) in Structure Harvester 0.6.94 (Earl and vonHoldt, 2012). We performed graphical representation of individual cluster assignments using DISTRUCT 1.1 (Rosenberg, 2004). Principal components analysis (PCA) was performed in GenAlEx 6.5 (Peakall and Smouse, 2012) and visualized using the R program for Statistical Computing (v. 3.3.2; R Core Team, 2013). Discriminant analysis of principal components (DAPC; Jombart et al., 2010) was also employed in R 3.3.2 to explore genetic groups. The lowest Bayesian information criterion (BIC) in DAPC was used to assess the best-supported model and number of groups.
To examine gene flow levels among defined groups, we used Migrate v.3.6 to estimate θ and M using ML inference (Beerli and Felsenstein, 2001; Beerli and Palczewski, 2010). In diploid organisms θ is defined as 4µNe, where µ is the mutation rate and Ne is the effective population size. Conversely, M is expressed as the number of migrants per generation between groups and equal to 4Nem, where m is the proportion of the group composed of migrants. We randomly subsampled each population to the same number of individuals and used a customized matrix model to detect migration between clades. We performed five short chains with 10 000 sampled genealogies each, and three long chains with 200 000 sampled genealogies each. Heating was set with four temperatures (1.0, 1.5, 3.0 and 1000.0).
Simulation and testing of divergence history
Divergent history was modelled through coalescent-based approximate Bayesian computation (ABC; Beaumont, 2010). The four groups of G. veitchiorum and G. lawrencei var. farreri identified by Structure, which were used in migrant estimation, were also used here. Four evolutionary scenarios were compared to explore their divergent history. Scenario 1 assumed that an ancestral population of size NA split t4 generations ago into two daughter populations, G. veitchiorum and G. lawrencei var. farreri, of effective sizes NV and NL, respectively. Populations of G. veitchiorum split t1 generations ago into a south-east group (VSE) and a north-west group (VNW). Populations of G. lawrencei var. farreri split t2 generations ago into a south-east group (LSE) and a north-west group (LNW). In scenario 2, G. veitchiorum had the same evolutionary process as scenario 1; LNW was constituted at t1 generations ago by migrants from VNW and LSE at rates r and 1 – r, respectively. Scenario 3 was similar to scenario 2, but LNW was constituted by migrants from VSE and LSE at rates r and 1 – r, respectively. Scenario 4 assumed that an ancestral population split t1 generations ago into four daughter populations. Coalescent modelling was applied to data on 12 nuclear microsatellites and one chloroplast together using DIYABC 2.1.0 (Cornuet et al., 2014). We assumed that microsatellites evolved under a stepwise mutation model and the cpDNA evolved under the default model, and all individual loci take the same value. A total of 1 000 000 coalescent simulations were run. The four scenarios were subsequently compared based on a direct estimate and a polychotomous logistic approach. Based on the highest-supported scenario, parameters were estimated using a local linear regression on the closest 1 % of the simulated dataset.
Species distribution modelling
Occurrence points of both species throughout their entire distribution range were collected through records of our fieldwork, and from Qinghai-Tibetan Plateau Museum of Biology, Northwest Institute of Plateau Biology, Chinese Academy of Sciences (HNWP). We fitted their climatic niches at present, mid-Holocene (6 kya), LGM (Last Glacial Maximum, 21 kya) and LIG (Last Interglacial Maximum, 120 kya) with different algorithms: SRE (Surface Range Envelope; Busby, 1991), GBM (Generalized Boosting Models (or boosting regression trees, BRT; Friedman, 2001)), GLM (generalized linear models; Peter and John, 1989), CTA (classification tree analysis; Breiman, 2001), ANN (artificial neural network; Ripley, 1996), FDA (flexible discriminant analysis; Hastie et al., 1994), MARS (multivariate adaptive regression splines; Friedman, 1991), RF (random forests; Breiman, 2001) and MaxEnt (maximum entropy; Phillips et al., 2004) in BIOMOD2 (https://rforge.r-project.org/R/?group_id=302) in the R environment through different packages (rworld map, rgdal, dismo, SDMTools). We selected bioclimatic variables that showed low correlation and high informative potential after a jack-knife procedure on all the 19 BIOCLIM variables of the WorldClim dataset (Hijmans et al., 2005). Effectiveness of all the models was evaluated using the true skill statistic (TSS) and receiver operating characteristic (ROC) values >0.7. To identify suitable areas for each period we delimited the data for the PR China region with 2.5 arc-min.
RESULTS
Sequence characters and genetic diversity
All 878 samples were amplified for the ycf1 region and 12 microsatellite loci. The aligned sequence of the ycf1 region was 408 bp in length. The cpDNA dataset consisted of 17 base substitutions (Supplementary Data Table S3) that identified 17 haplotypes (H1–H16, G1) among the three species. Besides 16 haplotypes (H1–H16) identified for G. lawrencei var. farreri (Fu et al., 2018), only one additional and private haplotype (G1) was identified for G. veitchiorum. Populations of G. veitchiorum usually had a haplotype composition identical to those of G. lawrencei var. farreri (Fig. 1) growing nearby. A total of nine haplotypes (H1–H5, H7, H11–H12 and G1) were identified in G. veitchiorum. The number of populations that included a single haplotype in G. veitchiorum and G. lawrencei var. farreri was 18 and 10, respectively, which in total represented 44.4 % of all populations. At the species level, h versus π of G. veitchiorum and G. lawrencei var. farreri were 0.330 versus 0.0033 and 0.503 versus 0.0043, respectively (Supplementary Data Table S1). When G. veitchiorum and G. lawrencei var. farreri were analysed together, GST and NST were 0.454 and 0.611 (P < 0.01), respectively, suggesting a significant phylogeographical structure in these species. The GST of two possible hot-spots was also calculated. The values of GST in the south-east populations (including L10–L13 and V7) and Yushu populations (including L17, L18, L21, V17, V18 and V20) were 0.495 and 0.257, respectively.
All individuals were genotyped at the 12 microsatellite loci. The frequencies of null alleles in the 12 microsatellite loci among all populations were low (ranging from 0.002 to 0.051), and thus all loci were included in the analysis. Pairwise comparisons among the 12 loci revealed no evidence of linkage disequilibrium (P < 0.01). The indices of genetic diversity, including RS, HO and HE, were variable across populations and uniformly high (Supplementary Data Table S1).
Genetic structure and divergence
Spatial analysis of molecular variance of cpDNA data using SAMOVA showed stable FCT values and did not reach a plateau as K increased (Supplementary Data Table S4). The ML trees and the parsimony network of the 17 cpDNA haplotypes (Fig. 1 and Supplementary Data Fig. S1) both clustered into two major lineages: (1) one corresponding to a north-western region, including H1–H9 and G1, which was exclusive in G. veitchiorum; and (2) another one corresponding to a south-eastern area, including H10–H16. The result of molecular dating analysis based on the cpDNA dataset was identical to that of Fu et al. (2018), and estimated that the two lineages diverged 4.89 Ma (95 % highest posterior density 1.61–10.77 Ma). H2 and H12 were distinct high-frequency haplotypes located at the centre of the network (Supplementary Data Fig. S1) and located in both north-western and south-eastern areas (Fig. 1). In G. veitchiorum and G. lawrencei var. farreri, AMOVA based on cpDNA data revealed that −0.29 % of the genetic variance was found between species, 57.87 % among populations within groups, and 42.43 % within populations (Table 1).
AMOVA of the three Gentiana species surveyed for sequence data of cpDNA and microsatellites
| Species | cpDNA | SSR | |||||||||
|---|---|---|---|---|---|---|---|---|---|---|---|
| Source of variation | d.f. | Sum of squares | Variance components | Variation (%) | Fixation Index (FST) | d.f. | Sum of squares | Variance components | Variation (%) | Fixation index (FST) | |
| L + V | Among species | 1 | 5.722 | −0.002 | −0.29 | 0.576 | 1 | 21.023 | 0.024 | 5.59 | 0.123 |
| Among populations within groups | 60 | 363.874 | 0.453 | 57.87 | 60 | 68.984 | 0.029 | 6.71 | |||
| Within populations | 726 | 240.871 | 0.332 | 42.43 | 1581 | 597.737 | 0.378 | 87.69 | |||
| Total | 787 | 610.467 | 0.782 | 1642 | 687.745 | 0.431 | |||||
| L + D | Among species | 1 | 8.658 | 0.032 | 3.84 | 0.501 | 1 | 3.258 | 0.002 | 0.28 | 0.081 |
| Among populations within groups | 35 | 181.433 | 0.382 | 46.27 | 35 | 87.423 | 0.066 | 7.85 | |||
| Within populations | 428 | 176.149 | 0.412 | 49.89 | 947 | 726.414 | 0.767 | 91.87 | |||
| Total | 464 | 366.241 | 0.825 | 983 | 817.095 | 0.835 |
L, Gentiana lawrencei var. farreri; V, G. veitchiorum; D, G. dolichocalyx.
The Bayesian clustering analysis based on the microsatellite dataset suggested K = 4 as the most likely grouping (K = 4, Supplementary Data Fig. S2) when three species were analysed together. This K = 4 grouping was as follows: all G. lawrencei var. farreri individuals from the south-east (Sichuan and Yunnan Province) clustered together (LSE), whereas individuals of this species originating from the north-west (Qinghai and Tibet Province) formed another cluster (LNW). Individuals of G. veitchiorum formed two further clusters representing either the south-east (VSE) or north-west (VNW) part of the species’ distribution area (Fig. 2).
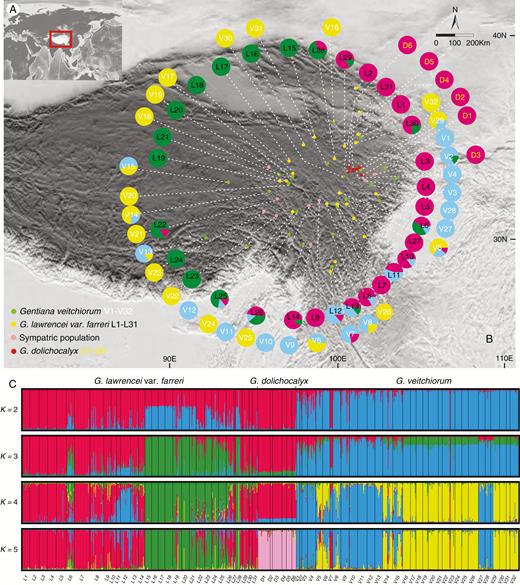
Genetic structure of Gentiana veitchiorum, G. lawrencei var. farreri and G. dolichocalyx based upon a Bayesian approach implemented in the Structure program with microsatellite data. (A) Study area. (B) Geographical distribution of 69 Gentiana populations and their colour-coded groups as recovered in Structure. (C) Bar plots showing probabilities of ancestral clusters of each sample from K = 2 to K = 5. The name of each population is shown below the bar plot.
Hybridization was detected between G. lawrencei var. farreri and G. veitchiorum when K was set to 2, and the hybrids (LNW) were assigned to a separate clade when K was increased to 5 (Fig. 2). Because the Bayesian information criterion from DAPC showed a range of clusters, we use the cluster from Structure to describe clusters in DAPC. The result showed that two clusters identified in DAPC had evident overlap and corresponded to VNW (Fig. 3). The south-eastern clades of the two species (LSE and VSE, respectively) were identified as one separate cluster in DAPC. The hybrids (LNW) were assigned as a separate clade as well. The result of the PCA also showed an overlap between G. veitchiorum and G. lawrencei var. farreri (Fig. 3). The AMOVA results showed that 5.59 % of the genetic variance occurred between G. veitchiorum and G. lawrencei var. farreri, 6.71 % among populations within species, and 87.69 % within populations (Table 1). The FST value of G. veitchiorum and G. lawrencei var. farreri was 0.653 and 0.487, respectively. The pairwise FST between G. veitchiorum and G. lawrencei var. farreri was 0.511.
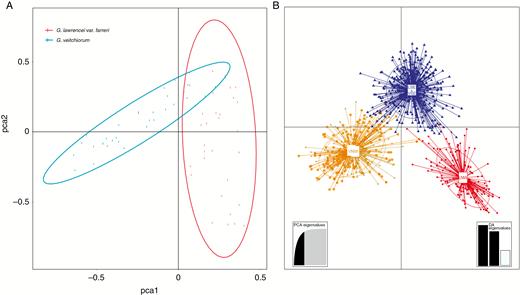
Genetic analysis between Gentiana veitchiorum and G. lawrencei var. farreri based on microsatellite data. (A) PCA result. Each dot represents one population of G. veitchiorum and G. lawrencei var. farreri. (B) Scatterplot of DAPC analysis. Clusters and inertia ellipses are shown in different colours. The orange and grey clusters together correspond to the north-west clade of G. veitchiorum (VNW). The red cluster corresponds to the north-west clade of G. lawrencei var. farreri (LNW). The south-east clades of the two species (LSE and VSE) are represented by the blue cluster. Each dot represents an individual. Insets show histograms of discriminant analysis eigenvalues.
Divergence history and gene flow
We evaluated population divergence based on the combined nuclear and cpDNA data. The ABC simulations showed slightly higher support for scenario 2 (LNW was constituted by migrants from VNW and LSE) with direct estimation (Supplementary Data Table S5). Logistic regression yielded strong support for scenario 2 (Fig. 4), and thus suggested that the north-west group of G. lawrencei var. farreri was constituted by migrants from the north-west group of G. veitchiorum and the south-east group of G. lawrencei var. farreri. Parameter estimation based on scenario 2 showed that the mean value of t1, t2, t3 and r was 2870, 5530, 7840 and 0.501, respectively. When the generation time of the two species was set as 3 years, G. veitchiorum and G. lawrencei var. farreri diverged 23 520 years ago, with the two groups of G. veitchiorum having diverged 16 590 years ago and the partial admixture between these two species occurring 8610 years ago. Although some of the estimated parameters (e.g. t3) may be underestimated, ABC analyses conclusively supported the scenario in which the north-west group of G. lawrencei var. farreri originated from the hybridization between G. veitchiorum and G. lawrencei var. farreri.
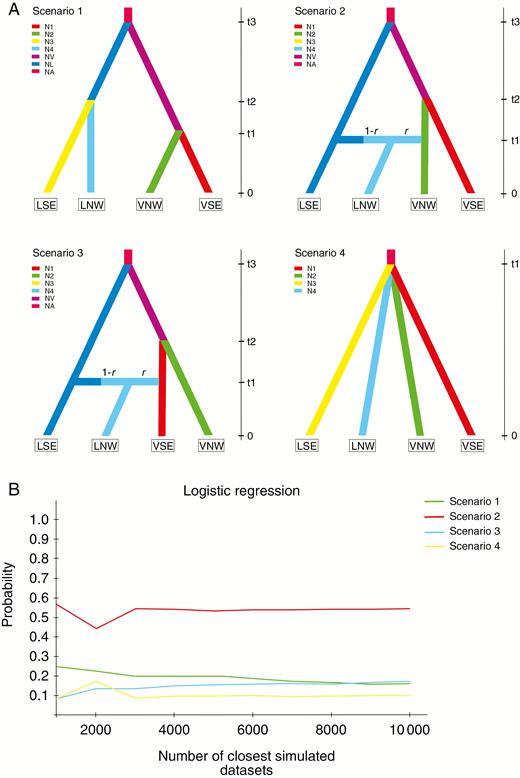
Schematic representation of models tested for Gentiana veitchiorum and G. lawrencei var. farreri population history using approximate Bayesian computation. (A) Tested population divergence scenarios and (B) their posterior probabilities. LSE and LNW represent the south-east group and north-west groups of G. lawrencei var. farreri, respectively, and VSE and VNW represent the south-east and north-west groups of G. veitchiorum. N (N1, N2, …) represents effective population size and t (t1, t2 and t3) represents time of coalescence. Posterior probabilities were estimated based on a polychotomous logistic approach. For details refer to the Materials and methods section.
Gene flow was estimated with Migrate based on the microsatellite dataset among the four genetic clusters (Supplementary Data Table S6). In G. lawrencei var. farreri, migration from LSE to LNW was 3.33 and in the reverse direction it was 3.08. For G. veitchiorum, migration from VSE to VNW was 2.24 and in the reverse direction 0.53. In the south-eastern area, migration from LSE to VSE and the other way around were both estimated to be 2.21. In the north-western area, migration from LNW to VNW was 1.61 and in the reverse direction 0.53. In brief, the analysis showed that there were more migrants within species than between species.
Demographic history and palaeo-distributional reconstruction
The neutrality tests showed the values of Tajima’s D and Fu’s Fs were −0.738 and −0.266, respectively, in G. veitchiorum, −0.789 and −3.414 in G. lawrencei var. farreri, and −0.855 and −3.837 when the two species were combined (Table 2). Although these values were not significant, they suggested that both species underwent rapid expansions in the recent past. Mismatch distribution analysis based on cpDNA data showed ragged distribution in the two species separately and combined, thus rejecting the expansion model (Supplementary Data Fig. S3). However, there was generally a good statistical fit of the pure population growth and/or spatial expansion model (P > 0.05) based on the SSD and HRag statistics (Table 2), indicating that both species experienced such a demographic event. Based on the range expansion calculation, G. veitchiorum and G. lawrencei var. farreri showed range expansion from 1197 and 828 kya.
Neutrality tests and goodness of fit of observed to theoretical mismatch distributions under models of (A) pure population growth and (B) spatial expansion (Rogers and Harpending, 1992) for cpDNA sequence data on the three Gentiana species. Tests were conducted in Arlequin with the sum of squared deviations (SSD) and Harpending’s (1994) raggedness index (HRag)
| Groups | Mismatch distribution | Neutrality tests | |||||||||
|---|---|---|---|---|---|---|---|---|---|---|---|
| Model | SSD | P | HRag | P | τ | Time (kya) | Tajima’s D | P | Fu’s FS | P | |
| Gentiana veitchiorum | A | 0.065 | 0.090 | 0.484 | 0.510 | 4.513 | 1197 | −0.738 | 0.263 | −0.266 | 0.533 |
| B | 0.021 | 0.520 | 0.484 | 0.790 | |||||||
| Gentiana lawrencei var. farreri | A | 0.315 | 0.000 | 0.239 | 0.970 | 3.125 | 828 | −0.789 | 0.234 | −3.414 | 0.164 |
| B | 0.024 | 0.590 | 0.239 | 0.730 | |||||||
| Combined | A | 0.228 | 0.000 | 0.334 | 0.940 | 3.455 | 916 | −0.855 | 0.226 | −3.837 | 0.145 |
| B | 0.023 | 0.520 | 0.334 | 0.780 |
The jack-knife procedure on the 19 BIOCLIM variables supported six bioclimatic variables for each species individually (annual mean temperature, mean diurnal range, isothermality, annual precipitation, precipitation in the driest month, and precipitation seasonality). The suitable areas for each period (current, mid-Holocene, LGM and LIG) were identified for the two species separately. Since the results were almost identical, we present only the results for G. veitchiorum in the main text (Fig. 5) and the results for G. lawrencei var. farreri are presented in the Supplementary Data (Supplementary Data Fig. S4). The palaeo-distributional reconstruction showed that during the LIG both species were restricted to the south-east of the QTP region. During the LGM, the species showed range expansion, mainly northwards along the edge of the QTP and to some extent towards the central plateau. Afterwards, from the mid-Holocene to today, both species expanded continuously. The climatic niche during the past three different periods suggested that both Gentiana species went through continuous expansion, and, contrary to our expectation, did not follow a typical pattern of expansion/fragmentation.
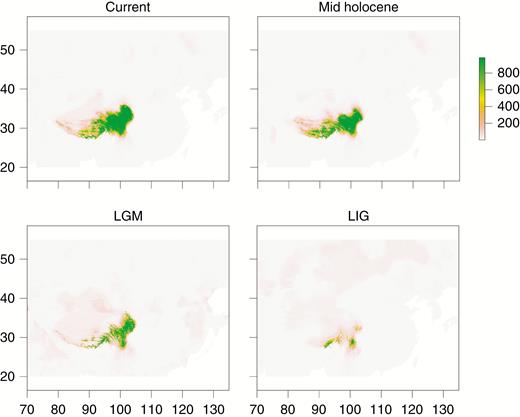
Estimated climatic niches for distribution of Gentiana veitchiorum and G. lawrencei var. farreri combined in the Qinghai-Tibetan Plateau. Maps are shown at present, mid-Holocene (~6 kya), LGM (~21 kya) and LIG (~135 kya). The value of predicted habitat suitability is indicated by the bars to the right of each panel. The vertical and horizontal axes represent longitude (E) and latitude (N), respectively.
Genetic divergence between G. dolichocalyx and G. lawrencei var. farreri
A total of four haplotypes (H1, H2, H4 and H5) were identified in G. dolichocalyx, which were all shared with G. lawrencei var. farreri. At the species level, h versus π and RS/HO/HE in G. dolichocalyx were 0.562 versus 0.0023 and 3.384/0.998/0.777, respectively (Supplementary Data Table S1). Bayesian clustering analysis reconstructed individuals of G. dolichocalyx as part of the LSE cluster of G. lawrencei var. farreri (Fig. 2). The DAPC between G. dolichocalyx and G. lawrencei var. farreri showed the same result as Bayesian clustering analysis, namely that the two species clustered into two groups while G. dolichocalyx was predominantly assigned to the cluster LSE. When K was increased to 5, G. dolichocalyx was assigned to one separate cluster (Fig. 2). Similarly, the two species were shown to be distinct in the PCA (Supplementary Data Fig. S5). AMOVA based on cpDNA data revealed that only 3.84 % of the genetic variance occurred between G. lawrencei var. farreri and G. dolichocalyx, compared with 46.27 % among populations within species and 49.89 % within populations. For the microsatellite dataset, AMOVA revealed that 0.28 % of the genetic variance occurred between G. lawrencei var. farreri and G. dolichocalyx, 7.85 % among populations within species and 91.87 % within populations (Table 1). Based on cpDNA and microsatellite datasets, the FST values for G. dolichocalyx were 0.501 and 0.081, respectively. The pairwise FST between G. lawrencei var. farreri and G. dolichocalyx was 0.012. When compared for the cluster LSE including G. lawrencei var. farreri and G. dolichocalyx, the pairwise FST was 0.011.
Highly congruent levels of support were obtained in ML analysis of the plastome matrix, indicating that G. lawrencei var. farreri and G. dolichocalyx clustered into two clades (Supplementary Data Fig. S5). The ML analysis of ITS data showed different topology with generally lower support values than that of the plastome matrix, showing that G. dolichocalyx and G. lawrencei var. farreri cluster into one clade with moderate support (bootstrap value, 86 %).
DISCUSSION
Recent divergence between G. veitchiorum and G. lawrencei var. farreri
Gentiana veitchiorum and G. lawrencei var. farreri are sister species that can be easily distinguished from each other morphologically. Bayesian clustering and PCA analysis based upon nuclear microsatellites also clearly distinguished G. veitchiorum from G. lawrencei var. farreri. On the other hand, the genetic differentiation between the two species was low, as indicated by the AMOVA analysis based upon both cpDNA and nuclear microsatellite datasets. Based upon cpDNA, the two lineages diverged around 4.89 Ma (yet with large highest posterior density: 1.61–10.77 Ma) during the final extension of the QTP and the uplift of the Hengduan Mountains (Favre et al., 2015, and references therein). This time frame also overlaps with climate fluctuations. Considering their overlapping distribution range distribution patterns, their low genetic differentiation and recent divergence time, it is realistic to hypothesize that the two species arose from a recent speciation event possibly induced by a combination of climatic and geological changes, as is suggested in several other alpine groups (e.g. Luo et al., 2016; Meng et al., 2017). Such recent divergence events, driven by these abiotic factors, may represent a common evolutionary process in Gentiana (Favre et al., 2016), and this has been suggested in section Chondrophyllae (Yuan and Küpfer, 1997) as well as in G. atuntsiensis and G. striolata, which are also distributed in the Hengduan Mountains (Zhang et al., 2007).
Genetic structure and demographic history
Plastid datasets are maternally inherited, and thus can provide insight into past changes in species distribution when colonization occurred via seeds (Petit et al., 2003). Similar to populations of G. lawrencei var. farreri (Fu et al., 2018), populations of G. veitchiorum from the south-eastern edge of the QTP and from the Yushu region contained a high proportion of ancient and exclusive haplotypes, and had higher GST values than in other areas. Since refugia are characterized by high genetic diversity and genetic uniqueness (Hewitt, 2000; Petit et al., 2003), these two regions could be considered as two independent refugia shared by the two Gentiana species. Indeed, the south-eastern edge of the QTP proper was probably one of the most important refugia for many alpine plants during glacial periods (Qiu et al., 2011; J. Q. Liu et al., 2014; H. Sun et al., 2017), including the Yushu area (Qiu et al., 2011; J. Q. Liu et al., 2014; Fu et al., 2016). Based on the nuclear microsatellite datasets in this study, Bayesian clustering analysis showed a population genetic structure of G. lawrencei var. farreri similar to that observed in a previous study (Fu et al., 2018). Bayesian clustering analysis based on the nuclear microsatellite dataset and phylogeographical analysis based on cpDNA data both showed that G. veitchiorum had a genetic structure analogous to G. lawrencei var. farreri, namely that two geographically distinct clades were recovered for each species. This pattern may have arisen following a parallel expansion from the two refugia where both species survived.
The demographic history of G. veitchiorum and G. lawrencei var. farreri, as revealed by cpDNA, indicated that population sizes of both species increased and that range expansion occurred during the last glacial/interglacial cycles. This is consistent with the common assumption that plants usually experienced contraction/expansion over the last glacial/interglacial cycle in the region of the QTP (Qiu et al., 2011; J. Q. Liu et al., 2014). On the other hand, palaeo-distributional reconstruction showed that the respective potential distribution ranges of the two Gentiana species expanded continuously from the LIG to the current period. Such unusual demographic history over the last glacial/interglacial cycle has been discovered in some alpine or subnival plants on the QTP, such as the recent population growth or spatial expansion with stable broad-scale distribution in Eriophyton wallichii, Thalictrum squamiferum and Paraquilegia microphylla (Luo et al. 2016), and stable population distribution in Quercus sect. Heterobalanus (Meng et al., 2017). However, in contrast to these studies, we did not detect an island-like population genetic structure in the two Gentiana species. In contrast to plants of lower elevation, alpine species tend to find more suitable habitats during glacials, as colder climates (vertical displacement) usually imply larger suitable areas in mountain systems (Elsen and Tingley, 2015; Luo et al., 2016; Liang et al., 2018). For both Gentiana species, being alpine, our results fit such expectations. Overall, these results showed that climatic fluctuations, particularly the LGM, probably did not lead to a massive fragmentation of the distribution range of the two species, but rather that glacials may have allowed the species to extend their distribution range in concert.
Hybridization and cryptic speciation
Since the Bayesian clustering analysis supported two overlapping geographical clusters in each species, ABC was performed to explore the evolutionary history of these clusters. Results showed that the probability of G. lawrencei var. farreri and G. veitchiorum both originating in LNW was almost equal, being 0.499 versus 0.501, respectively. This result was consistent with the Bayesian clustering when the two species were clustered into two groups (K = 2). Besides, results of PCA and DAPC both showed overlaps between the two Gentiana species. Gene flow was also detected among these clades. Therefore, it is realistic to hypothesize that the north-west group of G. lawrencei var. farreri was affected by hybridization with G. veitchiorum. Because hybridization was limited to the north-west, it is likely to have occurred within this plateau refugium only, from where a range expansion followed.
Phylogeographical analysis and palaeo-distributional reconstructions indicated that the two Gentiana species shared refugia and experienced similar expansion histories. Besides, G. veitchiorum and G. lawrencei var. farreri are both entomophilous and have matching late-season flowering when pollinators are limited at higher elevation of the QTP (Ho and Liu, 2001; J. Q. Liu et al., 2014). A study on pollination ecology in G. lawrencei var. farreri indicated that a suite of pollinators (mainly Bombus kashmirens, Bombus sushikini, Thripidae and Formica spp.) are necessary to complete pollination (Hou et al., 2009). Given that these pollinators are generalists, and the plants are morphologically similar and flower simultaneously, pollen transfer from one species to the other is more than likely. Only a few studies have dealt with the hybrid origin of taxa in the region of the QTP, yet studies on Pinus densata (Ma et al., 2006), Gentiana straminea and Gentiana siphonantha (Li et al., 2008; Hu et al., 2016), Meconopsis (Yang et al., 2012), Ostryopsis intermedia (B. B. Liu et al., 2014), Picea purpurea (Sun et al., 2014), Ephedra (Wu et al., 2016) and Cupressus duclouxiana (Ma et al., 2019) tend to indicate that this phenomenon might be more common and have played a more important role in speciation than anticipated in this region.
Because the LNW clade, within which hybridization occurred, appears to be a well-supported clade, we raise the question of whether or not we might be confronted with a case of cryptic speciation. Such cases have already been reported in Taxus wallichiana (Liu et al., 2013) and Allium przewalskianum (Liang et al., 2015) in the region of the QTP. However, since low genetic divergence among clusters was revealed by cpDNA data, the phenomenon of ‘cryptic speciation’ could not be confirmed from phylogenetic reconstructions in this study. Further investigation into the general evolutionary history, hybridization dynamics and potential cryptic speciation is warranted for these two species.
Distribution range dynamics through time and the species pump effect
According to the MGH (Mosbrugger et al., 2018), cycles of expansion and fragmentation of distribution ranges would foster divergence and speciation in the region of the QTP. For G. veitchiorum and G. lawrencei var. farreri, the probable modifications of their distribution range through time appears to partially fit such a scenario. First of all, we do find genetic differentiations among populations of both species that can be traced back to two glacial refugia. This indicates that, prior to the LIG, range fragmentation caused sufficient isolation for populations to differentiate, thus lending support to the MGH. However, we do not observe range contraction during the LGM as would be expected, but rather continuous range expansion from the LIG to today. The extreme nature of the LGM might have caused a stronger vertical displacement, allowing greater connectivity of alpine habitats than ever before and thus fostering range expansion. Such a pattern of expansion during the LGM was only rarely found for alpine species of that region (e.g. Luo et al., 2016). Finally, we do find evidence for hybridization between the two species, which would be expected (under the MGH) to occur upon secondary contact as ranges expand. Our data, however, seem to indicate that hybridization occurred within a refugium and was followed by a range expansion of the mixed genomes. Hybridization in glacial refugia has been suggested to have occurred, for example, in Salix (Hardig et al., 2000). In fact, any major shift in distribution range may increase the probability of hybridization, by secondary contact during expansion phases or by shortage of conspecific mates in glacial refugia. We therefore suggest that hybridization may play a role throughout climatic cycles, and not only upon secondary contact as suggested by the MGH.
Systematic position of G. dolichocalyx
There has been considerable discussion regarding the validity of G. dolichocalyx. The first specimens were collected in Hongyuan (Sichuan Province, China) in 1957, with the species described by Ting-Nong Ho in 1985. Ho distinguished the new species from G. lawrencei var. farreri based on calyx lobe length being approximately twice as long as calyx tube length (Ho, 1985). In terms of distribution range, G. dolichocalyx is limited to a small area in the south-east of Qinghai Province and in the north of Sichuan Province, whereas G. lawrencei var. farreri is very common throughout the eastern QTP region. One scholar treated them as distinct but others have considered G. dolichocalyx as a synonym of G. lawrencei var. farreri in Flora of China (Ho and Pringle, 1995). As the relative length of the calyx lobes appears to be variable, we chose only a strict morphological definition for G. dolichocalyx in this study.
Bayesian clustering and DAPC analysis based on nuclear microsatellite loci both strongly supported the grouping of G. dolichocalyx and G. lawrencei var. farreri into one cluster. In addition, the pairwise FST value between G. dolichocalyx and G. lawrencei s.s. was small (0.011–0.012), suggesting very low differentiation. Also, the AMOVA revealed that only a small fraction of the genetic variance (0.28 % for cpDNA and 7.85 % for microsatellite loci) was found between the two species. In contrast, the PCA clearly supported them as two distinct groups, as the phylogenetic analysis based on the plastome matrix strongly supported distinct positions of the two taxa, thus contrasting with the phylogenetic result based upon ITS data. In fact, nuclear microsatellite loci supported G. dolichocalyx as a separate clade when K = 5. Our results clearly show that the two species have only little genetic differentiation, indicating either that they diverged recently or that hybridization had a homogenizing effect. However, if hybridization was so common, then chloroplast capture could be expected. We do not observe such a phenomenon since the two species are clearly distinct in the plastome phylogeny. Therefore, G. dolichocalyx should be considered as a geographically limited and distinct species with only little genetic differentiation from G. lawrencei var. farreri.
Conclusions
We have established, via phylogenetic and population genetic analyses, that G. dolichocalyx is a distinct species with only little genetic differentiation from G. lawrencei var. farreri. Furthermore, we could show that G. veitchiorum and G. lawrencei var. farreri diverged recently, and that each species contained a north-western and a south-eastern clade, probably corresponding to two independent refugia. We argue that this result is in line with a species pump effect, as outlined in the MGH. However, our system appears to depart from the MGH expectations with regard to range dynamics from the LIG to the present (continuous expansion instead of cycles of fragmentation and expansion), and to the expected location of hybridization events (in refugia rather than upon secondary contact). Our study thus contributes to a body of evidence that will ultimately allow in-depth testing of the MGH.
SUPPLEMENTARY DATA
Supplementary data are available online at https://dbpia.nl.go.kr/aob and consist of the following.
Figure S1: phylogenetic relationship among chloroplast haplotypes.
Figure S2: values of ΔK against the assumed number of clusters calculated using Structure.
Figure S3: distribution of the number of pairwise nucleotide differences for chloroplast haplotypes.
Figure S4: estimated climatic niches for distribution of G. lawrencei var. farreri on the Qinghai-Tibetan Plateau.
Figure S5: ML tree based on plastomes and ITS data, and results of PCA between G. lawrencei var. farreri and G. dolichocalyx based on microsatellite data.
Table S1: sample information and genetic diversity in the three Gentiana species.
Table S2: information on sequences used in phylogenetic construction.
Table S3: nucleotide variation of chloroplast haplotypes.
Table S4: results of SAMOVA.
Table S5: results of direct estimation in ABC simulations.
Table S6: gene flow among clades of Gentiana species.
FUNDING
This work was supported by the National Natural Science Foundation of China (31600296), the QingHai Department of Science and Technology (2017-ZJ-Y14) and the Science and Technology Department of Henan Province, China (162102110097). A.F. was supported by the Deutsche Forschungsgemeinschaft (German Science Foundation, AF1117/1–2).
ACKNOWLEDGEMENTS
We thank Yun Han and Gan Xu of Luoyang Normal University for their work in sample collection and Alex Twyford of the University of Edinburgh for comments on the manuscript.
