


Abstract
Hybridization and introgression play an important role in the evolution and diversification of plants. To assess the degree of past and current hybridization, the level of genetic admixture in populations needs to be investigated. Ongoing hybridization and blurred species separation have made it challenging to assign European white oak taxa based on leaf morphology and/or genetic markers and to assess the level of admixture. Therefore, there is a need for powerful markers that differentiate between taxa. Here, we established a condensed set of single-nucleotide polymorphism (SNP) markers to reliably differentiate between the three most common oak species in temperate European forests (Quercus robur, Q. petraea, Q. pubescens) and to assess the degree of admixture in a large set of selected Swiss populations.
A training set of 194 presumably pure reference samples from Switzerland and Europe was used to assign 633 test individuals with two different approaches (population genetic-based/Bayesian vs. assumption-free/discriminative classifier) using 58 selected SNPs from coding regions. Admixture was calculated at the individual and population level with the Shannon diversity index based on individual assignment probabilities.
Depending on the approach, 97.5–100 % of training individuals were assigned correctly, and additional analyses showed that the established SNP set could be further reduced while maintaining its discriminatory power. The two assignment approaches showed high overlap (99 %) in assigning training individuals and slightly less overlap in test individuals (84 %). Levels of admixture varied widely among populations. Mixed stands of Q. petraea and Q. pubescens revealed much higher degrees of admixture than mixed stands of the other two taxon pairs, accentuating high levels of gene flow between these two taxa in Switzerland.
Our set of SNPs warrants reliable taxon discrimination with great potential for further applications. We show that the three European white oak taxa have largely retained their species integrity in Switzerland despite high levels of admixture.
INTRODUCTION
Hybridization and introgression result in genomic admixture of individuals (Mallet et al., 2015). The relevant role that hybridization can play in the evolution and diversification of plants has been long recognized for diverse groups (Rieseberg, 1997; Taylor and Larson, 2019). Hybridization can slow down or reverse differentiation through gene flow and recombination. Moreover, it can lead to adaptive introgression (introgressed and beneficial alleles are maintained by natural selection) possibly followed by the evolution of new lineages (Abbott et al., 2013; Suarez-Gonzalez et al., 2018). Genomes of hybridizing species undergoing differential introgression can become mosaics with cassettes of genomic material from both parental taxa and different extents of genomic differentiation (Wu, 2001; Arnold and Martin, 2009). Knowledge of the genetic and morphological characteristics of a species, its phylogenetic background and ecology is crucial to study hybridization and introgression. Recent advances in molecular methods, such as next-generation sequencing (NGS), DNA barcoding and single-nucleotide polymorphism (SNP) genotyping, have increased the importance of molecular markers for species delimitation. These advances have led to the development of many novel approaches for molecular species assignment and hybrid detection (Twyford and Ennos, 2012). Genomic methods, in particular, have revealed the fundamental role of hybridization in evolution, as conventional morphological techniques are limited in detecting gene flow and introgression (Anderson, 1948; Goulet et al., 2017).
Hybridization is common and occurs in at least 25 % of the plant species (Mallet, 2005). An estimated proportion of 70 % of all angiosperms have originated from interspecific and intergeneric hybridization events (Whitham et al., 1991). Among plants, sunflowers and Louisiana irises represent classical examples of natural hybridization and hybrid speciation (Arnold, 1994; Rieseberg et al., 1995). Likewise, several tree species from genera such as Quercus (oak) and Populus (poplar) are known to hybridize extensively (e.g. Whittemore and Schaal, 1991; Lexer et al., 2005). Oaks have revealed exceptionally high rates of hybridization (Mallet et al., 2015) and thus serve as an ideal study system for species delineation, hybridization, adaptive introgression and selection (e.g. Bacilieri et al., 1996; Dodd and Afzal-Rafii, 2003; Petit et al., 2003). In European white oak species, however, the quantification of admixture and introgression is challenging. Ongoing hybridization due to incomplete reproductive barriers and, hence, high levels of interspecific gene flow blurs species boundaries and makes it difficult to assign taxa based on morphology and/or genetic markers (Curtu et al., 2007a; Gugerli et al., 2007; Viscosi et al., 2009; Gerber et al., 2014; Rellstab et al., 2016a). A study in mixed stands of European white oaks (Quercus robur, Q. petraea, Q. pubescens and Q. pyrenaica) provided strong evidence that hybridization and introgression occur among all four species, with preferential direction of introgression towards the locally most abundant species, leading to asymmetric introgression patterns (Lepais et al., 2009). Such asymmetry can also imply a selective process, which means that alleles of some loci are able to cross species boundaries, whereas alleles of other loci cannot (Harrison and Larson, 2014).
Reliable taxon assignment is the basis for evaluating levels of admixture. The assessment of morphological and genetic variation for taxon assignment in the European white oak species complex remains an ongoing issue. Many studies have tried to disentangle the characteristics and properties of the Q. robur–Q. petraea–Q. pubescens complex at the morphological and molecular levels (e.g. Dupouey and Badeau, 1993; Kremer et al., 2002; Bruschi et al., 2003a; Scotti-Saintagne et al., 2004; Muir and Schlötterer, 2005; Curtu et al., 2007a; Gugerli et al., 2008; Viscosi et al., 2009; Neophytou et al., 2010; Rellstab et al., 2016a). Among these, nuclear microsatellites (nSSRs) have generally been used for genetic differentiation and multivariate analyses of leaf morphological characters for separation based on morphology. Combined approaches based on genetic (nSSRs) and leaf morphological data have been shown to allow taxon assignments with relatively high discriminatory power (Rellstab et al., 2016a). However, neither molecular (Curtu et al., 2007b; Neophytou, 2014) nor leaf morphological (Dupouey and Badeau, 1993; Rellstab et al., 2016a) characters were found to fully discriminate between all species pairs. Moreover, species assignment approaches based solely on morphology might be biased because they do not account for environment-dependent phenotypic plasticity, and it is difficult to differentiate between pure individuals and backcrosses with parent-like morphologies. Viscosi et al. (2009) found that hybrids exhibit an intermediate but highly variable leaf morphology. Nevertheless, hybrid morphology is not necessarily associated with intermediate leaf phenotypes (Truffaut et al., 2017). Likewise, individuals with unclassified leaf morphology can be genetically assigned to pure species, because they represent morphological outliers (Gugerli et al., 2007). Kleinschmit et al. (1995) showed that oak hybrids between Q. robur and Q. petraea seem to preferentially resemble mother-like leaf morphologies, at least as juvenile trees.
The taxonomic status of oak species has been discussed intensively (Burger, 1975; Van Valen, 1976; Muir et al., 2000; Muir and Schlötterer, 2005; Lexer et al., 2006; Muir and Schlötterer, 2006). Because of weak interspecific boundaries, classical species concepts (i.e. biological and morphological concepts) are hardly applicable in oaks. Coyne and Orr (2004) even referred to the genus Quercus as a ‘worst case scenario for the biological species concept’. Consequently, Van Valen (1976) proposed a different species concept that relies on ecological criteria. Species integrity might therefore be maintained by occupying different microhabitats rather than by reproductive isolation. Ecologically mediated stabilizing selection and not just restricted gene flow probably contributes to distinctive species phenotypes (Mayr, 1970; Mallet, 2001).
Despite their ability to hybridize, the species pair Q. robur and Q. petraea (and likewise the pair of Q. robur and Q. pubescens) shows relatively distinct leaf morphological traits (Dupouey and Badeau, 1993) and was demonstrated to be genetically differentiated to a large extent (Scotti-Saintagne et al., 2004). In addition to distinct ecological niches, partial reproductive isolation between the two species due to pre- and postzygotic barriers (Abadie et al., 2012; Lagache et al., 2014; Bodénès et al., 2016) may have contributed to this differentiation and helped to maintain species integrity. Scotti-Saintagne et al. (2004) showed that loci in coding regions expressed higher differentiation between Q. robur and Q. petraea than those in non-coding regions. This result indicates that signals of species divergence are more likely to be found in functional regions of the genome, which are putative subjects to natural selection. These findings are consistent with Guichoux et al. (2013), who showed that FST outlier SNPs, and hence loci putatively under divergent selection (or linked to such loci), are more sensitive to small differences in gene flow between Q. robur and Q. petraea than non-outlier SNPs. Consequently, these findings attest to better results for taxon assignment in oaks when using loci under selection rather than neutral markers and support the idea of an ecological species concept. Quercus petraea and Q. pubescens show weaker genetic differentiation than the former species pair (Bruschi et al., 2000; Salvini et al., 2009) and their leaf morphologies overlap widely (Dupouey and Badeau, 1993; Rellstab et al., 2016a). The lack of molecular and morphological divergence between these two species could be explained by a short phylogenetic distance in combination with extensive gene flow following recent secondary contact after a period of isolation (Bruschi et al., 2000; Leroy et al., 2017). It has also been suggested that levels of introgression in (sub-)Mediterranean Q. pubescens increase, and molecular as well as morphological differentiation to Q. petraea decrease, towards more northern latitudes of its distribution range (Müller, 1999; Franjic et al., 2006; Chybicki et al., 2012). A possible explanation might be found in the interplay of decreasing density of Q. pubescens and of more favourable ecological conditions for hybrids towards Central and Northern Europe (Müller, 1999). Conversely, in Southern Europe, the density of Q. pubescens is increased and heterogeneous ecological conditions along with human impacts have led to scattered stands of Q. petraea (Bruschi et al., 2003b; Salvini et al., 2009). However, the exact mechanisms underlying the postglacial expansion and differential levels of admixture of the species are complex and remain largely unexplored.
In summary, there is a need for molecular markers that reliably discriminate among sympatric white oak species and can assess the degree of admixture between them. Therefore, the aims of this study were (1) to develop a diagnostic SNP set to securely assign the three white oak species Q. robur, Q. petraea and Q. pubescens and (2) to assess the extent of admixture in 31 presumably mixed or admixed populations across Switzerland, focusing mainly on hitherto poorly studied hybridization dynamics between Q. petraea and Q. pubescens. This SNP-based approach aimed at increasing the genotypic resolution of the three species at the individual level, while being applicable for numerous individuals at the same time. Therefore, the number of loci for genotyping should be rather low but high enough for reliable taxon discrimination. In total, we assigned 827 individuals with two different assignment approaches (population genetic-based and assumption-free) using a training and a test set of samples. An admixture index based on assignment probabilities was calculated to assess the level of admixture in individuals and populations. Furthermore, we evaluated the minimum number of markers needed for the correct assignment of pure individuals, the discriminatory power of the SNP set compared to a previously applied approach, genetic differentiation between and within species, and patterns of introgression.
MATERIALS AND METHODS
Study species
Quercus robur, Q. petraea and Q. pubescens are diploid, wind-pollinated, monoecious tree species, occurring over large parts of Europe. Their geographical distribution overlaps widely, but is often restricted to the respective ecological niches of each species. Throughout Europe, these white oaks are of ecological, economic and cultural importance. Quercus robur is abundant in areas with deep, moist soil that expands into riparian hardwood forests, whereas Q. petraea is more drought-tolerant and sensitive to waterlogging at the same time (Cochard et al., 1992; Wagner and Dreyer, 1997). Quercus pubescens as a (sub-)Mediterranean species is capable of surviving extreme drought events (Gallé et al., 2007); in Switzerland, it is mainly found in the low-elevation inner alpine area (Valais) and along the calcareous, south-exposed dry Jura slopes (Hegi, 1958; Müller, 1999). All three species can co-occur in mixed stands, especially Q. pubescens and Q. petraea.
Sampling and DNA extraction
A total of 839 tree samples were genotyped in this study (Supplementary Data Table S1). These samples were initially divided into two sets: a presumably pure sample set and a presumably admixed sample set, classified as follows. The presumably pure sample set consisted of 247 individuals, comprising 199 Swiss samples and 48 samples from across the European range (hereafter referred to as ‘European samples’). Swiss samples originated from Rellstab et al. (2016a) and were selected based on dimension coordinates from a factorial analysis of mixed data (FAMD) presented in that study. Rellstab et al. (2016a) assigned samples to one of the three taxa based on the combination of 13 leaf morphological parameters and eight nSSRs (Guichoux et al., 2011), using the results of this FAMD followed by hierarchical clustering on principal components (HCPC). The top 100–150 individuals of each species with most extreme coordinates were selected (see figure 1 in Rellstab et al., 2016a). Filtering for suitable DNA concentrations and a maximum of three individuals per population resulted in 64, 66 and 69 samples of Q. robur, Q. petraea and Q. pubescens, respectively, representing all the major geographical areas of occurrence in Switzerland. The additional European samples were obtained from collaborators, originated from presumably pure stands with no other nearby species, and were composed of 18 Q. robur (four from Germany, six from France and eight from Sweden), 18 Q. petraea (five from France, six from Spain and six from Great Britain) and 12 Q. pubescens (three from France and eight from Italy) individuals.
The presumably admixed sample set consisted of 592 individuals and originated from various sources across Switzerland: 90 samples from Swiss Evoltree intensive study sites (Lefèvre et al., 2016: http://www.evoltree.eu/index.php/intensive-study-sites/sites/valais), 117 samples from one national seed source and five additional populations sampled for an upcoming study (C. Rellstab, unpubl. res.), 257 samples from populations presented in Rellstab et al. (2016a), and 128 samples from populations newly sampled for the present study. Samples from Rellstab et al. (2016a) were selected based on intermediate FAMD dimension coordinates or originated from highly mixed populations (i.e. with high probability of containing admixed samples) based on HCPC. The new samples were collected from six populations in sympatric regions with potential admixture in the northern part of Switzerland. For this, we collected leaves from 16–26 individuals per population, with a minimum distance of 20 m to restrict the chance of sampling closely related individuals, and dried the leaf tissue in silica gel. In total, presumably pure and admixed samples originated from 82 Swiss populations and 16 populations from six other European countries (Supplementary Data Table S1).
DNA of European samples and newly sampled individuals was extracted from 15 mg dried leaf tissue with a KingFisher 96 system (Thermo Fisher Scientific, Waltham, MA, USA) using the sbeadex maxi plant kit optimized for oak tree leaves (LGC Genomics, Berlin, Germany). Concentrations were measured with Quantus (Promega Corporation, Madison, WI, USA) and DNA quality was checked on a gel (1 % agarose) and with a NanoDrop spectrometer (Thermo Fisher Scientific).
Targeted sequencing of candidate genes in European samples
Rellstab et al. (2016b) used targeted pooled sequencing of 95 targets (94 genes, length 211–518 bp) to study local adaptation in 71 Swiss populations and identified 3576 SNPs. Here, the same 95 targets were individually sequenced in 16 of the 48 European samples (two from Germany, two from Spain, two from Great Britain, two from Sweden, three from Italy and five from France), following the same procedure for library preparation, sequencing, trimming and mapping of the reads as in Rellstab et al. (2016b). FREEBAYES (Garrison and Marth, 2012) was used for variant calling. In addition to default options, the minimum fraction of observations supporting an alternative allele was set to 0.1, the minimum phred-scaled base quality score to 10, the minimum phred-scaled mapping quality score of the corresponding read to 20, and the minimum depth to 4. The output file was then filtered with VCFTOOLS (Danecek et al., 2011), keeping only variants with depth greater than 10, a minimum phred-scaled site quality of 20 and a quality/depth ratio >0.25.
SNP selection
The selection of potentially taxon-diagnostic SNPs was based on existing datasets from two previous studies and the above-described sequencing of European samples. The assignment information of 1369 individuals from 71 populations from Rellstab et al. (2016a) was combined with population allele frequencies of the 3576 SNPs for the same populations (Rellstab et al., 2016b). To select SNPs with potentially discriminating power, population allele frequencies of pure populations were correlated with population-averaged FAMD and linear discriminant analysis (LDA) values (coordinates and taxon proportion) from Rellstab et al. (2016a). An analysis of variance (ANOVA) with taxon identity from these pure populations as the dependent variable and population allele frequencies as the independent variable provided further information of potentially discriminating SNPs. Following Rellstab et al. (2016b), pure populations were defined as those with ≥80 % of individuals of one taxon as defined in the FAMD or LDA, respectively. Only SNPs fulfilling the following criteria were selected: allele frequency difference between at least two populations >0.5; a minimum of 60 out of 71 populations with allele frequency data, a Pearson’s correlation coefficient >0.5 for one of the correlated variables or an F value >4 in the ANOVA. Finally, based on the sequenced targets of the 16 presumably pure European samples described above, taxon-private alleles occurring minimally twice in one taxon were taken into consideration. In the end, a maximum number of three SNPs per target was selected to minimize potential linkage of loci within a target. This resulted in 96 SNPs to be genotyped.
Genotyping
For Kompetitive Allele Specific PCR (KASP) genotyping, sequence information of 50 bp on both sides of the targeted SNP was needed (Supplementary Data Table S2). For this, consensus sequences from all pure and mixed populations (according to Rellstab et al., 2016b) were combined to create an overall consensus sequence per target for primer development. LGC Genomics (Hoddesdon, UK) developed genotyping assays and performed KASP genotyping and subsequent bi-allelic scoring of the 96 SNPs. To remove possibly linked SNPs, linkage disequilibrium was calculated using the package GENETICS (Warnes et al., 2013) in R 3.5.2 (R Core Team, 2018). Only unlinked SNPs (χ 2-based P value for marker independence <0.05) and one of the linked SNPs within a target (with lowest proportion of missing data) were kept for further analyses. Individuals with more than 10 % missing data were excluded from the analyses.
Taxon assignment
Training set.
The workflow for taxon assignment consisted of two major steps: (1) defining the training set, and (2) using assignment information from the training set to assign the test set with two different methods. In the first step, STRUCTURE 2.3.3 (Pritchard et al., 2000) with admixture model and correlated allele frequencies was used to group the individuals of the presumably pure sample set into genetic clusters based on the above defined set of unlinked SNPs. We hereafter refer to this STRUCTURE model as ‘STRUCTURE without USEPOPINFO’. The number of clusters (K) was set to 1–5 with 10 iterations within each level of K and 1 000 000 repetitions after a burn-in period of 100 000 runs. Runs were summarized with STRUCTURE HARVESTER 0.6.93 (Earl and vonHoldt, 2012). Overall posterior probabilities were calculated with CLUMPP (Jakobsson and Rosenberg, 2007), using the FullSearch method for K = 1–3 and the LargeKGreedy algorithm for K = 4–5. We then concentrated on the results of K = 3, the number of taxa involved. To filter the presumably pure sample set (i.e. to minimize the possibility of having hybrids or strongly introgressed individuals in the training set), individuals with a probability <0.9 for a cluster were excluded (Lepais et al., 2009; Neophytou, 2014; Truffaut et al., 2017) and moved to the test set. The remaining individuals were considered as the final training set. The number of allelic differences as a measure of genetic dissimilarity among individuals of the training set was calculated with the function diss.dist of the R package POPPR (Kamvar et al., 2014), and a neighbour-joining tree based on these distances was built with the R package APE (Paradis et al., 2018). Furthermore, average allele frequencies for each taxon of the training set were calculated and a principal component analysis (PCA) of all individuals of the training set was performed with the R package ADEGENET (Jombart, 2008).
Test set.
In the second step, the filtered training set was used to assign the test set, consisting of individuals of the presumably admixed sample set and the removed individuals from the presumably pure sample set. Assignment was performed with two methods, STRUCTURE and support vector machine (SVM). STRUCTURE was run for K = 3 clusters as described above, but with parameters POPFLAG = 1 for training individuals and USEPOPINFO = 1. We hereafter refer to this STRUCTURE model as ‘STRUCTURE with USEPOPINFO’. This model assumes that the training set is correct and clusters the test individuals based on predefined clusters from training individuals (Pritchard et al., 2009). It ensures that the STRUCTURE clusters correspond to pre-defined taxa. The resulting Q-matrix shows estimates of cluster assignment probabilities for training individuals and ancestry coefficients for test individuals. Here, we use the term ‘assignment probability’ for both parameters. In the second approach, the SVM machine-learning implementation of the R package E1071 (Meyer et al., 2018) was used to calculate assignment probabilities for all individuals. Supervised SVMs use a training set and the margin between the closest points (support vectors) of two classes is maximized to find an optimal separating hyperplane in the middle of the discriminant margin. The effect of points on the ‘wrong’ side of the margin is reduced by weighing them down (Meyer et al., 2018). When the model is applied, each sample (training and test set) receives a probability value for belonging to one of the clusters. We tuned our specified predictive SVM model to best fit the STRUCTURE assignment (with USEPOPINFO) of the training set. The optimized model used a linear kernel, a cost parameter of 0.1, and epsilon was set to 1 and tolerance to 0.01. Ten SVM assignments were averaged to account for possible variation among assignments. Pairwise fixation indices (FST) between the three taxon groups (with P values based on 1000 permutations) and locus-specific FST values between taxa were calculated with the R packages HIERFSTAT (Goudet, 2005) and PEGAS (Paradis, 2010), including all individuals with a probability >0.9 in the STRUCTURE assignment with USEPOPINFO. To compare the two assignments with an approach that does not integrate a training set, STRUCTURE without USEPOPINFO was run for all samples with K = 3 clusters. For illustrative purposes, a PCA of all individuals was performed with the R package ADEGENET.
Minimum number of markers required for accurate SVM taxon assignment
To estimate the minimum number of markers for an accurate assignment of the training set, we used the R package ASSIGNPOP (Chen et al., 2018) to identify and rank loci which frequently reveal high FST across subsamples of the training set. This analysis was based on a Monte Carlo cross-validation (10 000 iterations) using 90 % of the training set as random subsample. Running the SVM model with subsequent removal of the lowest ranked marker gave an estimate of the number of markers needed for a correct assignment (>0.9 probability of belonging to the correct cluster) of 95 % of the training set. Results from ten simulations were averaged. To validate the results of this approach, 10 000 iterations with random subsets of loci per number of loci were performed and averaged.
Discriminatory power of the SNP set
To estimate the discriminatory power of the unlinked SNP set, we compared it to data from eight nSSRs described in Rellstab et al. (2016a). All Swiss individuals from the presumably pure sample set were used to perform another STRUCTURE analysis without USEPOPINFO (K = 3) with SNP and nSSR data. Based on posterior probabilities, we removed non-pure individuals (<0.9) from the two datasets and performed a PCA with the genotype data of the remaining individuals. To evaluate the discriminatory power of the two PCAs, a separation/cohesion ratio based on coordinates from the first and second principal components was calculated, following the procedure described in Rellstab et al. (2016a). The higher the separation/cohesion ratio, the larger the distance between clusters and/or the smaller the variation within clusters, indicating a good separation of the clusters.
Genetic admixture and patterns of introgression
We used Shannon’s diversity index (S) based on assignment probabilities from STRUCTURE with USEPOPINFO and scaled it to a range of 0–1, to estimate admixture in individuals. In addition to the STRUCTURE assignment with USEPOPINFO using all three taxa described above, STRUCTURE with USEPOPINFO was also run separately for all three taxon pairs (K = 2). To minimize the effect of the respective third, unstudied taxon, individuals with an assignment probability above 0.1 for this third species cluster were excluded. Only populations with ten or more remaining individuals were considered for analyses at the population level. Per population, we averaged S for the overall (K = 3) and pairwise (K = 2) STRUCTURE assignments. The R package INTROGRESS (Gompert and Buerkle, 2010) was used to look for patterns of hybridization and direction of introgression in pairwise comparisons of the three taxa. Likelihood estimates of a hybrid index (admixture coefficient) were calculated for the same individuals included in the pairwise STRUCTURE analyses described above with parental allele frequencies from pure individuals (based on probabilities from STRUCTURE with USEPOPINFO for K = 3). This hybrid index was then compared to the mean estimated interspecific heterozygosity (i.e. the proportion of alleles inherited from both parental populations) of the individuals (Gompert and Buerkle, 2010). Interspecific heterozygosity is expected to be elevated in first-generation hybrids and backcrosses.
RESULTS
Targeted sequencing of European samples
Of 95 targets, 94 were successfully sequenced (Target 031 failed) and showed an average coverage of 652× and a median of 456×, with a range from 15× to 5573×. The filtering of SNPs resulted in a total of 647 SNPs. From these SNPs, 522 overlapped with the 3576 SNPs found in Rellstab et al. (2016b).
Genotyping
Eighty-nine of 96 SNPs were successfully genotyped using KASP, and 58 of these remained after the removal of linked SNPs (Supplementary Data Table S2). These 58 unlinked SNPs were distributed across 50 targets. Twelve individuals were removed due to >10 % missing data, resulting in 827 genotyped individuals. On average, missing data was 1 % per individual.
Taxon assignment
Training set.
Running STRUCTURE without USEPOPINFO from K = 1 to K = 5 generally indicated a clear separation of the three taxa, but also revealed further substructure in Q. pubescens, with K = 4 having the highest likelihood value (Supplementary Data Fig. S1). Here, we concentrated on the results of K = 3, i.e. the number of species involved. One of ten STRUCTURE runs for K = 3 of the presumably pure sample set yielded a substantially different result, with only two clusters (Q. robur and Q. petraea/Q. pubescens) dominating. This inconsistent run was thus replaced by a supplementary run to reach the envisaged ten runs. A total of 194 (159 Swiss and 35 European) out of 242 (196 Swiss and 46 European) samples remained in the training set after removing presumably non-pure individuals (assignment probability <0.9). The final training set consisted of 76 Q. robur, 66 Q. petraea and 52 Q. pubescens samples. In the STRUCTURE (K = 3) analysis without USEPOPINFO using all individuals, 97.5 % of the training set was assigned correctly (assignment probability >0.9 for the corresponding taxon). The STRUCTURE assignment with USEPOPINFO assigned 99 % of the training set properly, and the SVM approach assigned all training individuals correctly. A neighbour-joining tree based on allelic differences showed strong separation of Q. robur from the other two taxa in the training set (Fig. 1). Quercus petraea and Q. pubescens were less clearly separated from each other. European samples were intermingled within taxon clusters, and not located in separate, geographically defined clusters. Weak tendencies for geographical grouping within taxon clusters was visible, mainly in the Q. pubescens cluster. The first axis of the PCA of the training set explained 30.5 % of the variation and clearly separated Q. robur samples from those of the other taxa (Fig. 1). The second axis explained 10.1 % of the variation in the dataset and separated Q. petraea and Q. pubescens. In general, European samples of Q. pubescens were clustered together and more strongly separated from the Q. petraea cluster than Swiss Q. pubescens samples. Allele frequencies of the three taxa in the training set showed maximum differences of 0.86, 0.84 and 0.64 between Q. robur–Q. petraea, Q. robur–Q. pubescens and Q. petraea–Q. pubescens, respectively (Fig. S2). There was no SNP with fixed alleles, i.e. diagnostic, for the members of the taxon pairs.
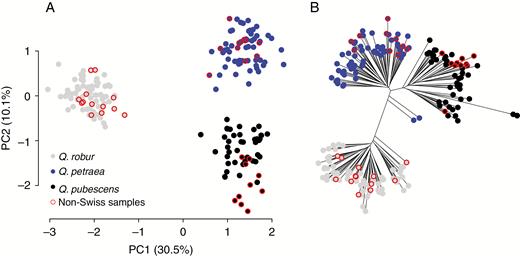
Genetic properties of the training set comprising 194 pure individuals of Quercus spp. from Switzerland and Europe (red circles) based on genotype data from 58 single-nucleotide polymorphisms. (A) Plot of the first two principal components (PC1 and PC2) of the principal component analysis; the variation explained by each PC is given in parentheses. (B) Unrooted neighbour-joining tree based on allelic differences.
Test set.
The STRUCTURE analysis with USEPOPINFO identified 170 Q. robur, 183 Q. petraea and 174 Q. pubescens, while 300 individuals were admixed (Fig. 2). This STRUCTURE analysis correlated well with probabilities from the STRUCTURE assignment without USEPOPINFO, but the latter assigned more pure individuals, namely 180 Q. robur, 211 Q. petraea and 229 Q. pubescens, leaving 207 classified as admixed. The two different STRUCTURE models showed an overlap of 84 % in assigning pure individuals. Slightly different results were obtained by the machine-learning assignment with SVM: 180 Q. robur, 213 Q. petraea, 145 Q. pubescens and 289 admixed individuals. Best correlations between assignments based on STRUCTURE with USEPOPINFO and SVM were found towards extreme probabilities near 0 and 1 (Fig. 2). The SVM assignment showed a slight tendency towards higher probabilities for Q. petraea and lower for Q. pubescens when compared to STRUCTURE with or without USEPOPINFO (Supplementary Data Fig. S3). STRUCTURE with USEPOPINFO and the SVM approach revealed an overlap of about 84 % in assigning pure individuals. Pairwise FST (Fig. S4) between taxa was highest between Q. robur and Q. pubescens (0.218, P = 0.001), followed by Q. robur vs. Q. petraea (0.211, P = 0.001). The lowest differentiation was found between Q. petraea and Q. pubescens with an FST of 0.078 (P = 0.001). Locus-specific estimates of FST varied widely (Fig. 3), in the range of 0–0.827 (median = 0.145) for Q. robur–Q. petraea, 0–0.796 (median = 0.116) for Q. robur–Q. pubescens, and 0–0.590 (median = 0.028) for Q. petraea–Q. pubescens. The PCA of all individuals showed that unassigned individuals mostly clustered between the main species clusters (Fig. S5).
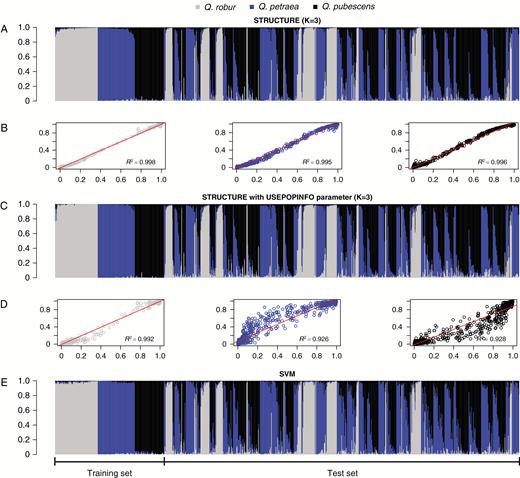
Overview and comparison of three assignment approaches based on genotype data from 58 single-nucleotide polymorphisms. Each bar represents a single Quercus spp. individual and colours reflect assignment probabilities to respective clusters. Individuals (n = 827) are arranged according to training and test set. (A) Bar plot of Q values for STRUCTURE (Pritchard et al., 2000) without USEPOPINFO (K = 3). (C) Bar plot of assignment probabilities for STRUCTURE with USEPOPINFO (this model assumes that the predefined species clusters are correct). (E) Bar plot of support vector machine (SVM) assignment probabilities. (B) Correlations between assignment probabilities from STRUCTURE with USEPOPINFO (x-axis) and STRUCTURE without USEPOPINFO (K = 3, y-axis), respectively. (D) Correlations between assignment probabilities from STRUCTURE with USEPOPINFO (x-axis) and SVM assignment (y-axis), respectively.
![Distribution of 58 locus-specific estimates of genetic differentiation [FST, based on pure individuals from the STRUCTURE (Pritchard et al., 2000) assignment with USEPOPINFO] between (A) Quercus petraea–Q. pubescens, (B) Q. robur–Q. petraea and (C) Q. robur–Q. pubescens.](https://oup.silverchair-cdn.com/oup/backfile/Content_public/Journal/aob/125/4/10.1093_aob_mcaa001/2/m_mcaa001f0003.jpeg?Expires=1748102891&Signature=TtbfdpipkiE~vzIkteZfXvbO-Y0F2tVZZy1RcLh~f6grud0nG1JDboFAyhCQdUFx-0Y5YBvFYwR-15KZfnfObLgiydaYSXEjLWsfE4G-ZGg8C6-S567f3nwFtM811hbXoB6E~qJZZKjellEDBz6VEYtVN~AjXClzuFZfC-CcVVtFKDnFXf44MbrPcWhyP8GP8-rlaMVFqiC9CqftUcy3-E4ontGeYu-pD-aKwSSAwPflxWF2cEFi64nV0WEUFg82AixwrUmhIRw3oZH79gvc5OqyO7b5ZUREsZp5X0ryCF2Tj~MQ~jIyYi9d-3WZU1DMTHWamejDBYKGodUC~Fz0Ug__&Key-Pair-Id=APKAIE5G5CRDK6RD3PGA)
Distribution of 58 locus-specific estimates of genetic differentiation [FST, based on pure individuals from the STRUCTURE (Pritchard et al., 2000) assignment with USEPOPINFO] between (A) Quercus petraea–Q. pubescens, (B) Q. robur–Q. petraea and (C) Q. robur–Q. pubescens.
Minimum number of markers required for accurate SVM taxon assignment
The assignment accuracy test using the SVM model indicated that the 26 markers with highest FST values were sufficient to assign 95 % of the training set correctly (Fig. 4). With a random selection of SNPs, on average 38 markers were necessary to assign at least 95 % of the training individuals. The accurate assignment of Q. robur individuals needed the lowest number of markers in both comparisons (five with highest FST and on average 23 with random input order). Individuals of Q. pubescens consistently required the highest number of markers for a correct assignment (26 with highest FST and on average 38 with random input order).

Evaluation of the minimum number of single-nucleotide polymorphisms (SNPs) used for accurately assigning the training set with support vector machine. Accuracy denotes the proportion of correctly assigned Quercus spp. training individuals (>0.9 assignment probability). The input order of SNPs is ranked by highest FST (solid lines) or random (dashed lines, 10 000 iterations).
Discriminatory power of the SNP set
After removing non-pure individuals based on STRUCTURE ancestry estimates without USEPOPINFO, 163 and 153 individuals remained for the SNP and the nSSR datasets, respectively, with an overlap of 135 individuals. The PCAs (Fig. 5) revealed that the SNP set had a substantially higher separation/cohesion ratio (9.30) than the nSSR data (6.10).
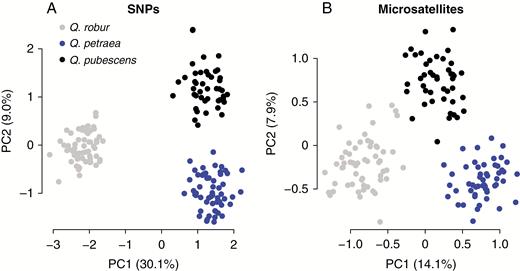
Principal component analyses of pure individuals of Quercus spp. using different underlying data types for taxon assignment. The plots show the first two principal components (PC1, PC2) and their explained variation in parentheses. (A) Genotype data from 58 single-nucleotide polymorphisms (SNPs) and (B) genotype data from eight microsatellites (nSSRs).
Genetic admixture and patterns of introgression
Shannon’s diversity index revealed remarkable differences in the levels of admixture within populations and between taxa (Fig. 6). The index for populations ranged from 0.08 to 0.71 in the overall analysis (K = 3) and from 0.04 to 0.91 in the pairwise comparisons (K = 2). Highest admixture was found in the pairwise analysis between Q. petraea and Q. pubescens (Fig. 6). Populations sampled in Grisons (eastern Switzerland; 601, 604, 607 and 609) and Valais (south-western Switzerland; 401 and 403) revealed the highest levels of admixture both in the pairwise comparison of Q. petraea and Q. pubescens and in the overall comparison. The lowest degree of admixture was found between Q. robur and Q. pubescens.
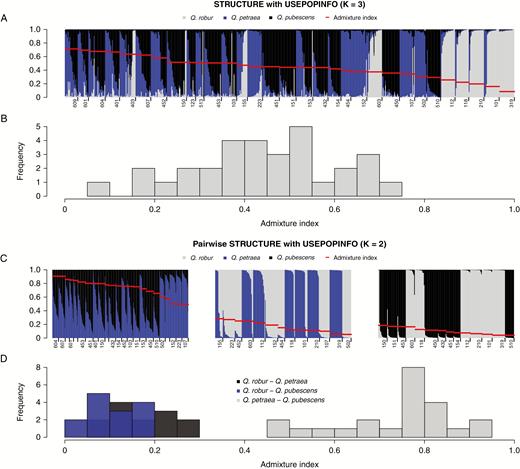
Admixture levels in populations of Quercus spp. (A) STRUCTURE (Pritchard et al., 2000) assignment with USEPOPINFO (K = 3, this model assumes that the predefined species clusters are correct) of 31 populations and (C) pairwise STRUCTURE assignment with USEPOPINFO (K = 2) of populations with a minimum of ten individuals after excluding individuals potentially belonging to the third species cluster. Each bar represents a single individual and colours reflect assignment probabilities. Per population, the averaged admixture index based on Shannon’s diversity (S) is indicated in red. Populations are ordered from high (left) to low (right) admixture index. The first digit of the population number reflects regions of origin in Switzerland: 1 = Jura; 2 = Swiss Plateau; 3 = Pre-Alps and Alps; 4 = Valais; 5 = Ticino; 6 = Grisons. (B) Histogram showing the frequency of S of all populations and (D) histogram for pairwise S based on results from (C).
Parental allele frequency differences between the taxon pairs were too low to reliably assess the amount of interspecific heterozygosity. There was no pattern of elevated interspecific heterozygosity in individuals with intermediate hybrid indices (Supplementary Data Fig. S6), in contrast to what would be expected with fixed alleles. However, many individuals in the Q. petraea–Q. robur and Q. pubescens–Q. robur comparisons showed genotypes that corresponded to their hybrid index (i.e. a tendency towards heterozygous genotypes at an intermediate hybrid index), and different genomic patterns between taxa were clearly visible (Figs S7–S9). There was no such trend in the Q. petraea–Q. pubescens comparison and only few markers showed clear patterns of introgression (genomic clines).
DISCUSSION
Species boundaries in oaks are notoriously ambiguous and their taxonomic complexity has challenged scientists over decades. An accurate taxon assignment is necessary not only to identify species but also to assess estimates of admixture and to elucidate hybridization dynamics between taxa. In this study, we selected 58 SNPs with high potential for taxon differentiation and applied these for the assignment of 827 white oak samples. This SNP set was designed with the purpose of analysing samples provided by scientists as well as practitioners and therefore aimed at containing a rather low number of SNPs, hence coming with low genotyping costs. Despite the low number of loci, our analyses with two different assignment approaches showed that the SNP set clearly discriminated the three taxa even though we found no fully fixed (i.e. diagnostic) alleles for any of the taxa. In addition, we showed that the number of markers can be further reduced (to <30 SNPs) without losing substantial discriminatory power for detecting pure individuals. Best separation, as would be expected from previous literature (Gugerli et al., 2008; Rellstab et al., 2016a), was found between Q. robur and the other two taxa (Q. petraea and Q. pubescens). Generally, the geographical signal was low when comparing Swiss samples with European samples. Furthermore, the developed SNP set had a substantially higher discriminatory power than previously applied nSSRs. Admixture was found between all three taxon pairs. However, mixed stands of Q. petraea and Q. pubescens revealed much higher degrees of admixture than mixed stands of the other two taxon pairs (Q. robur and Q. petraea or Q. pubescens), accentuating weak genetic differentiation and high levels of gene flow between the two former taxa in Switzerland; gene flow seems to be much more restricted between the other taxon pairs.
Performance of assignment approaches
In general, assignment probabilities resulting from STRUCTURE with USEPOPINFO correlated well with STRUCTURE assignments without USEPOPINFO. The former method performed slightly better in the assignment of the training set but assigned fewer pure individuals in the complete set (training and test set) than the latter. This difference in assigning pure individuals might be explained by the effect of the training samples in STRUCTURE with USEPOPINFO. Training samples pre-define clusters and thus could lead to uncertainties in the assignment of unknown samples. This effect might be weaker in a STRUCTURE analysis without USEPOPINFO, which does not use pre-defined species pools. However, the use of a training set facilitates the comparison of assignments of additional test sample sets, which is also important for applied purposes. SVM, an assumption-free model, assigns individuals based on the classifiers (support vectors) defined from the training set without incorporating any population genetic models. It performed well in assigning pure individuals, showing high overlap with the STRUCTURE assignment with USEPOPINFO. With the given parameters, SVM seemed to slightly underestimate the proportion of pure Q. pubescens samples. However, SVM could, at least at fine resolution, not reliably assess the amount of genetic admixture in admixed individuals. Nevertheless, the SVM approach has the advantage that adding and analysing new test samples can be performed in a straightforward and efficient way.
Accuracy and discriminatory power
Locus-specific estimates of genetic divergence showed that we selected some SNPs that were highly differentiating for taxon pairs. Furthermore, we found higher locus-specific FST values between Q. robur and Q. petraea than reported in previous studies (Scotti-Saintagne et al., 2004; Muir and Schlötterer, 2005). The L-shaped pattern of the locus-specific FST distribution (indicating the existence of loci with only low power in assignments, Fig. 3) and the results of the assignment accuracy test (Fig. 4) show that the number of SNPs used for taxon identification can still be reduced while retaining substantial discriminatory power. The comparison with previously applied nSSRs clearly indicated that pure individuals were better separated with the SNP set developed here (Fig. 5). However, note that we compared the SNP set to frequently used nSSRs (Guichoux et al., 2011) that were originally developed to differentiate between Q. robur and Q. petraea, without including Q. pubescens in the discovery panel. The comparison of discriminatory power between SNPs and nSSRs in species assignment is not straightforward, as it depends strongly on the discovery panel, training individuals and overall study design. In a meta-analysis comparing different marker types, Puckett (2017) showed that the use of SNPs tends to result in more accurate species assignments than the use of nSSRs. Generally, it seems that SNPs can resolve deeper relationships of genetic structure, while nSSRs seem to better identify fine-scale patterns (e.g. Tsykun et al., 2017). Technically, SNP genotyping has several advantages over nSSRs, as it not only has a higher reproducibility among laboratories (Seeb et al., 2011), but also because further technical improvement can be expected due to progress and automation in high-throughput sequencing and genotyping.
Studies in various other tree species have shown the usefulness of small nuclear SNP sets for taxon discrimination (Meirmans et al., 2007; Talbot et al., 2011). For example, Talbot et al. (2011) identified a set of 26 (nearly) fixed SNPs to efficiently assign four different Populus species and their hybrid complexes. Another example is a study that looked at hybridization dynamics between Picea sitchensis and P. glauca, in which Hamilton et al. (2013) identified a subset of 31 SNPs with allele frequency differences >0.9 between species. However, these authors also showed that interspecific heterozygosity in pure individuals was still higher than expected, indicating recombination and allele sharing between the two species. Similar results could theoretically be expected using species-specific markers in European white oaks.
The outcome of such studies is strongly dependent on the available genomic resources, the extent of differentiation of the involved taxa and the number of samples. Depending on the study organism and question, one could also think of using classical barcoding approaches based on commonly applied organellar markers in plants (CBOL Plant Working Group, 2009) or a combination of organellar and nuclear markers (e.g. Germano and Klein, 1999) for species identification. However, it has been shown that cytoplasmic diversity in oaks is to a large extent species-independent (Dumolin-Lapègue et al., 1999; Curtu et al., 2007b). For example, barcoding approaches involving well-known plastid barcoding loci in plants (e.g. matK and trnH–psbA) were applied to oaks with severe limitations for species discrimination (Piredda et al., 2011; Simeone et al., 2013).
Admixture in Quercus spp.
A substantial number of individuals remained unassigned and showed high admixture, covering the whole spectrum of assignment probabilities between 0.1 and 0.9 in both assignment approaches. Because we found no taxon-diagnostic SNPs, it is difficult to infer whether these admixed individuals reflect past introgression events or originate from recent hybridization and backcrossing, because shared alleles lead to ambiguities in inferring levels of interspecific heterozygosity (Gompert and Buerkle, 2010; Twyford and Ennos, 2012). Therefore, intermediate assignment probabilities do not necessarily imply that an individual originated from recent hybridization, but might equally likely be the result of shared ancestral variation and/or many generations of interspecific gene flow. The recent divergence of the species could have contributed to highly overlapping allele frequencies among them (Muir and Schlötterer, 2005). However, recurrent gene flow through weak reproductive barriers between species was suggested to be a more parsimonious explanation for limited interspecific divergence than shared ancestral polymorphisms (Lexer et al., 2006). Leroy et al. (2017) provided evidence for recent contacts of the three species after a long period of isolation. Furthermore, considerable levels of intra- and interspecific contemporary gene flow between the studied European white oak species was confirmed in a European-wide study by Gerber et al. (2014). Genome-wide data would help to better understand the timing, direction and magnitude of gene flow. By looking at gene tree discordance, relative divergence patterns of loci and selective sweeps, inferences about the mode of convergence (i.e. independent mutations, shared ancestral variation or gene flow) would be possible (Goulet et al., 2017; Lee and Coop, 2017). Altogether, high variation in patterns of introgression and ancestry across markers, and the identified genetic continuum highlight the high genetic variability within the white oak species complex in Switzerland.
The levels of genetic admixture between the studied taxa varied widely. Admixture was low between Q. robur and Q. petraea and even less admixture was found between Q. robur and Q. pubescens. We found the highest levels of admixture and lowest genetic differentiation between Q. pubescens and Q. petraea. For example, the four populations from Grisons all showed high admixture between these two taxa. Quercus pubescens stands are rare in this region of Switzerland, which might promote hybridization events with abundant Q. petraea. Furthermore, admixed individuals might have fitness advantages over pure Q. pubescens in the central parts of the Alpine range (Müller, 1999). Both STRUCTURE and SVM assignments clearly clustered Q. pubescens separately and assigned Swiss Q. pubescens samples with a probability >0.9 to this cluster. This finding indicates that Q. pubescens trees in Switzerland form a distinct genetic group, a characteristic they share with their European conspecifics. Müller (1999) found morphological and molecular (using isozymes) differences between Q. pubescens populations from the Mediterranean area and Central Europe. He followed the idea that Q. pubescens populations in Central Europe form a hybrid swarm that possibly originated from a separate evolutionary lineage, and he considered Mediterranean Q. pubescens and hybridogenous Q. pubescens trees from central Europe to represent distinct taxa. Our genetic analysis found that they are clearly the same taxon, although Swiss Q. pubescens appear introgressed to a certain degree. Alternatively, Lepais and Gerber (2011) suggested that Q. pubescens, as a late-successional species, expanded by directional introgression at the expense of the other species through pollen swamping. Consequently, as Swiss Q. pubescens possibly originated from the Italian Peninsula (and the Balkans) after the last glacial maximum (Mátyás and Sperisen, 2001; Petit et al., 2002), higher genetic differentiation from Q. petraea would be expected the more south the populations are. Our results do not support this idea, as non-Swiss Q. pubescens reference samples (from Italy and France) were not notably different from presumably pure Swiss samples in the neighbour-joining tree (Fig. 1B). This indicates that Q. pubescens trees have managed to keep their species integrity in Central Europe despite scattered occurrence and high levels of interspecific gene flow. The fitness advantages of pure Q. pubescens trees in certain microhabitats and partial reproductive barriers are likely to play a role in this process. However, admixture levels might be distinct in Switzerland and Southern Europe because of favourable environmental conditions for admixed individuals in Switzerland (Müller, 1999). Samples from additional populations would be necessary for a more profound conclusion.
Perspectives and limitations
While we show that the present SNP set is suitable for species discrimination and the assessment of admixture levels, we acknowledge certain limitations in our study approach. The set of candidate SNPs and initial populations for the selection of potentially discriminating SNPs was limited. First, candidate SNPs from Rellstab et al. (2016b) were restricted to coding regions, which are putative targets of natural selection. On the one hand, this can be an advantage in the case of white oaks, for which it was shown that signals of substantial taxon differentiation can be found predominantly in coding regions (Scotti-Saintagne et al., 2004). On the other hand, one might miss taxon-differentiating alleles in neutral regions of the genomes, which are subject to neutral processes such as genetic drift and past demographic events and therefore likely to be environment-independent. Second, although we included European reference populations, the geographical region of the initial set of populations is mainly focused on Switzerland, which might limit the transferability of the SNPs in European samples. Note also that our study design specifically aimed for mixed test populations. Thus, the results are not representative for all oak stands in Switzerland, and overall admixture levels will probably be lower than we report in our study.
High levels of admixture could imply an adaptive value for oak trees. One could address such issues by looking for correlations between levels of admixture and environmental parameters at the level of population and individual trees, or by performing reciprocal transplant experiments using populations with varying degrees of admixture. Doing so, one could, for example, test the hypothesis that admixed individuals perform best in intermediate habitats (ecological intermediacy hypothesis; Anderson, 1948), perhaps even better than their parental taxa (hybrid superiority hypothesis; Moore, 1977). Newly available genomic resources (Plomion et al., 2018) will help to investigate the underlying genetic basis of the hypothesis tested.
CONCLUSIONS
Despite low genetic differentiation due to recurrent gene flow, European white oak species have largely managed to keep their species integrity. Finding highly differentiated loci is not straightforward, especially for the distinction of Q. petraea–Q. pubescens in Switzerland, a geographical area with high potential for genetic admixture owing to the phylogeographical history and the ecology of European white oaks. Nevertheless, searching for genetically diverged loci in coding regions yielded a set of SNPs for reliable taxon discrimination with great potential for further applications. Low genotyping costs together with the established assignment methods make this approach also suitable for applied purposes.
SUPPLEMENTARY DATA
Supplementary data are available online at https://dbpia.nl.go.kr/aob and consist of the following.
Table S1: description of the white oak samples used in this study.
Table S2: details and primer sequences of the 96 SNPs used for genotyping.
Table S3: Excel file with raw genotypic data of all individuals.
Figure S1: STRUCTURE plots of the presumably pure sample set.
Figure S2: average frequencies of the reference alleles at 58 selected SNP loci for the three taxa based on the training set.
Figure S3: distribution of assignment probabilities of the three different assignments.
Figure S4: ternary plot of all Quercus spp. individuals based on STRUCTURE with USEPOPINFO.
Figure S5: principal component analysis of all sampled Quercus spp. individuals.
Figure S6: plot of interspecific heterozygosity as a function of the hybrid index.
Figures S7–9: patterns of introgression between species pairs.
ACKNOWLEDGEMENTS
We thank René Graf, Benjamin Dauphin, Michael Gehrig and Matthias Arend for their support in the field; Denis Horisberger, Jonas Stillhard and Rolf Holderegger for their help during selection of the investigated populations; Antoine Kremer, Benjamin Dauphin, Denis Horisberger, Patrick Bonfils and an anonymous reviewer for discussions and suggestions; and René Graf for DNA extraction. We are grateful to Mirko Liesebach, Fernando Valladares, Stephen Cavers, Giovanni G. Vendramin and Martin Lascoux for supplying the European samples, and the Swiss communities and forest services for their collaboration and sampling permissions.
DATA ACCESSIBILITY
Raw genotypic data of all individuals are available in Supplementary Data Table S3.
