


Abstract
Coastal plant communities globally are highly vulnerable to future sea-level rise and storm damage, but the extent to which these habitats are affected by the various environmental perturbations associated with chronic salinization remains unclear. In this study, we examine the relationship between North Carolina wetland tree community composition and basal area change and indicators of salinization such as soil salt ion content and elevation.
We surveyed 34 forest plots in forested, freshwater wetlands across the Albemarle–Pamlico Peninsula. A subset of our study sites had been sampled during the previous decade as part of the Carolina Vegetation Survey, enabling us to investigate the environmental effects on current community structure, and community change over time.
Multi-variate (ordination) analysis and linear regression models of tree community composition revealed that elevation and soil salt content were correlated with changes in total site tree basal area. Shifts in tree community composition were, however, only weakly correlated with indicators of salinization, specifically elevation, soil sulphate and sodium, but not chloride. While the majority of plots experienced gains in basal area over the past decade, consistent with secondary succession, sites with high soil salt content or low elevation experienced basal area (biomass) loss during the same period.
The key factors associated with chronic saltwater intrusion (soil ion content) likely explain recent changes in tree biomass, and potential shifts in community composition in low-elevation sites along the North Carolina coast. Not only is it probable that other coastal forest ecosystems worldwide will experience similar stressors and shifts in community biomass and structure as sea levels rise, but the ability of these habitats to deliver key ecosystem services like carbon sequestration and flood defence will be compromised as a result.
INTRODUCTION
The south-eastern Coastal Plain of the USA is an important biodiversity hotspot (Myers et al., 2000; Noss et al., 2015) and a region that has undergone significant land-use change over the past century (Herbert et al., 2015). By the end of this century this region may experience 100 cm of sea-level rise (Vermeer and Rahmstorf, 2009), resulting not only in loss of wetlands along the coastal fringe, but also negative consequences for forested ecosystems further inland, such as loss of biodiversity, invasion by Phragmites australis or conversion to open water. In advance of large-scale flooding due to sea-level rise, saltwater intrusion occurs, defined as the landward movement of seawater into areas that have normally experienced freshwater inputs (Nicholls, 2004). Low topographic relief, artificial drainage networks and erosion associated with agricultural land use have made this region extremely vulnerable to saltwater intrusion (Bhattachan et al., 2018). This process is further exacerbated by the maritime winds and storm surges that drive salt inland, processes becoming more intense and frequent due to climate change (Vitousek et al., 2017). Thus, saltwater intrusion is seen as the leading edge of climate change (Ardón et al., 2013, 2016). On the Coastal Plain of North Carolina, signs of sea-level rise and salinization are already apparent on the landscape (Doyle et al., 2007; Ardón et al., 2013; Herbert et al., 2015); in this study we are particularly concerned with determining the effects of salinization of the tree communities within these wetlands.
The effects of sea-level rise and salinization are by no means restricted to forests of the Coastal Plain of North Carolina; studies across the south-eastern USA including South Carolina (Stroh et al., 2008; Liu et al., 2017), Georgia (Pennings et al., 2005), Louisiana (Shirley and Battaglia, 2006) and Florida (Desantis et al., 2007; Williams et al., 2010) have investigated similar effects of saltwater intrusion on plant communities. A 2015 review by Herbert et al. summarizes the literature records of wetland salinization around the world and its primary drivers. While sea-level rise is the primary driver of coastal wetland salinization in the south-eastern USA, there are multiple mechanisms by which freshwater ecosystems are becoming more saline. Irrigation leading to saltwater intrusion through groundwater is a prominent issue in parts of Australia (Hart et al., 1990), land subsidence from agriculture results in relative sea-level rise in Italy (Antonellini et al., 2008), water diversion reduces river flow, leading to saltwater intrusion in the Mekong and Yellow River deltas of Vietnam and China (Wassmann et al., 2004; Cui et al., 2009), and road salt accumulation is problematic for wetlands in the north-eastern USA (Kaushal et al., 2005). Variation in salinization mechanism, as well as salt type (i.e. road salts versus marine salts), will affect receiving ecosystems differently, but there is no doubt that salinization of freshwater ecosystems is having effects at broad scales (Kaushal et al., 2018).
Little is known about the effects of salinization on the forest communities of North Carolina’s Coastal Plain beyond the estuarine fringe. The effects of salinity and sea level have been well studied in saltmarsh vegetation (Reed, 1995; Pennings et al., 2005; Silvestri et al., 2005), but prior work has not considered how salinization is affecting the distribution and diversity of trees within the forests of the Coastal Plain. There is a need to study the impacts of sea-level rise on freshwater wetland plant communities, particularly tree diversity and biomass, as these are important benchmarks of community structure and carbon storage.
The Carolina Vegetation Survey has undertaken a comprehensive survey of the vegetation composition of the Carolinas with survey plots distributed across the two states (Peet et al., 2018). The vegetation of North Carolina’s Coastal Plain follows typical patterns of coastal fringe to upland progression, with extensive palustrine (freshwater, non-tidal) and pocosin (shrub-scrub and evergreen) wetlands (Moorhead and Brinson, 1995). Data from the Carolina Vegetation Survey have been used to monitor changes in biodiversity, in particular the response to acute disturbances such as hurricanes and fires (Reilly et al., 2005; Xi et al., 2008; Palmquist et al., 2014). Records from the Carolina Vegetation Survey allow us to track changes in forest community over the past two decades.
The focus of this study is to determine whether the effects of salinization are already perceivable in the tree community composition and structure of this sentinel ecosystem. In this study, we use comprehensive forest survey data of 34 plots to determine whether current tree composition and basal area are correlated with saltwater exposure or saltwater exposure risk. For a subset of these sites, we compared present survey data with the Carolina Vegetation Survey dataset to examine whether tree composition and basal area are changing more rapidly in sites with saltwater exposure or exposure risk. We hypothesized that the magnitude of community composition change, and the percentage change in basal area, would be related to environmental indicators of salinization at each site, specifically elevation, soil chloride content and other salt ions found in sea water.
MATERIALS AND METHODS
Study area
Sites for this study are located on the Albemarle–Pamlico Peninsula in north-eastern North Carolina (Fig. 1). The Albemarle and Pamlico sounds form the second largest estuary complex in North America and the peninsula spans 5000 km2 just inside the barrier islands of North Carolina. The mean annual temperature is 16.6 °C and mean annual precipitation is 1320 mm, which is evenly distributed across seasons (Plymouth Weather Station, Washington Country, NC) (see Ardón et al., 2010 for a detailed description of the region). This region is also prone to severe storms and hurricanes in late summer and early autumn. More than half of the land area is <1 m above sea level (Poulter and Halpin, 2008). Soils of the study sites are mainly Pungo muck and Hyde loam, which are deep, poorly drained, high in organic content and highly acidic (NRCS, 2017). Vegetation communities include brackish marshes, mesic mixed hardwood forests, Atlantic white cedar forests, estuarine pine woodlands and cypress–gum swamps (Schafale, 2012).
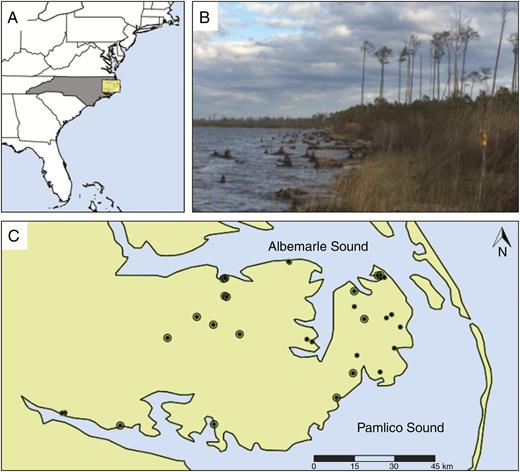
(A) The Atlantic coast of the USA, the state of North Carolina and inset of our study region. (B) Photograph of a coastal forest retreat taken by Steve Anderson on the Albemarle Sound. (C) The Albemarle–Pamlico Peninsula and study sites (concentric dots are sites that have historic survey data).
Data collection and measurement
Vegetation plots for this study are located in forested stands within public lands. Sixteen sites were established and measured by the Carolina Vegetation Survey between 2003 and 2009 (Peet et al., 2012). We located the original plots and resurveyed the vegetation in June and July of 2016. An additional 18 new plots were established for this study (in 2015 or 2016) for a total of 34 plots. New plots were established on public or federally owned property and using the same protocol as the Carolina Vegetation Survey (Peet et al., 1998). Plot sizes vary between 100 and 1000 m2 to capture the diversity of the species present in a given homogeneous community (larger plots being necessary in more heterogeneous areas). The sites span many vegetation community types and include wetlands of varying inundation period. Site elevation was acquired from the USGS National Elevation Dataset (U.S. Geological Survey, 2017) and soil type from the National Resources Conservation Service (Soil Survey Staff, 2017).
For collection of vegetation data, each site was subdivided into modules of 10 × 10 m as described in Peet et al. (1998). We measured the diameter at breast height of every tree >5 cm in diameter in each module. For each species we calculated the total basal area (m2 ha−1).
For analysis of soil characteristics, ten soil cores, to 10 cm depth, were collected at each site along a diagonal transect within one of the modules. Each core was sectioned into two 5-cm deep sections. For each section, roots and rocks were removed and soils were passed through a 2-mm sieve, homogenized and composited for analysis of soil properties and ion concentrations. To characterize the soil properties at each site, for each core section we measured pH, bulk density, soil moisture percentage and loss on ignition in a 500 °C oven for 4 h. To estimate salt exposure, soils for each plot were analysed for major ions that occur in seawater (Cl−, SO42−, Ca2+, Mg2+, K+ and Na+). For characterization of soil cation content we measured water-extractable base cations (Ca2+, Mg2+, K+ and Na+) using a CS12A column on a Dionex ICS 2000 ion chromatograph (Dionex Corporation, Sunnyvale, CA, USA). The Dionex ICS 2000 was also used to analyse water-extractable anions (Cl−, SO42−) on an AS-18 analytical column. To understand soil nutrient content, ammonium (NH4+) was measured using the phenolate method, and nitrate (NO3−) was measured using the hydrazine reduction method using a flow-through analyser (Lachat QuickChem 8500, Lachat Instruments, Loveland, CO, USA) (APHA, 1998).
Data analysis
Data analyses were performed in R 3.3.3 (2017). We calculated total basal area of each species at each site for both the historical Carolina Vegetation Survey sites and the sites measured in this study. To compare tree community composition with environmental characteristics, we created an ordination plot using total basal area data from plots surveyed in 2015 and 2016. The metaMDS function in the vegan package (Oksanen, 2017) was used to create a two-dimensional non-metric multidimensional scaling (NMDS) ordination using species basal area and Bray–Curtis dissimilarity. A total of 28 species were included in the analysis (four species present in the survey plots were eliminated from the analysis because they fell below the rarity cut-off: 0.5 % of the total basal area). The function envfit was used to fit environmental variables to the ordination. This function is used to assess the significance of each variable in predicting the arrangement of the vegetation communities using permutation tests. Further analysis of environmental characteristics was conducted using the corPlot function from the package psych to look for correlation between variables.
To understand how vegetation is changing over time, we created a second ordination that included the data from the historical Carolina Vegetation Survey (also using metaMDS and the same parameters specified for the first NMDS). Simple Euclidean distances were calculated between samples of resurveyed sites as a proxy for community composition change over time. These distances were normalized by the number of years between resampling, to yield a rate for community composition change over time. Community composition change over time was then compared with the environmental characteristics measured for each site in the 2016 survey using simple linear regression.
Finally, we used the total basal area of each plot from the Carolina Vegetation Survey and from the resurvey sites measured in this study to calculate a percentage change in total basal area. The percentage change in basal area over time was also normalized by the number of years between surveys and compared with the environmental characteristics using linear regression.
RESULTS
The NMDS ordination of all trees and environmental factors demonstrates which drivers are most strongly correlated with tree community composition. The NMDS ordination (Fig. 2) of species abundance (total basal area) data for the 34 vegetation plots surveyed in this study during 2015 and 2016 arranges each surveyed plot by community dissimilarity (stress 0.178; non-metric fit R2 = 0.969). In this ordination we fitted all of the measured environmental parameters (for soil characteristics, only data from the top section, 0–5 cm depth, were used in these analyses; no significant differences were found between these results and analyses that included the 5–10 cm soil core section); arrows indicate the direction and relative importance of significantly correlated environmental factors. Four of the 13 characteristics measured at each site were significantly correlated (P < 0.05) with the arrangement of tree communities in the ordination space: Cl−, K+, Na+ and elevation (R2 = 0.23, 0.21, 0.26 and 0.25, respectively; Table 1). Two primary gradients emerge from these fitted variables: all of the marine salt-associated ions in one direction, and with elevation approximately orthogonal to salts. The results from fitting the environmental data to the community composition ordination suggest that these environmental factors are contributing to the distribution of tree species across this region. Neither soil nitrogen (nitrate or ammonium) nor organic carbon appear to be important correlates for community composition. See Supplementary Data Tables S1 and S2 and Fig. S1 for complete site information, soil characteristics and correlations between environmental characteristics.
Coefficients and correlation scores for environmental parameters fitted to the tree community composition ordination for 34 vegetation plots surveyed in 2015–2016 on the Coastal Plain of North Carolina demonstrating the significance of elevation and salt as drivers of current community assemblage (significant drivers in bold)
| VECTORS | NMDS 1 | NMDS 2 | R2 | Pr(>r) | Significance |
|---|---|---|---|---|---|
| Chloride | −0.92663 | 0.37598 | 0.2322 | 0.021 | * |
| Sulphate | −0.93927 | 0.34318 | 0.1663 | 0.058 | |
| Elevation | 0.05237 | −0.99863 | 0.2478 | 0.01 | ** |
| Bulk density | −0.52053 | −0.85384 | 0.1017 | 0.187 | |
| Moisture | 0.4896 | 0.87195 | 0.0578 | 0.404 | |
| Organic carbon | 0.72116 | 0.69276 | 0.1402 | 0.093 | |
| pH | −0.75017 | 0.66125 | 0.1022 | 0.183 | |
| Sodium | −0.93051 | 0.36626 | 0.2095 | 0.022 | * |
| Potassium | −0.9328 | 0.36038 | 0.2618 | 0.008 | ** |
| Magnesium | −0.61085 | 0.79174 | 0.1462 | 0.072 | |
| Calcium | −0.41313 | 0.91067 | 0.0835 | 0.243 | |
| Nitrate | 0.23275 | −0.97254 | 0.1402 | 0.094 | |
| Ammonium | −0.54522 | −0.8383 | 0.049 | 0.462 |
Significance codes: *P < 0.05, **P < 0.01, ***P < 0.001.
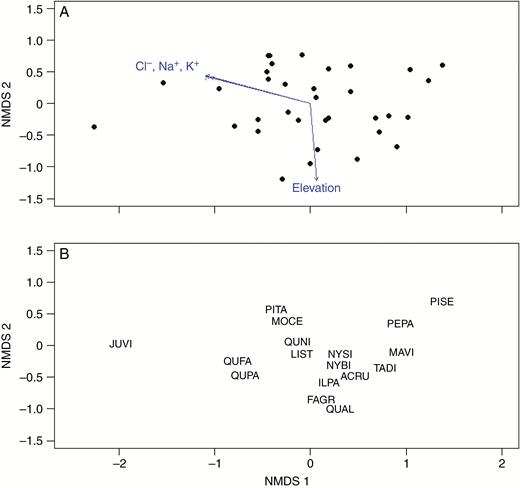
(A) NMDS of species abundance (basal area) in each of 34 plots surveyed in 2015/2016. Vectors represent the environmental factors measured at each plot that are significantly correlated with tree community distribution. (B) Major tree species in ordination space denoted by species code. ACRU, Acer rubrum; FAGR, Fagus grandifolia; ILPA, Ilex opaca; JUVI, Juniperus virginiana; LIST, Liquidambar styraciflua; MAVI, Magnolia virginiana; MOCE, Morella cerifera; NYBI, Nyssa biflora; NYSI, Nyssa sylvatica; PEPA, Persea palustris; PISE, Pinus serotina; PITA, Pinus taeda; QUAL, Quercus alba; QUNI, Quercus nigra; QUPA, Quercus pagoda; TADI, Taxodium distichum. Other species present but not displayed on the NMDS: Carya tomentosa, Chamaecyparis thyoides, Cornus florida, Gordonia lasianthus, Liriodendron tulipifera, Oxydendrum arboretum, Prunus serotina, Quercus multiple species, Sassafras albidum and Ulmus multiple species.
Data from 16 Carolina Vegetation Survey plots collected in 2003 and 2009 were used to examine how tree communities are changing over time. A second NMDS ordination with data from both sample points (stress 0.181; non-metric fit R2 = 0.967) visually represents the shift in community composition in ordination space over time (Fig. 3). Arrows represent how far and in what direction a plot’s tree community has moved since the plot was established. The movement of plots over time appears stochastic overall, without clear trends emerging in the direction or magnitude of community shift.
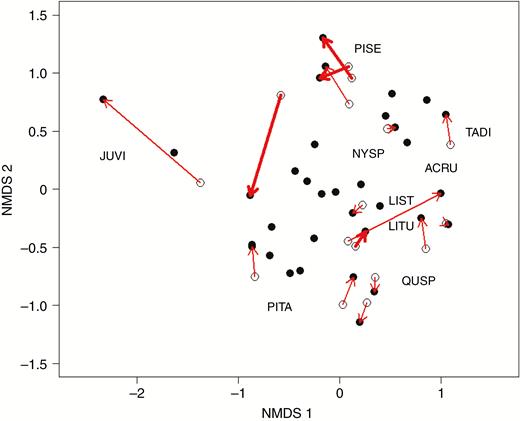
NMDS of the species abundance (basal area) of all vegetation plots from the Coastal Plain of North Carolina surveyed in this study (solid circles) and 16 sites with historic data (open circles), surveyed in 2003 or 2009 by the Carolina Vegetation Survey. Arrows connect plots that were resurveyed in the same location; bolded arrows denote that the original survey was conducted in 2003. Common taxon positions in species space are denoted by their species code and grouped to avoid overlapping labels for clarity. ACRU, Acer rubrum; JUVI, Juniperus virginiana; LIST, Liquidambar styraciflua; LITU, Liriodendron tulipifera; NYSP, Nyssa sp. (biflora or sylvatica); PISE, Pinus serotina; PITA, Pinus taeda; QUSP, Quercus, multiple species; TADI, Taxodium distichum.
To understand the pattern of overall plot movement we calculated vector length and normalized it by time between resampling events. Most plots experienced a small shift in community composition and a few plots changed more dramatically. When we compared the magnitude of change in community composition over time with environmental factors (Fig. 4) we found that elevation, sulphate (SO42−) and sodium (Na+) were significantly, although weakly, correlated with community composition change. In contrast to our hypothesis, chloride (Cl−) did not appear to be significantly correlated with the magnitude of community composition change.
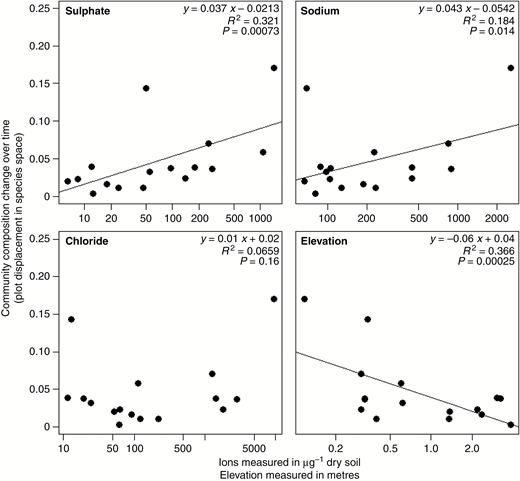
Community composition change for resurveyed vegetation plots on the Coastal Plain of North Carolina (y-axis is the length of the arrows in Fig. 3, normalized over time) is correlated with environmental parameters associated with saltwater intrusion.
Finally, we assessed total basal area change over time at each site. As anticipated in early to mid-successional dominated forests in protected lands, we observed that the majority of plots are gaining basal area (12 of 16 sites). The range of percentage change in basal area is from −9.6 to 118 % and the median is 33.8 %. However, several plots have experienced a loss of basal area since the first survey (7 or 13 years previously). Our results show that 37.5 % of sites have grown <10 % over the course of the study. Figure 5 shows the correlations between percentage change in basal area and the environmental factors. In contrast to our results for community composition change, the change in basal area is significantly correlated with the environmental factors associated with salinization: sodium, sulphate, chloride and elevation are all correlated with change in total basal area (R2 = 0.56, 0.52, 0.35 and 0.48, respectively). Other environmental factors measured that were significantly correlated with percentage basal area change include soil moisture, Ca2+, Mg2+, K+ and NH4+ (Supplementary Data Fig. S2).
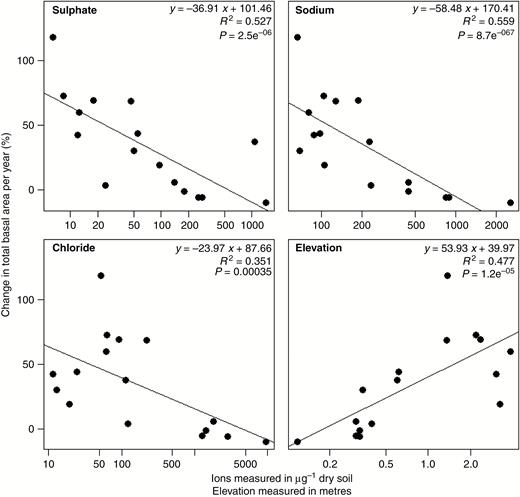
Percentage change in total basal area per year compared with environmental characteristics for each resurveyed vegetation plot from the North Carolina Coastal Plain.
DISCUSSION
Our study presents two major conclusions. First, shifts in community composition of coastal wetland forests may be correlated with indicators of salinization. Second, in our study plots that demonstrate the most severe evidence of salinization, we observed a loss of tree basal area. Loss of basal area during the period of this study is a striking finding given the absence of development, deforestation, fire, disease or other major disturbance in our surveyed plots. Furthermore, loss of basal area is an important indicator of loss of biomass, which raises concerns about the ability of these forests to maintain their functions as carbon sinks (Slik et al., 2010).
The literature on the effects of saltwater intrusion on vegetation generally addresses either very fine-scale responses at the level of individual plants or plants species, or at the landscape scale. Fine-scale investigations include germination or greenhouse experiments with particular species at different salinity and inundation levels (propagule bank study by Battaglia and Collins 2006; greenhouse studies by White et al., 2014; Hanley et al., 2017) and offer insight as to how certain species will respond, but may not reflect the context of natural ecosystems. Conversely, studies that treat large-scale processes such as land use change (Shirley and Battaglia, 2006) do not always detail the pathways of community composition change. Few studies have been conducted to look specifically at the effects of saltwater intrusion on plants at the community level. Our work focuses on change over intermediate time and spatial scales and addresses how forest stands are changing over decadal time periods. This work is important for understanding patterns of change within a landscape and identifying areas for further research.
In our study region, the Albemarle–Pamlico Peninsula, much of the area is protected wild land where one expects to find trends of forest growth and succession. This is the case for the majority of the sites measured in this study, but the occurrence of areas that are experiencing basal area loss runs counter to such expectations. The sites that are growing poorly or losing basal area could potentially be the canary in the coal mine for the rest of the region. Evidence presented here demonstrates that indicators of saltwater intrusion such as soil ion content and elevation are correlated with the current tree community composition of the Albemarle–Pamlico Peninsula. Furthermore, indicators of salinization are correlated with the decline in basal area experienced at sites across the region. These findings are important because loss of tree biomass has implication for global carbon budgets and biodiversity, and moreover the region may be a model against which to compare other coastal ecosystems.
The current community assemblage of trees within our study region reflects the natural environmental gradients present across the landscape and the partitioning of species according to their individual environmental niche requirements and environmental tolerance. For example, Juniperus virginiana is one of the most salt-tolerant species and is the dominant species present in the plot with the highest soil chloride content (Supplementary Data Table S3). We also find that J. virginiana is in decline at this site, which indicates the possibility that, although J. virginiana is relatively more salt-tolerant than most tree species, environmental change may be pushing conditions past habitability for this and other species (Desantis et al., 2007). Overall, we find that sites experiencing the most loss are ones with lower overall tree basal area to begin with. From this, we infer that these sites were already considerably more vulnerable, resulting in reduced productivity. It was in these areas that we observed anecdotally the apparent transition from coastal forest to systems dominated by shrub-grass (i.e. Myrica, Iva, Spartina, Phragmites). This loss of tree-dominated wetlands could have significant implications for carbon budgets (Kasischke et al., 2013).
Previous work demonstrates that the growth of many tree species, including Pinus taeda, J. virginiana, Taxodium distichum, Nyssa biflora and Liquidambar styraciflua, is impeded by salinity or flooding (Hosner, 1960; Conner and Askew, 1992; Tolliver et al., 1997; McCarron et al., 1998), but the majority of this evidence is obtained from greenhouse studies or field germination studies. Several field studies have been conducted to examine tree survival following natural saltwater intrusion events (Conner, 1995), but few studies have tracked forested plots over time (Williams et al., 1999, 2003), and this is the first study of its kind to look at tree response to indicators of saltwater intrusion on the Coastal Plain of North Carolina. We assert that more work of this kind is necessary to understand the community-level response to environmental change.
The challenge of data collection in large, biologically diverse forests is one of the reasons there has been very little research on these communities compared with coastal salt marshes. Given the short time frame of this study, 7–13 years between repeat surveys, it is particularly surprising to see that some sites showed such large changes in both composition and in total basal area. Interestingly, even though many of the sites were mature forests, sites that were losing basal area were generally those that had less starting basal area, which helps to rule out the hypothesis that sites with low growth were simply at a growth plateau (Supplementary Data Fig. S3).
The environmental characteristics investigated in this study, namely elevation and soil ion content, are indicative of past saltwater exposure but not the exposure mechanism (Ardón et al., 2016). In this region, drought plays a significant role in concentrating solutes in surface water and soil moisture. Storm surges from hurricanes and other storms also play a large role in delivering salt inland in this region and other parts of the world (Conner, 1995; Doyle et al., 2007; Hoeppner et al., 2008). Human-induced climate change may increase the prevalence of storm events across the globe and the south-eastern USA is expected to experience more hurricanes (Doyle et al., 2007). Short-duration flooding events associated with storms bring a combined threat of stress from inundation and salinity: oxygen deprivation from waterlogged soils and osmotic stress from salts (Jackson and Colmer, 2005; Munns and Tester, 2008). While plants may often recover from acute short-term salinity stress, recurring short-term exposure may eventually lead to plant community shift. Low-elevation coastal forests are particularly vulnerable to this threat and may not be able to cope with a shifting baseline for flood exposure.
Future work should consider the influence of local weather patterns that drive or exacerbate the chronic effects of sea-level rise, including floods and droughts, as well as the multiple anthropogenic stressors that impact ecosystems, such as pollutants, fire and land-use change. Results from this study, which indicate a potential shift in the carbon storage capacity of coastal forests, should prompt further investigation of how carbon stocks, particularly in trees, are changing in response to global change. Finally, in order to overcome the methodological limitations of studying vegetation change, future research should consider the efficiency of scale and should move to remote sensing tools for detection and monitoring of plant community change.
SUPPLEMENTARY DATA
Supplementary data are available online at https://dbpia.nl.go.kr/aob and consist of the following. Table S1: site information and physical characteristics. Table S2: soil chemistry data. Table S3: vegetation summary. Figure S1: correlation plot of environmental characteristics. Figure S2: linear regressions. Figure S3: change in stem density versus change in basal area.
ACKNOWLEDGEMENTS
The authors wish to acknowledge the Carolina Vegetation Survey and primary participants, T. R. Wentworth, M. S. Schafale and A. S. Weakley. We also acknowledge C. Bergemann, E. A. Ungberg, E. Baruch, Y. Wen, M. Stillwagon, A. Green, H. Camp, K. Ludlow, S. Mahanes and members of the Bernhardt Laboratory and the Wright Laboratory. Thank you also to two anonymous referees for comments on an earlier version of this article. This work was supported by the NSF Coastal SEES Collaborative Research Award 1426802.
