


Abstract
Background and Aims Understanding the changes in below-ground bud bank density and composition along a climatic gradient is essential for the exploration of species distribution pattern and vegetation composition in response to climatic changes. Nevertheless, investigations on bud banks along climatic gradients are still scarce. The below-ground bud bank is expected to be reduced in size in arid conditions, and costly, bud-bearing organs with long spacers would be replaced by more compact forms with buds that are better protected than those found in moist conditions.
Methods How total bud density and composition (different bud bank types) change with aridity (calculated value 0·43–0·91), mean annual precipitation (MAP; 93–420 mm) and mean annual temperature (MAT; −1·51 to 6·93 °C) was tested at 21 sites along a 2500-km climatic gradient in the temperate steppe of northern China.
Key Results The relationship between below-ground bud bank density and precipitation/aridity was fundamentally changed along the climatic gradient. Bud bank density increased first and then decreased along the aridity and MAP gradients, the turning points being aridity=0·67 and MAP=260 mm, respectively, while it decreased consistently with increasing MAT. The proportion of the bud bank that comprised tiller buds or dicotyledonous herb buds fluctuated along the aridity gradient. The proportion of rhizome buds was higher at relatively moist sites (aridity <0·75), while that of bulb buds was higher at drier sites (aridity >0·75).
Conclusions Belowground bud bank density decreases towards the dry, hot end of the climatic gradient. Based on the distribution of bud types along the climatic gradient, bulb buds and tiller buds of tussock grasses seem to be more resistant to environmental stress than rhizome buds. The dominance of annual species and smaller bud banks in arid region implies that plant reproductive strategies and vegetation composition will be shifted in scenarios of increased drought under future climate change.
INTRODUCTION
Angiosperms originally evolved in moist and shady habitats, but later spread to other ecosystems as the climate started to be drier and/or colder (Feild et al., 2009; Zanne et al., 2014). Among angiosperms, herbaceous species largely avoid harsh climates by senescing above-ground tissues and persisting through adverse seasons below ground in the form of dormant, bud-bearing organs (Raunkiaer, 1934; Zanne et al., 2014). This strategy enables perennial herbs to dominate vast ecosystems characterized by dry and/or cold periods and, moreover, to thrive in the face of various disturbances, such as fire or grazing (Benson et al., 2004; Klimešová and Klimeš, 2007; Dalgleish and Hartnett, 2009; Zhao et al., 2013). In ecosystems dominated by perennial herbs, such below-ground bud banks are known to provide buffering that effectively resists short-term climatic perturbations (Hoover et al., 2014; Vanderweide and Hartnett, 2015). In particular, herbaceous communities with large bud banks have the potential to respond quickly to disturbance, increased nutrient availability or precipitation (Hartnett et al., 2006; Dalgleish et al., 2008; Dalgleish and Hartnett, 2009; Zhao et al., 2010) and therefore are resilient in response to short-term perturbations (Dalgleish et al., 2012; Yin et al., 2013; Vanderweide et al., 2014; Wu et al., 2014). However, long-term climatic changes may show negative influences on these plants (Clark et al., 2002; Yin et al., 2013).
While previous research has demonstrated that long-term drought conditions could drive the large and widespread decline of perennial species (McAuliffe and Hamerlynck, 2010), the role of bud banks in perennial vegetation dynamics has rarely been explored. Indeed, bud banks are known to be affected by disturbances (Fidelis et al., 2014; Herben et al., 2016), and their diminishment in response to drought (Carter et al., 2012; Vanderweide and Hartnett, 2015) and cryoturbation (Klimešová and Doležal, 2011; Klimešová et al., 2012) has been documented. Thus, the increased frequency and intensity of such extreme weather phenomena as the heat waves and long-term drought (Piao et al., 2003; Smith, 2011; Dai, 2013; Yin et al., 2013) that are projected to result from contemporary climate change would pose particular challenges for communities that rely on such bud banks. For example, the annually burned tallgrass prairie of North America is particularly reliant on the below-ground bud bank, with >99 % of its above-ground shoots seasonally recruited from it, whereas the contribution of the soil seed bank is negligible (Benson and Hartnett, 2006). Moreover, experimental drought has been found to temporarily reduce the prairie bud bank (Vanderweide and Hartnett, 2015), which should raise concern about the impacts of likely long-term drought. In particular, prairies at the dry end of the precipitation gradient across North America were found to have very small bud banks, where annual plants recruiting from the seed bank play a major role beside recruits from the bud bank (Dalgleish and Hartnett, 2006). For some perennial herbaceous plants (e.g. Bouteloua gracilis in the mixed prairie of North America), even though the vegetative regeneration rate is low, vegetative regeneration is still an important strategy in their life history, and periods of extreme climatic conditions (i.e. prolonged drought) may have important effects on population demography (Fair et al., 1999). The effect of climatic variations on seed germination and seedling establishment has proved to contribute to the shift in species dominance pattern under predicted climatic changes (Peters, 2000). Vanderweide et al. (2014) also confirmed that multi-year growing-season drought has no effects on below-ground bud density, but changes the plant community structure in tallgrass prairie. Thus, long-term drought might be expected to cause shifts in plant reproductive strategies and changes in vegetation composition.
The responses of herbaceous community bud banks to dry conditions depend not only on bud number but also on other bud bank traits. In particular, some bud-bearing organs are better adapted to dry conditions than others. For example, bulbs, which are actually large buds that protect apical meristems with thickened scale leaves or leaf bases, contain stored water, and are especially suited to periodically dry climates (Pate and Dixon, 1982). Similarly, due to intravaginal tillering, buds located at tiller bases of graminoids (epigeogenous rhizomes sensuKlimešová and Klimeš, 2008) are protected by leaf sheaths and are known to prefer dry habitats (Klimeš et al., 1997; Klimešová et al., 2011, 2012). In contrast, below-ground rhizomes (hypogeogenous rhizomes sensuKlimešová and Klimeš, 2008) avoid dry places with undeveloped soil (Klimeš, 2003, 2008; Klimešová et al., 2011, 2012). On the other hand, climate-induced changes in the distribution of bud-bearing organs along aridity gradients may have vast consequences, as the bud-bearing organs affect ecosystem services such as carbon sequestration (Cornelissen et al., 2014; Ye et al., 2015), biomass production (Vanderweide and Hartnett, 2015) and soil protection against wind erosion (Liu et al., 2012). Thus, although bulbs and tiller bases should be more adapted to aridity, they do not provide very good soil protection against wind erosion due to their poor clonal spread (bulbs) or clumped growth form (tussock-grass tillers). Moreover, these two bud-bearing organs differ in their multiplication possibilities, as bulbs usually produce only one or a few offspring bulbs (Irmish, 1850), whereas tiller bases contain numerous reserve buds (Ott and Hartnett, 2015a). Long hypogeogenous rhizomes, which not only are the best below-ground organs at protecting soil against wind erosion (Liu et al., 2012) but also contribute to carbon sequestration (Cornelissen et al., 2014), are – in contrast to bulbs and tiller bases – especially sensitive to drought. Moreover, hypogeogenous rhizomes usually do not use their buds for seasonal regrowth (Ott and Hartnett, 2015b).
In the present study, we sought to evaluate the potential constraints on vegetation response to climatic changes along an aridity gradient of the grassland biome of Inner Mongolia, China. We did this by assessing below-ground bud bank densities with respect to bud-bearing organs at 21 sampling sites along a 2500-km transect. Due to the regional temperate continental monsoon climate, it features a gradient from a wet, cold climate in the east to a dry, hot climate in the west. Using this environmental gradient, we aimed to test the following two hypotheses: (1) below-ground bud bank density will decrease towards the dry, hot end of the gradient; and (2) the proportion of buds better protected (bulbs, grasses shoot bases) will increase, whereas the proportion of buds located on rhizomes will decrease in the same direction.
MATERIALS AND METHODS
Study sites
The study was conducted in the temperate steppe of northern China (Inner Mongolia). This habitat has been used in the long term for moderate grazing, but land degradation and desertification have occurred in some areas due to overgrazing and other inappropriate uses during past decades (Yang et al., 2005; Briske et al., 2015). The climate is seasonal, and plants are active in the warm period from April to September and dormant in winter. The longitudinal range of the 21 sampling sites is 104·45° to 120·36° E, the latitudinal range is 40·73° to 49·88° N and the elevation range is 534–1518 m a.s.l. (Fig. 1, Table 1). From west to east, three types of vegetation were investigated: (1) desert steppe (approximately study sites 1–10, mean annual precipitation [MAP] 93–204 mm), with sparse occurrence of the low shrubs Nitraria, Suaeda, Ephedra and Reaumuria, accompanied by Allium species and grasses such as Stipa breviflora and Cleistogenes squarrosa, with productivity ∼8–55 g m−2; (2) typical steppe (approximately study sites 11–12 and 16–18, MAP 222–297 mm), with productivity ∼30–160 g m−2; and (3) meadow steppe (approximately study sites 13–15 and 19–21, MAP 324–420 mm), which is similar to the typical steppe, dominated by Leymus chinensis and Agropyron cristatum as well as by similar species of the genera Stipa, Carex and Cleistogenes, but with higher productivity (∼130–170 g m−2). The plant species richness increased from five to > 25 species per square metre from west to east on this temperate steppe.
Basic information on study sites
| Study site | Latitude (°N) | Longitude (°E) | Altitude | MAP (mm) | MAT (°C) | PET (mm) | Aridity | AGB (g m−2) | RRA (%) | BPA (%) |
|---|---|---|---|---|---|---|---|---|---|---|
| 1 | 40·88 | 104·45 | 1461 | 93 | 6·12 | 983 | 0·91 | 7·93 | 32·86 | 30·21 |
| 2 | 40·73 | 105·61 | 1293 | 100 | 6·93 | 1025 | 0·90 | 45·17 | 31·92 | 17·33 |
| 3 | 41·80 | 107·47 | 1515 | 151 | 4·28 | 894 | 0·83 | 33·72 | 15·07 | 3·31 |
| 4 | 41·83 | 107·61 | 1513 | 156 | 4·11 | 890 | 0·82 | 48·75 | 12·68 | 1·19 |
| 5 | 41·91 | 108·71 | 1518 | 204 | 3·42 | 873 | 0·77 | 56·37 | 11·33 | 0·32 |
| 6 | 42·42 | 109·81 | 1151 | 180 | 5·22 | 937 | 0·81 | 28·67 | 20·90 | 10·41 |
| 7 | 42·93 | 110·82 | 1035 | 152 | 4·91 | 957 | 0·84 | 99·69 | 32·48 | 38·12 |
| 8 | 43·38 | 111·96 | 1013 | 148 | 3·56 | 921 | 0·84 | 46·56 | 40·72 | 38·74 |
| 9 | 43·63 | 112·20 | 956 | 147 | 3·50 | 921 | 0·84 | 54·17 | 42·27 | 53·47 |
| 10 | 43·71 | 112·92 | 1051 | 182 | 2·91 | 891 | 0·80 | 111·18 | 41·49 | 41·13 |
| 11 | 43·85 | 114·09 | 1050 | 222 | 2·16 | 872 | 0·75 | 94·88 | 40·74 | 50·79 |
| 12 | 43·98 | 114·83 | 1128 | 246 | 1·13 | 843 | 0·71 | 164·84 | 15·92 | 5·87 |
| 13 | 44·47 | 117·18 | 1048 | 324 | 1·03 | 818 | 0·60 | 133·17 | 10·93 | 0·29 |
| 14 | 44·99 | 118·75 | 987 | 380 | 0·83 | 809 | 0·53 | 153·24 | 13·08 | 2·91 |
| 15 | 45·43 | 119·72 | 972 | 420 | 0·42 | 788 | 0·47 | 164·51 | 15·29 | 2·91 |
| 16 | 48·09 | 118·46 | 718 | 285 | −1·04 | 775 | 0·63 | 160·46 | 16·77 | 2·74 |
| 17 | 48·50 | 117·15 | 592 | 260 | 0·18 | 781 | 0·67 | 83·10 | 15·17 | 1·43 |
| 18 | 49·34 | 117·09 | 720 | 297 | −1·49 | 740 | 0·60 | 157·21 | 33·79 | 17·50 |
| 19 | 49·78 | 118·53 | 534 | 332 | −1·47 | 754 | 0·56 | 129·71 | 15·23 | 1·62 |
| 20 | 49·88 | 119·99 | 754 | 406 | −1·51 | 712 | 0·43 | 173·70 | 9·11 | 5·80 |
| 21 | 49·19 | 120·36 | 632 | 392 | −1·29 | 739 | 0·47 | NA | 11·07 | NA |
AGB, above-ground biomass; RRA, relative richness of annuals; BPA, biomass proportion of annuals; NA, data not available.
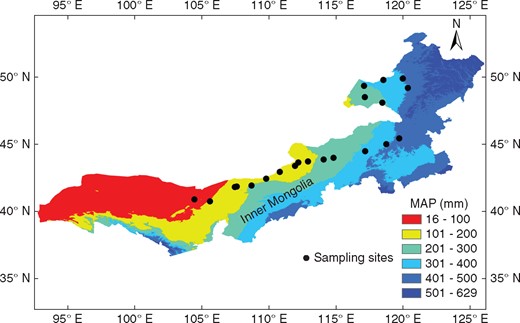
Distribution of sampling sites in the temperate steppe of northern China.
Climate data collection
We used three parameters to describe the climatic gradient: MAP, mean annual temperature (MAT) and aridity. Using these multiple variables enabled us to both compare our data with a few relevant published studies that use one or more of them, and moreover to disentangle the potential contributions of each of these variables to the observed bud bank patterns. The MAT and MAP data (1950–2000) were extracted from a global climate dataset with a resolution of 0·0083×0·0083 (∼1 km2 at the equator), obtained from http://www.worldclim.org. The potential evapotranspiration (PET) data (1950–2000) were extracted from the CGIAR-CSI Global Aridity Index and Global Potential Evapo-Transpiration Climate Database (http://www.cgiar-csi.org/data/global-aridity-and-pet-database). From west to east along the transect, MAP increased while MAT decreased, so the aridity was used to incorporate MAP and MAT into one parameter to assess the changes in the below-ground bud bank along the gradient, because PET is strongly determined by MAT. Aridity in this study was defined as 1−MAP/PET (MAP/PET was used in several studies as the aridity index, e.g. Delgado-Baquerizo et al., 2013; Luo et al., 2016; we do not use this measure as its value increases with increasing wetness of the climate). Thus the higher value of aridity indicates more serious water stress along the gradient.
Belowground bud bank sampling
During and just after the sexual reproduction stage (flowering and/or fruiting) of plant communities on the temperate steppe, below-ground bud banks were sampled during the period from 30 July to 14 August 2012. The phenological difference was relatively negligible during the sampling period, and the results of an analysis using sampling date as a covariate indicated that sampling date had no significant effect on bud density. Sampling locations were GPS-referenced in terms of latitude, longitude and elevation (±3 m accuracy; eTrex Venture, Garmin, USA).
Sampling sites (21 in total) were placed almost evenly to characterize the whole climatic gradient and to avoid grasslands degraded due to inappropriate management. All sampling sites could represent semi-natural communities lacking significant human perturbation. At each sampling site, two 50 m×50 m plots (∼1 km apart) were established. In each plot, five 1 m×1 m quadrats (at the centre and in the four corners) were selected to investigate the vegetation coverage and the species composition and biomass of above-ground plant communities. Near each vegetation quadrat, one soil core (20 cm×20 cm×20 cm) along with the above-ground shoots arising from it was excavated. The connections between above-ground shoots and below-ground organs were kept intact for subsequent species and bud type identification of the below-ground bud bank. The soil blocks also contained fragments of bud-bearing organs without above-ground parts that reached the sampled plot from the side; we did not observe dormant below-ground organs lacking above-ground shoots. Thus, at each sampling site, ten soil cores/below-ground bud bank samples were taken. The soil was carefully removed from the plant material, and all samples were placed in plastic bags and transported to a laboratory and stored in an incubator (4 °C) before bud identification and counting.
All samples were processed within 2 weeks, and no rotting occurred during this period. Only turgid bud tissue was counted, with necrotic or visibly dead tissue discarded. We defined four types of bud bank, according to the morphological characteristics of bud-bearing organs: tiller buds (axillary buds at the shoot bases of caespitose species and rhizomatous grasses); rhizome buds (axillary buds and apical buds on hypogeogenous rhizomes); bulb buds (meristems wrapped in the swollen base of bulb-type species); and buds on below-ground parts of dicotyledonous herbs (comprising diverse organs, such as short hypogeogenous rhizomes, epigeogenous rhizomes and roots capable of adventitious sprouting, but all bearing simple buds not protected by specialized organs), which we hereafter refer to as ‘dicot buds’. Buds on rhizomes and roots could be counted directly, whereas shoot bases needed to be dissected for tiller bud and bulb bud counting.
Data analysis
The original dataset of bud densities was converted into numbers of buds per square metre. The average bud density of each sampling site was then calculated for further analysis. Stepwise multivariate regression was used to relate total bud density to the environmental variables MAT, MAP, aridity, PET and altitude. From the distribution pattern of study sites, we noted that the east end of the transect turns towards the north-east (nine sites), and according to the preliminary analysis the relationship between bud density and climatic variables (MAP and aridity) was fundamentally different between the two parts of the transect, so stepwise multivariate regressions were also conducted to analyse the relationships between environmental variables and total bud densities for the 12 south-western sites and nine north-eastern sites separately. In addition, regression analysis was conducted to explore the changes in total bud densities and in each bud bank type along the MAT, MAP and aridity gradient. The regression types, R2 values and ANOVA tests of probabilities of significance were calculated using the regression curve-fitting routine in the SPSS package. The statistical analyses were performed using SPSS 18.0 (SPSS, USA). Differences were considered significant at P < 0·05.
RESULTS
Relationships between total bud densities and environmental variables
Based on the results of stepwise multivariate regressions, among the five selected enviromental variables (MAT, MAP, aridity, PET and altitude), MAT explained 65 % of the variation in total bud density along the whole transect (P < 0·01). As the east end of our transect turns towards the north-east, we analysed the relationships between total bud densities and environmental variables for the first 12 sites and the remaining nine sites separately. Our results showed that for the western part of the transect (12 sites), aridity explained 60 % of the variation in total bud density (P < 0·05), while for the eastern part of the transect (nine sites) MAP explained 37 % of the variation in total bud density (P < 0·05) (Table 2).
Table 2. Results of stepwise multivariate regression for the relationships between total bud densities and environmental variables
| Dependent variable | |||
|---|---|---|---|
| Independent variable | Total bud density (whole) | Total bud density (12 sites in the west) | Total bud density (9 sites in the east) |
| MAT (°C) | (–)** | … | … |
| MAP (mm) | … | … | (–)* |
| Aridity | … | (–)* | |
| PET (mm) | … | … | … |
| Altitude (m) | … | … | … |
| R2 | 0·65 | 0·60 | 0·37 |
P < 0·01;
0.01<P< 0·05; (−): negative correlation; …: no correlation.
Changes in total bud density along the climatic gradient
In the temperate steppe of northern China, total bud density decreased consistently with increasing MAT (P < 0·01; Fig. 2A). However, the relationship between bud bank density and precipitation/aridity was fundamentally changed along the climate gradient. Along the precipitation gradient, total bud density first increased (from 105 ± 45 to 873 ± 147 buds m−2; P < 0·05) and then decreased significantly (from 3133 ± 330 to 928 ± 177 buds m−2; P < 0·05) with a turning point around MAP= 260 mm, and the total bud density at the moist end was higher than that at the arid end of the gradient (Fig. 2B). Along the aridity gradient, total bud density first increased and then decreased significantly (P < 0·05), with a turning point about aridity = 0·67. Similarly, compared with the total bud density at the moist end, the arid end of the gradient harboured smaller bud density (Fig. 2C).
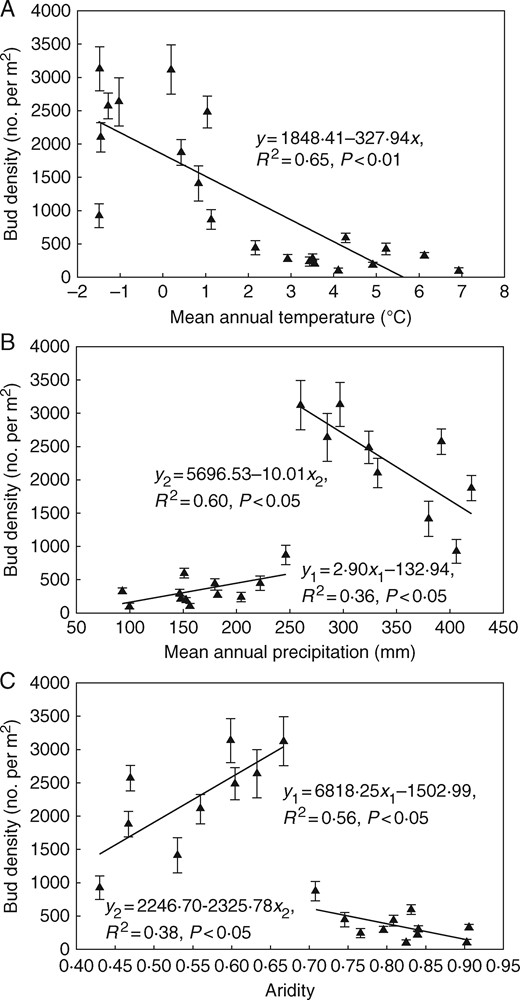
Changes in total bud bank density (mean±s.e.) along the climatic gradient in the temperate steppe of northern China. (A) Mean annual temperature. (B) Mean annual precipitation. (C) Aridity.
Changes in bud bank composition along the climatic gradient
Densities of tiller buds and buds of dicotyledonous herbs as proportions of total bud density fluctuated along the aridity gradient. The proportion of rhizome buds was higher at relatively moist sites (aridity < 0·75), while the proportion of bulb buds was higher at drier sites (aridity > 0·75) (Fig. 3). Densities of all bud types except bulb buds decreased significantly (P < 0·01) along the mean annual temperature gradient (Fig. 4). Of the four bud bank types, tiller buds did not change significantly in density within the drier part of the gradient, but sharply reached a peak at MAP ∼260 mm, then decreased significantly with increasing MAP at the moist end of the gradient. Rhizome buds and buds of dicotyledonous herbs occurred only where MAP was >150 mm, and bud densities increased significantly (P < 0·05) along the precipitation gradient. Bulb buds could be found along the whole gradient and their density did not show consistent changes (Fig. 5).
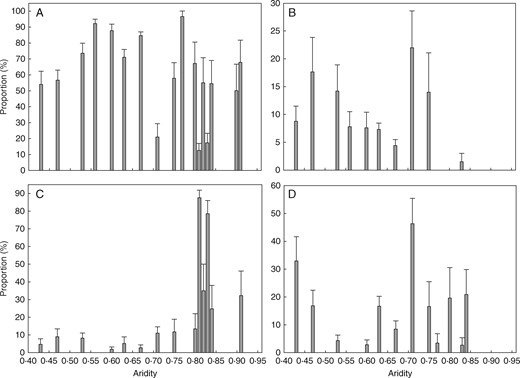
Changes in the proportion (mean±s.e.) of four bud bank types across the aridity gradient in the temperate steppe of northern China. (A) Tiller buds. (B) Rhizome buds. (C) Bulb buds. (D) Dicot buds.
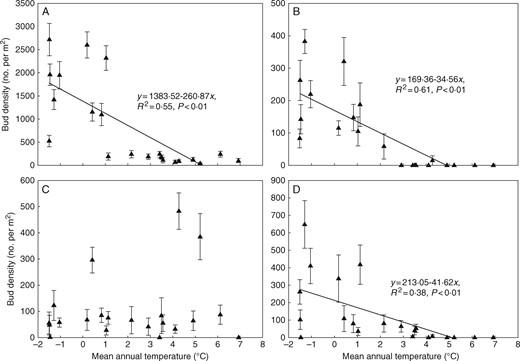
Changes in bud density (mean±s.e.) of different bud bank types along the temperature gradient in the temperate steppe of northern China. (A) Tiller buds. (B) Rhizome buds. (C) Bulb buds. (D) Dicot buds.

Changes in bud density (mean±s.e.) of different bud bank types along the precipitation gradient in the temperate steppe of northern China. (A) Tiller buds. (B) Rhizome buds. (C) Bulb buds. (D) Dicot buds.
Changes in above-ground vegetation along the climatic gradient
Along the climatic gradient, the coverage of above-ground vegetation decreased significantly (P < 0·01) with increasing aridity (Fig. 6A). With regard to vegetation composition along the gradient, the relative richness of annuals in above-ground vegetation increased significantly (P < 0·01) with increasing aridity (Fig. 6B) and sites with higher aridity had a higher biomass proportion than annuals in plant communities (Fig. 6C).
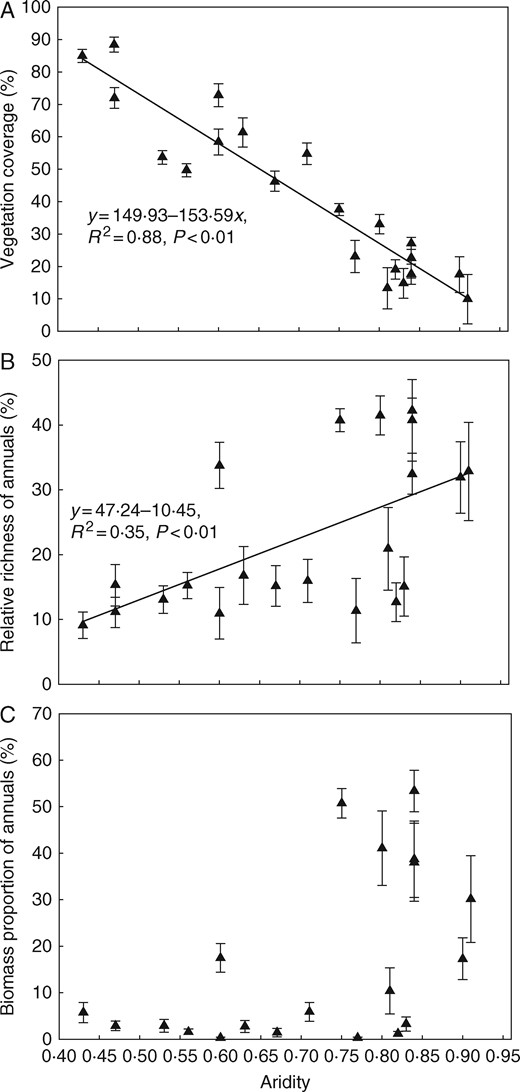
Changes in vegetation coverage (A), relative richness (B) and biomass proportion (C) (mean±s.e.) of annuals along the aridity gradient in the temperate steppe of northern China.
DISCUSSION
Along the 2500-km climatic gradient in China, the temperate steppe’s bud banks were characterized by the predicted pattern, with the smallest bud bank and greatest relative proportion of buds protected by specialized leaf organs (i.e. leaf sheath or scale leaf) at the dry, hot end of the gradient. Indeed, with increasing amounts of precipitation and decreasing temperature, the number of buds increased and their protection evidently was less important. Based on the above-ground vegetation coverage, the relatively sparser vegetation at the driest end of the climatic gradient may contribute to its smaller below-ground bud bank. Importantly, the smaller bud bank and the predominance of annual plants in the arid region imply that plant reproductive strategies and vegetation composition will be shifted under future aridification in the temperate steppe of China. Since bud banks of perennial vegetation can buffer the effects of drought on ecosystems, making it more resistant to increasing drought intensity (Ruppert et al., 2015), with the low bud density and the potential dominance of annuals, the arid end of the gradient in the temperate steppe might be more prone to ecosystem degradation under climate changes.
Total bud density changes along the climatic gradient
In the temperate steppe of Inner Mongolia, precipitation (MAP) increases while temperature (MAT) decreases from west to east along the climatic gradient. To assess the changes in the below-ground bud bank along the climatic gradient, we also used a combined MAP/MAT measure in the form of aridity (Holdridge, 1959, Zomer et al., 2008). Total bud density showed a piecewise relationship with aridity in the present study, with the turning point at aridity=0·67 and bud density ∼3100 buds m−2. The total bud density at the drier sites was lower than that at the moist sites (100 versus 900 buds m−2), supporting our first hypothesis, which yielded the prediction that bud bank density would decrease towards the dry end of the climatic gradient. Since the relative richness of annuals in plant communities increased along the aridity gradient and there was a higher biomass proportion of annuals in the drier region (Table 1, Fig. 6), we speculate that the lower bud densities at the arid end of the gradient are partially attributable to the predominance of annuals in this region. Similarly, a piecewise linear relationship was seen in relation to the precipitation gradient, with the peak bud density at MAP = 260 mm. In contrast, the decrease in total bud density was confirmed along the temperature gradient.
Our results are partially in agreement with the previous study by Dalgleish and Hartnett (2006), who compared bud banks along a gradient of annual precipitation ranging from 269 to 960 mm in the Great Plains of North America. They also found decreasing numbers of buds towards the dry end of the gradient, where the minimum bud density (∼100 buds m−2) was recorded. Our minimal number of buds at the dry end of the gradient was also 100, but the dry end of the Chinese gradient was drier (MAP only 93 mm) than that of the American one. In conditions of ∼260 mm of precipitation per year (equal to the driest place on the American gradient) we found about 3000 buds m−2, which represents the overall maximum recorded for our climatic gradient. These differences might be caused by the different latitudinal positions of the two gradients and therefore the warmer climate along the North American gradient: in our study area in China, the mean temperature in January (the coldest month) ranges from −26·7 to − 11·2 °C and the mean temperature in July (the hottest month) ranges from 15·8 to 21·8 °C, whereas in North American tallgrass prairie the mean temperature range in January is − 4 to 1·6 °C and that in July is 25·1 to 30·6 °C (Dalgleish and Hartnett, 2006). The colder climate in China alleviates the detrimental impact of low precipitation on vegetation.
The relatively lower numbers of buds towards the wet end of the climatic gradient may be connected with higher productivity and larger shoot size. This also leads to lower bud numbers per surface area as the same area may accommodate a higher number of small shoots or a lower number of large shoots (the corners rule; e.g. Kleiman and Aarssen, 2007). It is worth noting that while the total number of buds per area decreased towards the wet end of the climatic gradient, the number of buds for individual bud-bearing organ categories was variable but not decreasing. This may be caused by the fact that 20 cm×20 cm quadrat was rather small for the productive sites and it was often dominated by only one type of bud-bearing organ (tiller buds).
In the present study, total bud density decreased significantly with increasing MAT, and of the tested environmental variables, MAT explained more variability in bud density than other variables due to its consistent effects on buds on different bud-bearing organs (i.e. all buds except bulb buds decreased significantly with increasing MAT). To date, we have found few data enabling comparison of the temperature effect on bud bank density between our study area and other regions. In alpine ecosystems, previous studies suggest that clonal growth and bud banks become more important with decreasing temperature (along with increasing altitude) (Evette et al., 2009). There are also reports about seasonal effects of temperature on bud bank dynamics in wet meadows (e.g. Chen et al., 2015), which we cannot use for comparison as our study is based on snapshot data from the summer period. In short-term experiments with increased temperature conducted on Leymus chinensis, the dominant species in grasslands of northern China, the below-ground bud bank was found to increase in response to simulated warming (Wang et al., 2010; Li et al., 2014), probably due to enhanced growth. Other studies devoted to responses of vegetation to warming usually highlight the connection of warming with dryness and the strong joint effect of these two parameters (De Boeck et al., 2016).
Shifts in below-ground bud bank composition along the climatic gradient
As shown by their changing proportions along the climatic gradient, different bud bank types prevailed in different climatic conditions. In particular, tiller buds and dicot buds could occur along the whole gradient and the proportion of bulb buds was higher at the dry end of the aridity gradient than at moist sites, while rhizome buds were concentrated at the moist end. This is in accord with the second hypothesis’s prediction that the ratio of buds better protected from drought would increase with increasing aridity in comparison with buds located on rhizomes, which also indicates that bulbous species might be at an advantage under water-stress conditions. This pattern is consistent with the habitat preferences of rhizomatous species for moist portions of gradients in other regions (Klimeš, 2003, 2008; Klimešová et al., 2011, 2012). Thus, in a short-term experiment in American prairies, the studied taxonomic groups (differing also in bud-bearing organs) responded differently to drought, although their particular responses (and those of particular bud-bearing organs) showed differences from the observations in our much drier ecosystem; there, dicotyledonous herbs and sedges were more sensitive to experimental dryness than rhizomatous grasses (Vanderweide and Hartnett, 2015). The lack of consistency in reactions of particular bud-bearing organs might be attributable to their specific responses along the gradients or to differences in the species pools.
The dominance of tussock grasses and bulbous plants at the arid end of the gradient also implies that even if perennial herbs relying on bud banks for regeneration are present there, these plants have very limited lateral spread and ability to protect against soil erosion in comparison with rhizomatous species dominating at the wet end of the gradient. Furthermore, under future climatic scenarios, warming and drying are expected to be more severe compared with historical records (Cayan et al., 2010); therefore, exploring trends in bud bank density and composition along the climatic gradient might be crucial for predicting plant community dynamics and ecosystem functioning.
Our method of bud bank determination has limitations. We were able to count only preformed buds on bud-bearing organs and therefore the potential bud bank sensuKlimešová and Klimeš (2007) is under-represented in our study. Potential bud bank consists of adventitious bud formation on roots and this may occur only after plant injury and therefore needs to be examined experimentally.
In conclusion, in the temperate steppe of northern China, below-ground bud bank density decreases towards the dry, hot end of the climatic gradient and bulb buds and tiller buds of tussock grasses are more resistant to environmental stress than bud banks on rhizomes. Our study also demonstrated the paramount effects of temperature on the below-ground bud bank in the temperate steppe. From the perspective of vegetation regeneration, our study indicates that changes in bud bank density and composition along the climatic gradient could be crucial for the prediction of plant community composition and dynamics under future climatic scenarios.
ACKNOWLEDGEMENTS
We thank Jinlei Zhu, Haiyang Zhang, Kai Wei and Chao Wang for their assistance in field sampling and data analysis. We are indebted to Jonathan Rosenthal for his assistance in language editing. We also thank two anonymous reviewers for their valuable comments, which helped us improve the original version of this manuscript. This study was supported financially by the National Nature Science Foundation of China (41271529, 41371077 and 41501573), the Key Project of Chinese National Programs for Fundamental Research and Development (2013CB429905) and the Czech Science Foundation (project no. 14-36079G, Center of Excellence PLADIAS).
