


Abstract
Background Root clusters are bunches of hairy rootlets produced by >1800 species in nine families. The possible involvement of micro-organisms in root-cluster formation has produced conflicting results over the last 40 years. In addition, any effect of rhizobacteria on overall plant growth of root-cluster-bearing species remains unknown.
Aims To evaluate the effect of seven rhizobacteria on total plant size, and relative cluster production, by three species, and relate outcomes to their indole-3-acetic acid (IAA)-producing ability as part explanation of past disparate results.
Methods We grew Leucadendron salicifolium (from South Africa), Viminaria juncea (Australia) and Lupinus albus (Europe) in gnotobiotic, hydroponic culture at two nitrogen (N) levels and inoculated them with seven bacterial strains and harvested the plants after 13 weeks.
Key Results Following inoculation with all seven bacteria individually, plant growth sometimes greatly exceeded that of the aseptic controls, but, under other conditions, growth was less than the controls. Leucadendron and Lupinus failed to produce root clusters in the –N aseptic controls and Viminaria in the +N controls that was overcome by inoculating them with selected bacteria. Six bacteria were able to induce far more root clusters than those of the aseptic controls, while all bacteria sometimes suppressed cluster production in other treatments. All nine possible combinations of resource (plant size, indirect) and morphogenetic (relative cluster production, direct) effects were represented among the results, especially positive synergism (larger plants with a greater density of clusters). There was no clear relationship with IAA-producing ability of the seven bacteria, but low IAA strains of Pseudomonas putida and Bacillus magetarium were associated with greatest cluster production.
Conclusions While root-cluster formation can sometimes be induced by introducing rhizobacteria to aseptic culture, the growth-promoting properties of apparently beneficial bacteria on general growth and root-cluster production are best described as facultative, as their promotory effects depend on host species, growing conditions and index of plant response used.
INTRODUCTION
Root clusters (also called cluster/proteoid roots) are now recognized along with root nodules and mycorrhizas as the three major root modifications among plants for enhancing nutrient uptake from soil (Lamont, 1982; Lambers et al., 2009). They are discrete bunches of hairy rootlets that have been identified in about 1800 species in nine Angiosperm families so far (Fig. 1; Lamont, 2003, Shah et al., 2015). Unlike nodules and mycorrhizas, root clusters are not a response to invasion by rhizosphere micro-organisms, although there has been conflicting support, subsequent to the two reports in 1974, that a microbial stimulus is required for their initiation (Lamont, 2003). In the first study to test specific bacteria, Lamont et al. (2015) demonstrated that there were circumstances (depending on host species identity, nutrient availability and bacterial type) where rhizobacteria were essential for root cluster formation by two Australian species but others where they were not, solving a 40-year puzzle. Two bacteria varying in their auxin production and four combinations of phosphorus (P) and nitrogen (N) were used.
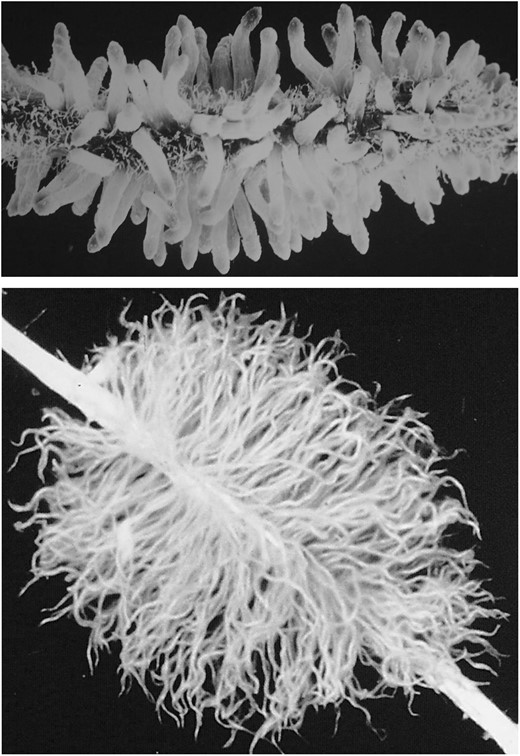
Proteoid root clusters of Leucadendron salicifolium (upper, 15 mm long with immature rootlets – yet to produce root hairs) and Viminaria juncea (lower, 45 mm long with mature rootlets).
Thus, Lamont et al. (2015) identified four possible types of outcome: No effect – production of unclustered and clustered roots is not altered by the presence of rhizobacteria; Resource (indirect) effect – growth of parent (unclustered) roots is (a) enhanced or (b) suppressed by bacteria, affecting their ability to support (act as a resource for) root clusters; Morphogenetic (direct) effect – production of root clusters is specifically (a) enhanced or (b) suppressed by bacteria per unit parent root; and Synergistic effect – both resource and morphogenetic effects result in a net (a) enhancement or (b) reduction in root-cluster production.
The present study had five objectives to extend and generalize the results obtained by Lamont et al. (2015): to determine if the same outcomes apply to species that produce root clusters from various parts of the world, namely Australia, the Mediterranean Basin and the Cape, South Africa; to increase the range of rhizobacterial types from two to seven in the search for strains that promote root cluster production; to assess to what extent rhizobacteria affect general plant growth of cluster-bearing species (not reported before); to test the hypothesis that bacterially sourced auxin has a major role in controlling root-cluster formation, especially in relation to high (H) and low auxin (L) strains of the same bacterium; and to show that any effect of bacteria on root-cluster production is modified by N status of the growing medium.
It is well established that certain rhizobacteria may have a profound beneficial effect on general plant growth (Lugtenberg and Kamilova, 2009; Hayat et al., 2010). Such organisms are called plant-growth-promoting bacteria (PGPB). For example, Bacillus megaterium may increase shoot growth of tea (Camellia sinensis) four-fold and double nutrient content of strawberry (Fragaria × ananassa) leaves (Chakraborty et al., 2006; Ipek et al., 2014). The possible mechanisms through which this is achieved by this bacterium alone include secretion of auxin (indole-3-acetic acid, IAA); deaminase of an ethylene precursor; the phosphate-hydrolysing enzyme, phytase; metal-chelating siderophores; and anti-pathogenic agents such as polyphenols and chitinase. Many genera are diazotrophic (Islam et al., 2013) and even rhizobia may have PGPB properties independent of their ability to fix atmospheric N2 symbiotically (Sessitsch et al., 2002; Kaur et al., 2012). Thus, Bradyrhizobium produces nitrate reductase and IAA and metabolizes citrate (abundant in root clusters, Shane et al., 2003a).
Effects of rhizobacteria on growth may be positive or negative (Ridge et al., 1992). For example, two Bacillus species promote growth of the root-cluster-bearing species Alnus glutinosa, while Pseudomonas fluorescens reduces its growth (Probanza et al., 1996). Bacillus mageratium may induce a three-fold increase in root length over the control with six times more root clusters in Viminaria juncea but a 40 % reduction in root length and no root-cluster production in Hakea laurina (Lamont et al., 2015). In addition, low concentrations of PGPB inocula may promote root elongation/general growth while high concentrations of the same bacterium may inhibit root elongation and growth but greatly increase the density and length of root hairs (Dobbelaere et al., 2002; Spaepen et al., 2008).
Growing conditions affect the state of both the host plant and its rhizobacteria and their interaction. Thus, Mehta et al. (2014) noted that the beneficial effects of the P-solubilizing Bacillus circulans on apple (Malus domestica) root growth were suppressed in the presence of KH2PO4. Furthermore, the composition and PGP traits of rhizobacteria are affected by nutrient status of the medium and plant (Marschner et al., 2004). Thus, tryptophan exuded by the plant, a function of its N status, affects the ability of rhizobacteria to produce IAA (Persello-Cartieaux et al., 2003). For four combinations of N and P concentrations in water culture inoculated with Bradyrhizobium elkanii, root length of V. juncea varied from three times the control to no difference, and relative root-cluster production from three times to 7 % of the control (Lamont et al., 2015). Root cluster production in Lupinus albus varies with leaf P concentration (Shane et al., 2003b) but it is unknown if P-solubilizing PGPB may contribute to cluster formation. Furthermore, the clusters of Lupinus albus are more efficient at absorbing organic N (glycine) than non-clusters (Hawkins et al., 2005) and it raises the question of the importance of soil N supply as it might interact with its rhizobacteria in cluster production.
Exogenous IAA and synthetic auxins can have stimulatory, neutral or inhibitory effects on root growth generally and root-cluster formation in particular (Neumann et al., 2000; Lamont, 2003). As the response curve is bell-shaped (Tanimoto, 2005), this means that root-cluster production is at first enhanced then suppressed as auxin concentration continues to increase. Once root-cluster production ceases, ongoing increases in auxin will have no further effect even though ‘normal’ root production may continue to rise. Plant hormone production increases with greater plant mineral nutrient status (Kuiper et al., 1989) and it is noteworthy that the auxin root-response curves mimic their response curves to increasing levels of N and P (Lamont, 2003). In addition, cluster production in Grevillea robusta peaks at 10 times the auxin concentration as in Lupinus albus (Skene and James, 2000) so sensitivity to auxins varies between species.
Rhizobacteria produce IAA at low, moderate or high levels (Table 1; Barazani and Friedman, 1999). Wild-type Pseudomonas putida promotes root elongation and proliferation of rootlets among several species, in contrast to the IAA-deficient mutant (Patten and Glick, 2002). Note that wild-type, IAA-producing bacteria may have opposing effects on root growth and this probably reflects the bell-shaped relationship that plant growth has with increasing auxin concentration (Spaepen et al., 2007).
Rhizobacterial species/strains used in this trial and their IAA production when grown in nutrient broth
| Rhizobacterial species/strain | IAA production (mg L–1) |
|---|---|
| Acinetobacter oleivorans | 2·35 |
| Stenotrophomonas maltophilia | 2·80 |
| Bacillus megaterium – Low IAA strain (L) | 8·27 |
| Pseudomonas putida – Low IAA strain (L) | 9·85 |
| Bacillus megaterium – High IAA strain (H) | 15·33 |
| Bradyrhizobium elkanii | 19·92 |
| Pseudomonas putida – High IAA strain (H) | 23·03 |
Finally, bacteria associated with root clusters might have had an involvement in their formation. The rhizosphere of root clusters is rich in non-pathogenic bacteria (Lamont and McComb, 1974; Weisskopf et al., 2005) and these may differ in diversity from unclustered roots (Marschner et al., 2004). Proteoid-root-cluster soil from two species of Cape Proteaceae yielded 28 bacterial clades that included three species confined to the clusters (Stafford et al., 2005). Acidophilous Burkholderia is the major genus in the root clusters of Lupinus albus (Weisskopf et al., 2011) and IAA-producers are particularly abundant in young clusters of this species (Weisskopf et al., 2005). The occurrence/abundance of root clusters has been correlated with the presence/abundance of rhizobacteria in Banksia and Hakea (Proteaceae), Lupinus and Viminaria (Fabaceae), and Casuarinaceae (Gardner et al., 1982; Subba Rao and Rodríguez-Barrueco, 1995; Lamont, 2003). But only Bradyrhizobium elkanii and Bacillus mageratium have been shown to promote cluster formation under certain conditions so far (Lamont et al., 2015).
To achieve our objectives, we chose Leucadendron salicifolium (Proteaceae, from South Africa), Viminaria juncea (Fabaceae, from Australia) and Lupinus albus (Fabaceae, from Europe), all known to produce root clusters. As potential root-cluster inducers, we used two rhizobacteria from an earlier study (Bradyrhizobium elkanii and Bacillus mageratium; Lamont et al., 2015) for comparison, plus high and low IAA-producing strains of Pseudomonas putida and Bacillus mageratium, and Acinetobacter oleivorans and Stenophomonas malophilia known to produce little IAA (to increase the range sampled; Table 1). All have been recorded in rhizospheres, at least at the generic level (including in root clusters; Stafford et al., 2005; Collavino et al., 2010). The hydroponic solution was either balanced with N or N was omitted, as N supply was shown to be critical previously (Lamont et al., 2015) and is potentially important for the two legumes used.
MATERIALS AND METHODS
Hydroponic experiment
Sixteen tanks, 45 × 32 × 40 cm, were set up in a light- and temperature-controlled laboratory at the University Pablo de Olavide, Spain. The tanks were sterilized as described in Lamont et al. (2015). Three plant species, known to produce proteoid-type root clusters (Gardner et al., 1981; Lamont, 1982), were chosen from three mediterranean regions. Seeds of the medium-sized shrub Leucadendron salicifolium, native to the Cape, South Africa, and collected from the wild, Viminaria juncea, a tall shrub native to south-west Australia and collected from the wild, and Lupinus albus, an annual native to the Mediterranean Basin and collected from cultivated plants in Spain, were germinated. They were first surface sterilized with 5 % NaOCl for 3 min followed by immersion in 10 % ethanol for 3 min and germinated aseptically in agar medium at 20 °C for 12 h and 10 °C for 12 h.
Ten-day-old seedlings of all species were suspended over the culture solution supported by autoclaved discs of sponge rubber in individual plastic cylinders, 4 × 30 cm, without bottoms and bearing four holes on the side to allow solution flux, in each tank. The nutrient solutions were 5 % Hoagland’s lacking P (as this promotes root-cluster production) either with 0·05 mm KNO3 or lacking added N, as used in Lamont et al. (2015). Each tank received 6 litres of nutrient solution containing one of either seven species/strains of rhizobacteria (listed in Table 1) inoculum from cultures maintained in our laboratory plus aseptic control. Bacteria were chosen on the basis of their ability to produce a wide range of auxin levels, including two species with high and low IAA strains. Bacterial inoculants were prepared from 50 mL of nutrient broth culture (Luria–Bertani for all bacteria except for Bradyrhizobium, which was grown in yeast/mannitol) inoculated with a single colony of each bacterium and shaken at 180 r.p.m. at 25 °C for 18 h. One-millilitre samples of this solution were then transferred to 500-mL conical flasks of broth and cultured similarly for 4 h to ensure the bacteria were in the ‘logarithmic phase’ of growth.
Plants were continuously aerated from UV-treated equipment and maintained in a controlled environmental chamber for 14 h at 22 ± 1 °C day and 10 h at 18 ± 1 °C night. Light was supplemented with fluorescent tubes (Osram daylight) at 950 µE m−1 s−1 at a distance of 30 cm from the base of the shoots. The boxes were maintained as described in Lamont et al. (2015). After 13 weeks all plants were harvested. Contamination and premature death of plants reduced the number of replicates to 4–10 per treatment, with a mean of 7. Numbers of root clusters and nodules were counted. Plants were separated into roots and shoots, dried at 70 °C for 2 days and weighed.
Statistical analyses
Three attributes were analysed separately: total plant weight, number of root clusters per plant and number of root clusters/unit root system weight. The data were grouped into the two N treatments and three plant species with their eight bacterial treatments to give 3 attributes × 2 nutrients × 3 species = 18 sets for analysis. They were analysed by ANOVA followed by Tukey’s HSD test with significance accepted at P ≤ 0·05 (two-tailed). Each of the 2 × 2 × 3 sets of root data contained 2–5 treatments with zero root clusters; these were omitted from the ANOVAs and added later as significantly different from the lowest values. In addition, root cluster numbers were analysed for covariance (ANCOVA), with root system weight as independent covariate, before treating as above. We used the online resource http://vassarstats.net (authored by R. Lowry, accessed August 2015). For particular frequency sets of data, goodness-of-fit and contingency χ2 tests (large samples) and Fisher exact tests and binomial probabilities (small samples) were applied. To test for overall treatment–species interaction effects (+/− clusters vs. high/low IAA) among two bacteria varying in IAA-producing ability, log-linear three-way contingency analyses were undertaken. By comparing three plant-size categories with three cluster numbers/unit root weight categories (based on the Tukey HSD results) it was possible to assign the nine possible outcomes to six categories (plus no effect): root-cluster production was a specific response (negative or positive) to the treatment (morphogenetic effect) over and above any general plant growth (negative or positive) response (resource effect). The response was labelled ‘synergistic’ when both plant growth and clusters/root weight (equivalent to ‘adjusted clusters’ used in Lamont et al., 2015) were significantly different (negative or positive) from the control in the same direction.
RESULTS
The eight treatments (seven bacteria plus control) within the 18 data sets were overall significantly different by ANOVA or ANCOVA (Table 2), 15 at the P < 0·001 level. Among the three host species, individual bacteria induced up to ten times total plant weight that of the control to as low as 12 % of the control independent of N levels (although all plants died in one treatment). All seven bacteria were able to induce total growth > control (40·5 % of treatments), and all, except Pseudomonas L, growth < control (19 %). Bacillus L and Pseudomonas L were the only bacteria to achieve growth > control in all three hosts in at least one of the N treatments. In the presence of microbes, there was no significant difference between total growth between the –N and +N treatments for any of the host species (paired t-test, one-tailed for the hypothesis that +N > –N). Leucadendron and Lupinus failed to produce root clusters in the absence of microbes at –N but they did at +N, whereas the reverse was found for Viminaria.
Mean total plant weight, number of root clusters per plant and number of root clusters/unit root weight for three plant species (Leucaden. = Leucadendron) inoculated with seven rhizobacterial species/strains plus control grown at two levels of nitrogen (N) in 5 % Hoagland's solution for four months
| N | Treatment | Total plant weight (g) | No. of root clusters | Root clusters/g root weight | ||||||||||||||||
|---|---|---|---|---|---|---|---|---|---|---|---|---|---|---|---|---|---|---|---|---|
| Leucaden. | Viminaria | Lupinus | Leucaden. | Viminaria | Previous | Lupinus | Leucaden. | Viminaria | Lupinus | |||||||||||
| − | Control | 0·34 | d | 14·42 | c | 3·89 | de | 0·0 | c | 10·8 | ab | 4·5 | 0·0 | b | 0·0 | c | 6·2 | a | 0·0 | c |
| − | Bradyrhizobium | 1·49 | b | 10·72 | e | 2·02 | f | 1·4 | b | 0·0† | c | 0·0 | 3·6† | a | 3·4 | b | 0·0 | d | 4·0 | a |
| − | Bacillus high IAA | 0·49 | d | 24·82 | a | 5·19 | cd | 0·0 | c | 8·9 | ab | − | 0·0 | b | 0·0 | c | 1·6 | b | 0·0 | c |
| − | Bacillus low IAA | 0·78 | c | 14·28 | c | 10·1 | a | 1·2 | b | 17·1 | a | 17·1 | 2·6 | a | 4·0 | b | 4·9 | ab | 0·9 | b |
| − | Pseudomonas high IAA | 0·47 | d | 14·34 | c | 2·91 | de | 0·0 | c | 0·0 | c | − | 5·6 | a | 0·0 | c | 0·0 | d | 5·0 | a |
| − | Pseudomonas low IAA | 2·81 | a | 13·88 | c | 7·30 | b | 15·7 | a | 5·0 | b | − | 7·6 | a | 62·4 | a | 2·0 | ab | 8·2 | a |
| − | Acinetobacter | 0·42 | d | 17·26 | b | 3·20 | ef | 0·0 | c | 4·5 | b | − | 0·0 | b | 0·0 | c | 2·9 | ab | 0·0 | c |
| − | Stenotrophomonas | 0·58 | d | 12·89 | d | 5·52 | c | 0·8 | bc | 4·2 | b | − | 3·7 | a | 8·0 | b | 2·7 | ab | 5·5 | a |
| P | ANOVA/Tukey’s HSD | <0·0001 | <0·0001 | <0·0010 | <0·0001 | <0·0001 | <0·0001 | <0·0001* | 0·0350* | <0·0001* | ||||||||||
| + | Control | 1·50 | c | 4·21 | e | 3·19 | bc | 1·6 | b | 0·0 | c | 5·4 | 5·1 | ab | 7·9 | a | 0·0 | c | 5·0 | b |
| + | Bradyrhizobium | 3·67 | a | 15·99 | c | 4·74 | ab | 7·8 | a | 35·3† | a | 27·5 | 6·9† | a | 4·8 | a | 9·5 | a | 4·9 | bc |
| + | Bacillus high IAA | 0·33 | d | 10·56 | d | 4·03 | bc | 0·0 | c | 15·1 | b | − | 1·8 | b | 0·0 | c | 10·6 | a | 1·2 | c |
| + | Bacillus low IAA | 0·58 | d | 8·49 | d | 4·70 | ab | 0·0 | c | 11·6 | b | 33·0 | 3·0 | b | 0·0 | c | 6·9 | a | 1·4 | bc |
| + | Pseudomonas high IAA | 2·58 | b | 0·51 | f | 5·80 | a | 0·0 | c | 0·0 | c | − | 3·2 | ab | 0·0 | c | 0·0 | c | 4·3 | bc |
| + | Pseudomonas low IAA | 1·29 | c | 41·00 | a | 2·67 | cd | 0·0 | c | 7·4 | b | − | 3·5 | ab | 0·0 | c | 1·8 | b | 12·8 | a |
| + | Acinetobacter | 1·87 | bc | 26·04 | b | 1·59 | d | 0·0 | c | 0·0 | c | − | 0·0 | c | 0·0 | c | 0·0 | c | 0·0 | d |
| + | Stenotrophomonas | 1·98 | bc | 42·57 | a | all died | 4·0 | a | 0·0 | c | c | all died | 6·3 | a | ||||||
| P | ANOVA/Tukey’s HSD | <0·0010 | <0·0010 | <0·0010 | <0·0010 | 0·0003 | − | 0·0050 | <0·0010* | <0·0010 | <0·0001* | |||||||||
Different letters beside each set of eight treatments imply they are different at the 5 % level by Tukey’s HSD test with a = largest mean, b = next largest and so on. For the ANCOVA, number of root clusters is treated as dependent variable and root system weight as covariate. ‘Previous’ refers to equivalent results from Lamont et al. (2015). See Experimental procedures and Table 1 for full species names.
* ANCOVA.
† All plants with nodules.
All bacteria, except Acinetobacter, were able to induce numbers of root clusters > control (34 % of treatments), especially Bradyrhizobium, where four of six treatments were associated with cluster production > control. All bacteria were sometimes associated with zero clusters among the three host plants (39 %), especially Acinetobacter, where five of six treatments failed to yield clusters. All, except Acinetobacter, were able to induce numbers of root clusters per unit root system weight > control among the three hosts, especially Bradyrhizobium and Pseudomonas L, for which four of six treatments were associated with cluster production > control. Overall, relative cluster production was enhanced by the presence of bacteria in 39 % of treatments and suppressed in 22 %.
Combining the –N and +N data, rhizobacteria induced up to 2–3 greater growth of the controls among the three species but only in Viminaria was plant growth always greater than the controls in the presence of any of the seven microbes (Table 3). A different bacterium was responsible for each of the six sets of results for total growth. Mean root cluster numbers ranged from zero (all three species) to two (Lupinus) to ten (Leucadendron) times the controls. Three bacteria were involved with the five paired zero values and two with the highest, Pseudomonas L and Bradyrhizobium. Results for relative root cluster numbers were similar. Pseudomonas L was the only bacterium responsible for the highest results for a given species (Leucadendron) across all three attributes. Acinetobacter was the only bacterium associated with the (sometimes equal) lowest values across the three attributes (Lupinus). Bradyrhizobium induced the lowest plant weight in Viminaria but the highest root cluster count.
Ratio of lowest and highest value of each growth attribute relative to the control among seven rhizobacteria combining results for the two nitrogen levels; collated from Table 2
| Species | Total plant weight | No. of root clusters | Root clusters/g root weight | |||||||||
|---|---|---|---|---|---|---|---|---|---|---|---|---|
| Lowest | Highest | Lowest | Highest | Lowest | Highest | |||||||
| Leucadendron | 0·45 | BH | 2·23 | PL | 0·00 | BH,PH,A | 9·88 | PL | 0·00 | BH,PH,A | 9·04 | PL |
| Viminaria | 1·44 | Br | 2·98 | S | 0·00 | PH | 3·27 | Br | 0·00 | PH | 1·97 | BH |
| Lupinus | 0·68 | A | 2·10 | BL | 0·00 | A | 2·18 | Br | 0·00 | A | 4·20 | PL |
BH, Bacillus high IAA; Br, Bradyrhizobium; A, Acinetobacter; PL, Pseudomonas low IAA; S, Stenotrophomonas; BL, Bacillus low IAA; PH, Pseudomonas high IAA.
Comparing plant size (resource effect) against relative root cluster production (morphogenetic effect) relative to the aseptic controls, some of the treatments were present in all nine possible outcomes independent of N level (Table 4) but they were not evenly distributed within them (P = 0·0265). Cluster production on a per-root-system-weight basis tended to be suppressed among the smaller plants (negative synergistic effect) but enhanced among the larger plants (positive synergistic effect), while those with no change to plant size or relative cluster production were also well represented (no effect). The –N treatments were best represented among the no change/promoted clusters while the +N treatments were best represented among the suppressed clusters (P = 0·0018), i.e. low N best enhances root cluster production in the presence of microbes. All, but only, replicates of the two legumes in the Bradyrhizobium treatments possessed root nodules, although their presence was unrelated to root cluster production.
Overall root cluster production per unit root weight versus plant size in the presence of seven rhizobacteria compared with the controls based on Tukey’s HSD test in Table 2
| Root clusters | Plant size relative to control | Overall | ||
|---|---|---|---|---|
| Smaller | Same | Larger | ||
| Suppressed | 0/5 (↓s) | 1/3 (↓m) | 0/3 (↓m) | 1/11 Θ |
| No change | 4/0 (↓r) | 5/2 Θ | 1/1 (↑r) | 10/3 Θ |
| Promoted | 1/0 (↑m) | 3/2 (↑m) | 6/5 (↑s) | 10/7 Θ |
| Overall | 10 Θ | 16 Θ | 16 Θ | P = 0·0018 (χ2) |
| Sum of cells compared by Fisher exact test: P = 0·0265 | ||||
Results given as −N/+N and compared overall by χ2 test. ↓m, negative morphogenetic effect; ↑m, positive morphogenetic effect; ↓r, negative resource effect; ↑r, positive resource effect; ↓s, negative synergistic effect; ↑s, positive synergistic effect; Θ, no effect
For the three species, relative root cluster production could be zero or positive at almost any level of putative IAA secretion by the bacteria (Fig. 2). In addition, there was a tendency for cluster production to peak at intermediate levels of IAA and be suppressed at both high and low levels. There were clearer trends for the two IAA strains of Bacillus and Pseudomonas (Table 5). At –N, there was a strong interaction between production of root clusters in the presence of the L strains and absence in the presence of the H strains. Conversely, at +N, there was no interaction such that overall H = L. In none of the 11 treatments (the 12th treatment was inadequately replicated for analysis) was there any species where H > L (P = 0·0231 of zero occurring by chance), i.e. root cluster formation is most likely at low (actually intermediate) levels of bacterially supplied IAA. Using the mean number of clusters per plant from Table 2, Wilcoxon signed ranks test (including mean of the 12th treatment) showed that L and H (L > H: 9, L = H: 2, H > L: 1) were different at P = 0·0300 (two-tailed).
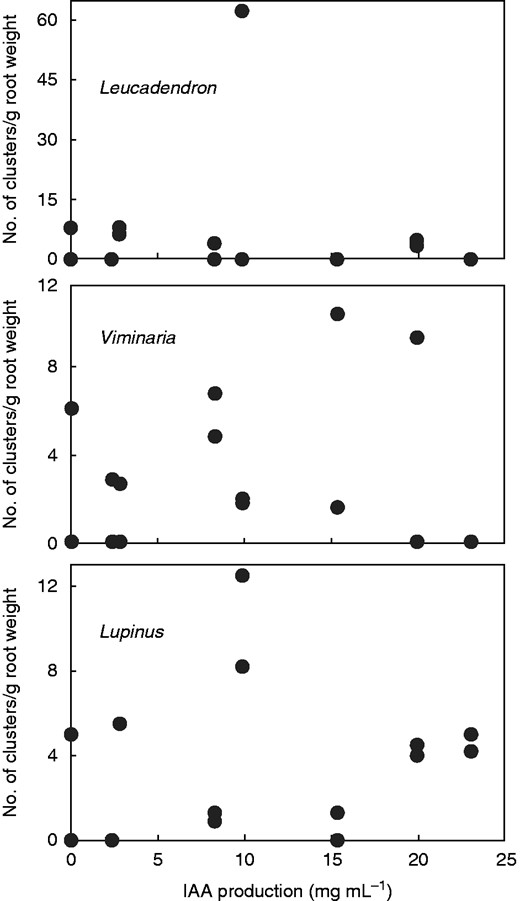
Root cluster production relative to root system weight versus putative IAA production by seven selected rhizobacteria plus control at two nitrogen levels (not distinguished here as there was no pattern).
Log-linear analyses of three-way contingency table [3 plant species × high (H)/low (L) IAA strains of stated bacterium × presence/absence of root clusters among n replicates in each sample) at two levels of nitrogen; interaction refers to the overall significance between all species analysed for clusters present with L and absent with H
| Nitrogen | Bacterium | Root cluster production (+/−) | |||
|---|---|---|---|---|---|
| H > L | H = L | L > H | P (interaction) | ||
| − | Bacillus | 0 | 1 | 2 | <0·0001* |
| − | Pseudomonas | 0 | 1 | 2 | <0·0001* |
| + | Bacillus | 0 | 2 | 0 | 0·9999 |
| + | Pseudomonas | 0 | 2 | 1 | 0·2088† |
| 0 | 6 | 5 | 0·0231‡ | ||
*Overall interaction term significant (L > H) but species effect detected.
†Interaction term non-significant (H = L) but species effect detected.
‡Binomial probability (two-tailed) of registering 0 (i.e. for H > L).
DISCUSSION
Our results highlight how the impact of rhizobacteria on plant growth depends on four criteria: (a) identity of the bacterial strain, (b) identity of the host plant, (c) growing conditions and (d) index of plant response used. Thus, Pseudomonas L alone may induce <1–10 times total plant weight of the controls and a mean of 0–16 root clusters per plant, depending on host species and N availability (Table 2). Individual bacteria among the seven strains used at a fixed (+) N level may induce from total plant death up to 10 times total weight of the controls and a mean of 0–35 clusters per plant, depending on host species (Table 2). Thus, it is not possible to designate a given rhizobacterium as plant-growth promoting (or suppressive) in any absolute way, despite common practice (Probanza et al., 1996; Barazani and Friedman, 1999; Ipek et al., 2014): they are best classified as facultative PGPB or described as PGP only in regard to a strict set of conditions as noted above. Given a sufficiently wide range of hosts or growing conditions, our work shows that individual PGPB may produce positive, neutral or negative effects on overall growth. Nevertheless, Pseudomonas L was the only bacterium not to show any instance of a deleterious effect on plant growth, although it did on root-cluster production.
Four bacterial strains induced the production of root clusters in Leucadendron that otherwise lacked them in the aseptic –N control, and five strains for Lupinus. Even so, both species produced clusters in the aseptic +N control, confirming that there is no absolute requirement for a microbial stimulus in cluster formation (Lamont et al., 2015). In contrast, Viminaria lacked clusters in the aseptic +N treatment but they were produced strongly when inoculated with any of the four bacteria. Bradyrhizobium, Bacillus L and Pseudomonas L were the only strains that induced root cluster production that exceeded the control in all three host plants. It is noteworthy that all bacteria, except Acinetobacter, were associated with stimulation of cluster production in at least one treatment, while all bacteria, except Stenotrophomonas, were also associated with suppression of cluster production (to zero).
For Viminaria, the only host species in common with the previous study (Lamont et al., 2015), five of the six matched treatments were qualitatively equivalent (Table 2), the exception being the +N control that lacked clusters in the control here although they were only <20 % of the two bacterial treatments before. This highlights the sensitivity of cluster formation to conditions of the trial, here possibly because the previous trial lasted longer to give more opportunity for cluster production. Of the four strains associated with maximum growth or cluster production in the three species, only two were in common, Bacillus L and Pseudomonas L, giving some generality to their beneficial effects.
Comparing plant size (resource effect) against relative root cluster production (morphogenetic effect) relative to the aseptic controls showed that some of the 42 treatments were present among all nine possible outcomes (Table 4). Of note is relative root cluster production tending to be suppressed among the smaller plants but enhanced among the larger plants. This indicates that there may be a critical root system size before clusters can be produced (Lamont, 2003), whose size may well be influenced by the associated rhizobacteria. That plants with larger root systems may also produce more clusters per unit root (positive synergistic effect) must be a specific response to the presence of that bacterium.
Regarding growing conditions, that the expected result of total growth of +N > –N for the inoculated plants was not supported may have been due to the fact that many of the bacteria used are possibly N2 fixers (Islam et al., 2013; Ipek et al., 2014) or the extra N induced IAA production (or other N-bearing compounds) by the bacteria to inhibitory levels. Thus, Probanza et al. (1996) attributed greater growth of the non-nodulated plants of Alnus glutinosa in the presence of Bacillus strains to their N2-fixing ability. Even so, the –N treatments best enhanced root-cluster production in the presence of bacteria (Table 4), consistent with their usual greatest expression in nutrient-impoverished soils (Lamont, 2003). All, and only, replicates of the two legumes in the Bradyrhizobium treatments possessed root nodules but treatments without nodules had more or fewer clusters than those with nodules, confirming that nodule production is unrelated to root-cluster production (Lamont et al., 2015). There was some indication that root-cluster production was more sensitive to the identity of the rhizobacteria in Leucadendron than in Lupinus and, to a lesser extent, in Viminaria, but there is no obvious explanation other than that some host specificity might be involved.
Collating results from Lamont et al. (2015) and here, five of 14 aseptic treatments (35 %) failed to produce root clusters that were overcome simply by inoculating with selected rhizobacteria. This involved two legumes (Lupinus, Viminaria) and two proteas (Hakea, Leucadendron). In addition, root-cluster production was strongly promoted in a further 21 of 58 gnotobiotic treatments (36 %) and suppressed (often to zero) in 17 (29 %). The model of Lamont (2003) relating plant nutrient status and presence of bacteria to the formation of (proteoid) root clusters is now seen to be inadequate. First, the model does not distinguish resource (plant size) and morphogenetic (cluster production per unit root system size) effects. Second, low-nutrient plants may still not produce clusters if (a) the root system is too small or (b) only ineffective/suppressive bacteria are present. Third, one can devise aseptic conditions whereby clusters are still produced, independent of host species identity, although of course asepsis would never occur in nature.
It is possible to interpret the results for the effect of the high (H) and low (L) IAA-mutant strains of Bacillus and Pseudomonas on root cluster production in terms of the classic bell-shaped curve for auxins (Ridge et al., 1992; Tanimoto, 2005) (Fig. 3). The overwhelming trend was for cluster production to be suppressed with H strains (often to zero) compared with its L partner, even though total growth remained high (Table 5). This attests to the fact that cluster production is not just more sensitive to nutrient and auxin levels than the rest of the plant (Lamont, 2003) but that it is the net outcome of the presence of endogenous (plant) and exogenous (bacterial) auxin at the potential site of induction so that effective levels are higher than otherwise expected.
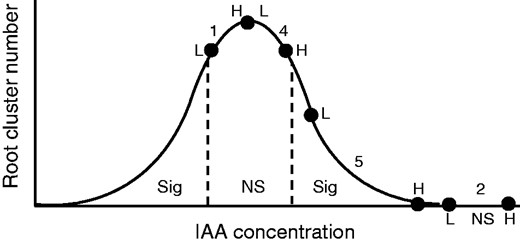
Possible interpretation of results for root cluster production induced by low (L) and high (H) IAA strains of Bacillus megaterium and Pseudomonas putida placed on the standard hypothetical response curve for increasing IAA concentration, here at the site of potential root-cluster formation. The relative position of each pair of data (L and H) is shown by dots with the number of pairs in that region placed between their bounds and their level of significance indicated by sig (significant) and NS (non-significant) from the analysis in Table 2. Note that each pair of data should be placed on its own bell-shaped curve determined by bacterium, host species and growing conditions but are placed on the same curve here so that overall trends become clear.
Overall, there was little relationship between putative IAA production by all seven bacteria and root cluster production (Fig. 2). Although there was a tendency for cluster production to peak at intermediate IAA levels (Bacillus L and Pseudomonas L), clusters could be present or absent at any putative IAA level. This lack of a relationship is not unexpected: (a) other beneficial and inhibitory products produced by rhizobacteria (see Introduction) and roots (Neumann et al., 2000, for phenolics) will affect both plant growth and rhizosphere activity; (b) IAA production under hydroponic conditions and at varying levels of N is no doubt different from that in nutrient-adequate broth where the IAA values we used were obtained; (c) biosynthesis of products by rhizobacteria is a function of their concentration at the root surface such that, as their concentration increases, plant responses follow the classic bell-shaped curve (Fallik et al., 1988; Dobbelaere et al., 2002); and (d) we did not monitor microbial activity. Nevertheless, it is noteworthy that the bacterium with almost no propensity to induce clusters, Acinetobacter, is least able to synthesize IAA (Table 1), while one of the most effective, Bradyrhizobium, was the second most IAA-productive.
Future research
A more complete protocol than we used would involve (a) isolating common bacteria from primordial root clusters, (b) inoculating root-cluster-bearing species with the isolates, (c) determining their effectiveness, (d) identifying possible PGP compounds that they secrete and (e) testing the effectiveness of these compounds individually and in mixture in an attempt to mimic the effects (Collavino et al., 2010). Burkholderia is the major genus in the root clusters of Lupinus albus (Weisskopf et al., 2011), yet any role it might have in cluster formation is unknown. How the apparently beneficial rhizobacteria perform in soil is another challenge yet to be explored. Possible interaction effects between co-occurring bacteria might also be significant (Fallik et al., 1988; Felici et al., 2008). Just as identifying stimulatory rhizobacteria and their role in root-cluster formation is in its infancy, so too is understanding their role in the efficient functioning of root clusters that has been treated in the past as operating in a sterile environment (see Weisskopf et al., 2011, for a rare exception).
ACKNOWLEDGEMENTS
The reviewers are thanked for their perceptive comments.
LITERATURE CITED
