


Abstract
Background and Aims Root hydraulic limitations (i.e. intra-plant restrictions to water movement) may be related to crop performance under drought, and groupings in the hydraulic function of drought-tolerant and drought-susceptible rice (Oryza sativa) varieties have been previously reported. This study aimed to better understand the environmental and physiological relationships with rice root hydraulics under drought.
Methods Xylem sap bleeding rates in the field (gsap g–1shoot) were measured on seasonal and diurnal time frames, during which time environmental conditions were monitored and physiological measurements were conducted. Complementary experiments on the effects of vapour pressure deficit (VPD) on root hydraulic conductivity and on transpiration rates of de-rooted tillers were conducted in growth chambers.
Key Results The diurnal effects on bleeding rate were more closely related to irradiance than VPD, and VPD effects on root hydraulic conductivity measured on 21-day-old plants were due to effects on plant growth including root surface area, maximum root depth and root:shoot ratio. Leaf osmotic potential was related to the grouping of drought-tolerant and drought-susceptible varieties in rice root hydraulics, and these groupings were independent of differences in phenology. Low single-tiller bleeding rates were observed under high evapo-transpirational demand, higher bleeding rates were observed at more negative leaf osmotic potentials in drought-susceptible varieties, and drought-tolerant and susceptible varieties differed in the VPD-induced increase in transpiration rates of de-rooted tillers. Low root suberin amounts in some of the drought-susceptible varieties may have resulted in higher ion transport, as evidenced by higher sap K+ concentration and higher bleeding rates in those varieties.
Conclusions These results provide evidence of the environmental effects on shoots that can influence root hydraulics. The consistent groupings of drought-tolerant and susceptible varieties suggest that traits affecting plant osmotic status may regulate root hydraulic response to drought in rice.
INTRODUCTION
Root hydraulic properties that affect plant water uptake under drought may be a key determinant of crop performance, and a range of traits probably contribute to the root hydraulic properties of a given variety (Vadez, 2014). In rice (Oryza sativa), hydraulic limitations have been characterized even under well-watered conditions (Hirasawa et al., 1992), and these may have implications for drought response. Specifically, hydraulic properties that improve the ability of rice to transport water within the plant or to regulate water use may contribute to improved performance under drought. Rice typically shows lower water uptake ability under drought compared with other crops (Kondo et al., 2000; Gowda et al., 2012); therefore, increasing the water uptake ability of rice through root hydraulic properties may improve its performance under drought. Furthermore, more effective use of water to support transpiration may improve yield under drought (Blum, 2009), and this could be conferred through hydraulic properties that regulate the use of water.
Interestingly, contrasting trends in rice root hydraulic measurements including bleeding rate and root hydraulic conductivity (Lpr) between drought-tolerant and drought-susceptible varieties have been observed (Henry et al., 2012): bleeding rates of drought-tolerant varieties were consistently lower than those of drought-susceptible varieties under both drought stress and well-watered conditions, and the drought-tolerant variety Dular showed greater diurnal variation in Lpr than the drought-susceptible variety IR64 under drought stress. Such diurnal fluctuation may indicate more effective use of water in that higher Lpr would coincide with the times of day when transpiration is highest. These observations indicate a need for continued research on the components behind root hydraulic measurements that could lead to a better understanding of drought response and water uptake in rice.
Bleeding rate, or the amount of xylem sap exuded from an intact root system through a cut stem, has historically been characterized in studies to understand plant hydraulics, although mostly under well-watered conditions. Skoog et al. (1938) reported diurnal fluctuations in the bleeding rates of sunflower and pea, and Morita and Toyota (2000), in studies on pepper and melon, concluded that diurnal effects on bleeding rate are species specific and related to mineral concentrations in the sap. Van Overbeek (1942) hypothesized that bleeding rates cannot be due only to osmotic effects, since a large difference between the pressure of exudates and the pressure required by excised roots to take up water was observed in tomato. In rice, bleeding rates have been correlated with growth stage (Kusutani et al., 2000), time of day (Morita and Abe, 2002) and sink size (Ansari et al., 2004), as well as with xylem vessel diameter (Grondin et al., 2016) under well-watered (flooded) conditions. These results collectively suggest that root hydraulic properties are sensitive to time-dependent factors such as time of day and plant growth stage.
Although it might be expected that greater water uptake would lead to better productivity under drought, restrictions in hydraulics and regulation of water uptake may be a more strategic way for a plant to manage limited availability of water (Vadez, 2014). Limiting transpiration at times of high vapour pressure deficit (VPD; typically at mid-day), thereby saving available soil water for the critical time of the reproductive stage, has been linked to productivity under drought in dryland crops including chickpea (Zaman-Allah et al., 2011), cowpea (Belko et al., 2013) and pearl millet (Kholova et al., 2010), and may be related to a range of traits regulating hydraulic properties. Compared with dryland crops, the drought response of lowland rice may be particularly dependent on root hydraulic properties since the drought stress typically develops through gradual soil drying of an initially flooded field and since rice plants typically show poor ability to extract the remaining water in the soil. Therefore, a better understanding of rice root hydraulics may help elucidate these responses regulating water uptake under drought, as well as some of the genetic differences observed previously.
The aim of this study was to examine environmental and physiological effects on rice root hydraulics under drought, in order to better understand why drought-tolerant and drought-susceptible rice varieties showed distinct trends in hydraulic measurements such as xylem sap bleeding rate and root hydraulic conductivity. We hypothesized that environmental conditions (VPD and irradiance levels) and plant traits that are probably most responsive to those conditions (stomatal conductance and leaf osmotic potential) would also differ between drought-tolerant and drought-susceptible varieties and would correlate with root hydraulic properties.
MATERIALS AND METHODS
Field experiments
Seven field studies were conducted at the International Rice Research Institute (IRRI), Los Baños, Laguna, Philippines (14°10′11.81″N, 121°15′39.22″E) over four dry seasons (DS) and three wet seasons (WS) from 2011 to 2015 (Table 1). The soil in the experimental field was classified as an Isohyperthermic Typic Hapludalf (Soil Survey Staff, 1999), with a bulk density of 1·14 at the depth of 25–30 cm.
Summary of field experiments [dry seasons (DS) and wet seasons (WS)] and the number of dates on which each measurement was conducted per season
| Season | Seasonal bleeding rate | Diurnal bleeding rate | Single-tiller bleeding rate | Diurnal stomatal conductance | Diurnal leaf osmotic potential | Root length density |
|---|---|---|---|---|---|---|
| 2011WS | 7 | 4 | 0 | 0 | 0 | 0 |
| 2012DS | 6 | 4 | 1 | 4 | 0 | 0 |
| 2012WS | 6 | 1 | 0 | 1 | 0 | 0 |
| 2013DS | 0 | 2 | 0 | 1 | 0 | 1 |
| 2013WS | 0 | 1 | 0 | 0 | 1 | 0 |
| 2014DS | 0 | 2 | 0 | 1 | 2 | 0 |
| 2015DS | 2 | 1 | 1 | 1 | 3 | 0 |
In order to study genetic variation in response to environmental conditions, eight rice varieties were chosen for the field studies that previously showed different performance in terms of grain yield across cultivation locations: (1) Dular is a traditional variety that has been reported to have a high drought response index (DRI; the relative yield under drought in relation to the yield under well-watered conditions and time to flowering) (Henry et al., 2011) and to be more responsive to the time of day in adjusting its root hydraulic conductance (Henry et al., 2012; Grondin et al., 2016); (2) Sahbhagi dhan is an improved drought-tolerant variety that generally performs well in a range of environments (Anantha et al., 2016); (3) N22 is a traditional variety that is well characterized for its heat tolerance and is moderately drought tolerant; (4) Vandana is an improved drought-tolerant, upland-adapted variety; (5) IR64 is an improved variety that shows good performance in a range of irrigated environments but is drought susceptible; (6) MTU1010 is an improved variety that performs well in India, but not so well in the Philippines; (7) PSBRc82 is an improved variety that performs well in a range of environments but is drought susceptible; and (8) Swarna is an improved variety that performs well in India, but not in the Philippines, and is drought susceptible. The drought-tolerant group of varieties was therefore considered to be Dular, Sahbhagi dhan, N22 and Vandana, and the drought-susceptible group of varieties was considered to be IR64, MTU1010, PSBRc82 and Swarna.
Seeds of each variety were sown in a seed bed, then pulled and transplanted into the main experimental field at about 17 days after sowing (DAS) in each experiment. Two experimental fields were planted per season: one that was given a drought stress treatment and one that was maintained flooded as the well-watered treatment. In each treatment, 3–4 plants per hill were transplanted into plots of six 3 m rows, with 0·25 m between rows in a randomized complete block design with four replicates per variety. The drought stress treatment was maintained flooded until 36–45 DAS, at which time the experimental field was drained and irrigation was stopped. The drought stress was typically interrupted by rainfall – especially during the wet season experiments – but the drought stress became severe enough that re-watering was necessary in most experiments.
The severity and timing of the drought stress treatments were monitored in each season by tensiometers installed at a depth of 30 cm (1–3 per experiment; Soilmoisture Equipment Corp., Goleta, CA, USA), and volumetric soil moisture was monitored by frequency domain reflectometry through PVC tubes (1–5 per experiment; Diviner 2000, Sentek Sensor Technologies, Stepney SA, Australia). Daily rainfall, hourly irradiance, temperature and relative humidity (RH; used to calculate hourly VPD) were monitored by the IRRI Climate Unit at a weather station located within 50 m of the experimental field.
A series of physiological measurements was conducted during each experiment to investigate which parameters were most correlated with bleeding rate (Table 1). The bleeding rate (upward movement of sap from the root zone) was measured according to Morita and Abe (2002) and Henry et al. (2012), in which the stems of entire hills were cut about 15 cm from the soil surface and a pre-weighed cotton towel was wrapped around the cut stems. The towel was covered with a plastic bag and secured with a rubber band. Initiation of sap collection from all plots was completed within about 20 min per treatment. After 4 h, the towels and plastic bags were collected and re-weighed to determine the amount of sap collected. Measurements were conducted over two time frames: seasonal, collected on a range of dates in the morning (0700 to 1100 h) to compare different varieties, growth stages and responses to progressive drought stress; and diurnally (0700 to 1100 h, 1100 to 1500 h and 1500 to 1900 h), to compare different times of day, irradiance levels and VPD levels. Three sub-replicates per plot were used for seasonal bleeding rate measurements, and 1–3 sub-replicates per plot were used for diurnal bleeding rate measurements. In 2012DS, three sub-replicates were measured with one replicate (i.e. one plot per variety) per day for the diurnal bleeding rate measurements.
Bleeding rates of whole plants and single tillers were compared in order to better understand the driving forces behind bleeding rate as a root hydraulic parameter. For single-tiller measurements, sap from one tiller per plant was collected using pre-weighed cotton-filled 2 mL centrifuge tubes that were placed over the cut stem for 4 h. All other remaining tillers were left intact during the single-tiller measurements. Three sub-replicate tillers per plot (all on the same plant) were measured in 2012DS and one tiller per plot was measured in 2015DS.
Additional physiological measurements were conducted at the time of bleeding rate measurements on selected dates, in order to determine which traits were most related to bleeding rate. These measurements were conducted under a range of environmental conditions (i.e. sunny or cloudy, and at different levels of drought severity). Stomatal conductance measurements were conducted on one to two leaves per plot using a porometer (AP4, Delta-T Devices, Cambridge, UK). In 2013WS, 2014DS and 2015DS, one leaf per plot was collected and stored at −15 °C, then thawed and pressed with a syringe to measure leaf osmotic potential using a vapour pressure osmometer (Vapro model 5520, Wescor, Logan, UT, USA). To measure the ion concentration in the sap exuded from cut stems, sap was collected in the well-watered treatments (in 2014DS on the day after measuring the bleeding rate from the same plants, and in 2015DS at the same time as the bleeding rate measurement from separate plants) by pipetting the exuded droplets of sap directly from the cut stems into a 2 mL centrifuge tube. Since the osmotic potentials of diluted sap samples were below the detection level of the osmometer used, sap samples exuded from cut stems were submitted for ion concentration analysis by inductively coupled plasma optical emission spectrometry at the IRRI Analytical Service Laboratory after diluting about 100-fold to obtain a volume of 10 mL.
Root samples were acquired in 2013DS at 95 DAS (drought stress treatment) and 102 DAS (well-watered treatment) by soil coring with a 4 cm diameter steel tube to a depth of 60 cm in the drought stress treatment and 45 cm in the well-watered treatment. Roots were carefully separated from the soil by repeatedly mixing with water and pouring the floating material over a fine sieve, then scanned (Epson V700, California, USA) and analysed for root length using WinRhizo (Régent Instruments, Québec, Canada). Roots sampled from a depth of 0–15 cm were used for suberin analysis according to Franke et al. (2005). Cell walls were digested using polysaccharide hydrolases. The remaining cell wall fractions were solvent extracted to remove unbound lipids. The suberin polyester was reduced to monomers via transesterification with boron trifluoride (BF3). Monomers were identified by gas chromatography–mass spectrometry (GC-MS) and quantified by GC-FID (flame ionization detection). Total suberin amounts were calculated in μgsuberin mg–1root dry weight.
Growth chamber experiments
Root hydraulic conductivity at four VPD levels.
To evaluate the effects of VPD at a range of temperatures and RH levels on rice root hydraulics, a growth chamber root hydraulic conductivity experiment was conducted using four of the varieties from the field studies: IR64, Dular, MTU1010 and N22. Four-day-old seedlings that were germinated in Petri dishes were planted on the soil surface into 5 cm diameter, 40 cm tall tubes filled with 865 g of sieved upland soil. The soil was filled into a tube of mylar plastic that was closed at the bottom with permeable fabric, and each mylar tube was inserted into a PVC tube that was painted white and sealed at the bottom. Two treatments were imposed: well-watered (WW) in which the plants were maintained saturated (120 % of field capacity) and dry-down (DD) in which soil was initially at 75 % of field capacity, then allowed to dry continuously over the course of the experiment without any further addition of water. The tubes were arranged in a randomized complete block design and supported by a wire grid within open-topped plastic boxes, with four replicates per variety in each water and VPD treatment. Each VPD treatment was imposed in one of four separate growth chambers, which were programmed with a 12 h photoperiod starting each day with stepwise increases in the number of lights illuminated and the temperature to reach the target maximum temperature after 1 h and the target maximum number of lights after 2·5 h. The VPD treatments were: VPD 0·85 (30 °C, 80 % RH), VPD 1·32 (38 °C, 80 % RH), VPD 2·55 (30 °C, 40 % RH) and VPD 3·97 (38 °C, 40 % RH). The target RH was set to start at the time the first lights were illuminated each day, and all chambers were set at 24 °C and an RH of 80 % (VPD = 0·59 kPa) at night-time. In order to conduct the root hydraulic conductivity (Lpr) measurements throughout the workday while minimizing the time of day effect that the plants were experiencing in the growth chambers, the actual times at which the lights were illuminated in each of the four chambers was staggered. The staggered onset of illumination of growth chambers resulted in all measurements being conducted from 0·5 to 7 h after illumination of the lights (equivalent to 0700–1300 h), and the time of measurement was recorded as ‘early’ (0700–1000 h) and ‘mid’ (1000–1300 h). Planting was staggered so that each plant had grown for 25 d at the time of root hydraulic conductivity measurement, which could only be conducted on seven plants per day due to the availability of a single pressure chamber and the time required for the measurement. Plants in the VPD 3·97 treatment were grown in a greenhouse for 3 d in order to allow better plant establishment before they were transferred to the growth chamber.
The Lpr was measured using a pressure chamber as described by Henry et al. (2012). Plants were removed from the growth chamber and quickly transferred to an adjacent laboratory for measurement. All tillers were cut at the base of the plant, except for the main tiller which was cut at approx. 5 cm above the soil surface to be inserted through the lid of the pressure chamber. Plants in the DD treatment were not re-watered before the Lpr measurement. Each tube was placed inside a pressure chamber (3000HGBL Plant Water Status Console, Soilmoisture Equipment Corp., Goleta, CA, USA) and pressurized at 0·2 MPa for 10 min to equilibrate, then the sap exuded from the root zone through the cut end of the main tiller was collected for 10 min each at pressures of 0·2, 0·35 and 0·5 kPa with a pre-weighed 2 mL centrifuge tube filled with cotton. Leaf water potential (LWP) was measured at the same time as Lpr on one leaf per plant using a separate pressure chamber. After sap collection for the Lpr measurement, the mylar tubes were opened length-wise and the maximum root depth was recorded. The roots from each plant were then carefully washed and scanned, and total root length and root surface area were determined with WinRhizo. Root hydraulic conductivity was calculated as the slope of the amount of sap exuded over the three pressure settings, normalized by the root surface area and the collection time. Plants from which the exuded sap amounts did not show a linear increase with increasing pressure were excluded from the analysis. Root and shoot dry weights were determined after drying the plant tissues at 65 °C.
Transpiration of de-rooted tillers.
Plants used for transpiration rate measurements were grown in 1·5 L pots filled with 1 kg of soil from the IRRI upland farm. The well-watered treatment consisted of keeping the soil saturated with water, while the drought stress treatment was applied 7 d after sowing through gradual dry-down by withholding water. Drought-stressed pots were weighed three times per week to monitor the dry-down rate, and, if needed, water was added to maintain the soil at 30 % of field capacity. At 28 DAS, the transpiration rates of whole plants and de-rooted tillers were measured in a growth chamber according to the protocol of Kholová et al. (2010). At 12 h before the measurement, intact plants were transferred from the greenhouse to the growth chamber for night-time acclimation (23 °C and 80 % RH). On the day of measurement, the soil surface of pots used for whole-plant transpiration measurements was covered with a plastic bag to reduce water evaporation from the soil, while tillers from plants used for de-rooted tiller transpiration measurements were cut at around 1 cm from the soil surface and placed into 50 mL tubes containing water and sealed at the top with parafilm M (Bemis Company Inc., USA). All pots/tubes were weighed hourly from 0800 to 1100 h, while the VPD in the growth chamber was increased by about 0·4 kPa every hour (starting from 0·6 kPa at 0800 h and increasing to 2·0 kPa at 1100 h). Shoots from whole plants and de-rooted tillers were further collected and stored at 4 °C for leaf area measurements using a roller-belt-type leaf area meter (LI-3100C, Li-Cor, Lincoln, NE, USA). Plant transpiration rate was calculated as the grams of water loss per hour and normalized by the leaf area.
Statistical analysis
Data from all field seasons were compiled in order to compare bleeding rates (gsap g–1shoot) among varieties in relation to the environmental and physiological parameters measured among varieties, with a total of 1344 seasonal bleeding rate measurements (8 varieties × 4 replicates × 2 treatments × 21 dates) and 1728 diurnal bleeding rate measurements (8 varieties × 4 replicates × 2 treatments × 3 times of day × 9 dates). Pearson’s product–moment correlation in Statistical Tool for Agricultural Research (STAR ver. 2.0.1, IRRI) was used to calculate the correlation coefficient of each parameter with bleeding rate, including days after sowing, shoot dry weight, soil water potential, volumetric soil moisture (10–70 cm depth), days after flowering, average VPD during the first hour and 4 h of bleeding rate measurement, and average irradiance levels during the first hour and 4 h of bleeding rate measurement, with the drought stress and well-watered treatments analysed separately.
Mean values of seasonal and diurnal parameters, as well as those from the field physiology, growth chamber Lpr and de-rooted transpiration studies, were analysed per experiment by randomized complete block analysis of variance (ANOVA) in STAR or R v. 3.2.2 (R Development Core Team, 2015) and Tukey’s honest significant difference pairwise mean comparison as the post-hoc test to identify significant differences among varieties.
Randomized complete block analysis of covariance (ANCOVA) was performed using R to determine the effect of DAS on bleeding rates among varieties in each experiment, in which DAS was treated as the covariate. The ANCOVA test was also used to examine the effect of days after flowering (DAF) on bleeding rate. A linear relationship between the response variables and the covariate was tested before performing ANCOVA. Tukey’s multiple comparison procedure (MCP) was used as the post-hoc test using the adjusted means to determine significant differences among varieties.
RESULTS
Environmental effects on rice root hydraulics under drought
Soil moisture and irradiance levels were correlated with bleeding rates.
A range of environmental conditions were observed across the field experiments in terms of seasonal rainfall and soil water potentials, with 2015DS as the most severely stressed experiment (Fig. 1A, B). The RH levels were generally high (Supplementary Data Fig. S1), and VPD levels in the field were generally low (<1 kPa) and showed little variation. Irradiance levels showed greater variation among times of day when the diurnal bleeding rate measurements were conducted (Fig. 1C, D).
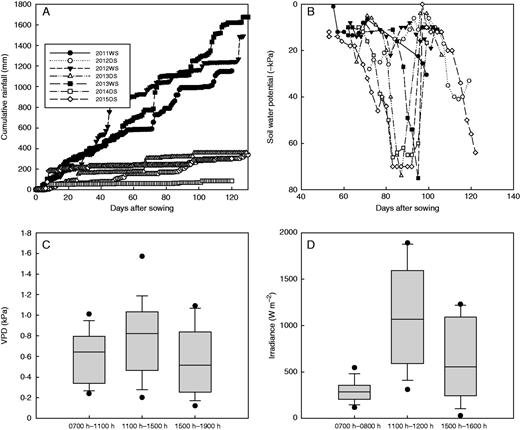
Environmental conditions across field experiments. (A) Cumulative rainfall and (B) Soil water potential in the drought stress treatments (30 cm depth), measured seasonally; and (C) vapour pressure deficit (VPD) levels (4 h average) and (D) irradiance levels (1 h average) measured diurnally during each bleeding rate measurement.
In the seasonal measurements, bleeding rates (normalized by shoot mass) were significantly affected by date in that lower bleeding rates were observed with increasing DAS (Table 2). Decreasing volumetric soil moisture and increasingly negative soil water potential were related to lower bleeding rates in the drought stress treatments (Table 2). Seasonal bleeding rate measurements under drought were negatively correlated with the 4 h VPD average as well as 1 h and 4 h irradiance levels at the time of the bleeding rate measurements, but these relationships were not significant under well-watered conditions. In the diurnal measurements, bleeding rates were significantly related to time of day in the well-watered treatment only, and were not correlated with VPD measurements in either treatment. The diurnal bleeding rate measurements were negatively correlated with irradiance levels in both treatments.
Correlations between various environmental and physiological parameters and bleeding rate (gsap g–1shoot), measured on seasonal and diurnal time frames across field experiments from 2011 to 2015
| Correlations with bleeding rate | Drought stress | Well-watered |
|---|---|---|
| Seasonal measurements | ||
| DAS | –0·641* | –0·6487* |
| Shoot dry weight | –0·6286* | –0·6721* |
| DAF | –0·5638* | –0·7372* |
| VPD first hour | –0·0342 | 0·0378 |
| VPD 4 h | –0·1745* | 0·0795 |
| Irradiance first hour | –0·3287* | 0·0584 |
| Irradiance 4 h | –0·3072* | 0·0287 |
| Soil water potential | 0·2582* | |
| θv 10 cm | 0·6441* | |
| θv 20 cm | 0·6306* | |
| θv 30 cm | 0·3879* | |
| θv 40 cm | 0·4808* | |
| θv 50 cm | 0·4636* | |
| θv 60 cm | 0·5056* | |
| Diurnal measurements | ||
| DAS | –0·3071 | −0·4715* |
| Time of day | 0·1597 | 0·1898* |
| Shoot dry weight | –0·2411* | –0·2012* |
| Stomatal conductance | −0·1567* | 0·0307 |
| VPD first hour | −0·0251 | 0·0971 |
| VPD 4 h | 0·032 | 0·091 |
| Irradiance first hour | –0·14* | –0·1592* |
| Irradiance 4 h | 0·0016 | –0·0346 |
| Leaf osmotic potential | –0·556* | 0·001 |
Values shown are Pearson correlation coefficients, and significant correlations are indicated by * (P < 0·05).
DAS, days after sowing; DAF, days after flowering, VPD, vapour pressure deficit, θv: volumetric soil moisture.
Long-term differences in VPD affected root hydraulic conductivity under well-watered conditions.
To investigate further the relationship between VPD and root hydraulics at a greater range of VPD levels, we conducted a seedling-stage study on Lpr using growth chambers set at maximum VPD levels ranging from 0·85 to 3·97 kPa. This relatively long-term exposure to different VPD treatments (25 d) resulted in significant effects on seedling growth in terms of root surface area, maximum root depth and root:shoot ratio (Supplementary Data Fig. S2). Although these VPD effects were more strongly related to temperature, the RH also had an effect on seedling growth and Lpr (Supplementary Data Table S1). Drought-tolerant varieties Dular and N22 generally showed greater values for root growth in terms of surface area and maximum root depth in both water treatments, and for root:shoot ratio in the DD treatment. The VPD treatments at high temperature (38 °C) showed more restricted growth than those at the lower temperature (30 °C) (Fig. S2). These VPD effects on growth appeared to cause effects on plant hydraulics in terms of Lpr and LWP in the WW treatment, but not in the DD treatment where VPD did not significantly affect Lpr or LWP (Fig. 2). Although variety had a significant effect on Lpr and LWP in the DD treatment, these two parameters were not correlated, i.e. plants with higher Lpr did not consistently show less negative LWP values. In this experiment, all Lpr and LWP measurements were conducted during the first 6 h of the day, and therefore no significant effect of time of day was detected.
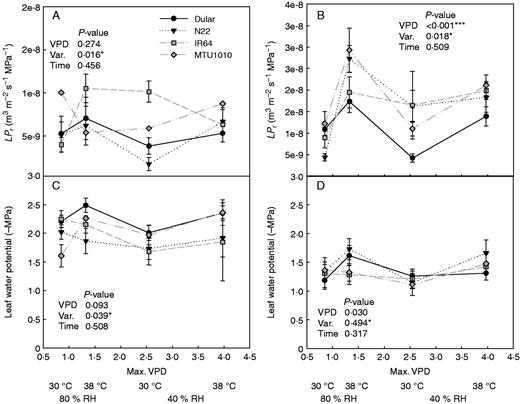
Effects of vapour pressure deficit (VPD) treatments on plant hydraulics in a growth chamber experiment of four rice varieties (Var.). Root hydraulic conductivity (Lpr; A and B) and leaf water potential (LWP; C and D) were measured in the drought stress (DD) and well-watered (WW) treatments. Results of the ANOVA are shown for each individual water treatment.
Time of day affected single-tiller bleeding rate differently from whole-plant bleeding rate.
We observed that manipulating the shoot sampling procedure affected the amount of xylem sap exuded. The bleeding rate from single tillers (gsap g–1tiller) showed trends distinct from bleeding rates measured when all tillers were cut (whole-plant; gsap g–1shoot) under both the drought stress (Fig. 3) and well-watered conditions (Supplementary Data Fig. S3). Whereas no time of day effect was seen on the whole-plant bleeding rate measurements in this study, simultaneously measured bleeding rates from single tillers showed significant increases with time of day – particularly in response to irradiance levels, with drought-susceptible varieties IR64 and Swarna showing the highest average single-tiller bleeding rates at the late-day measurement time.
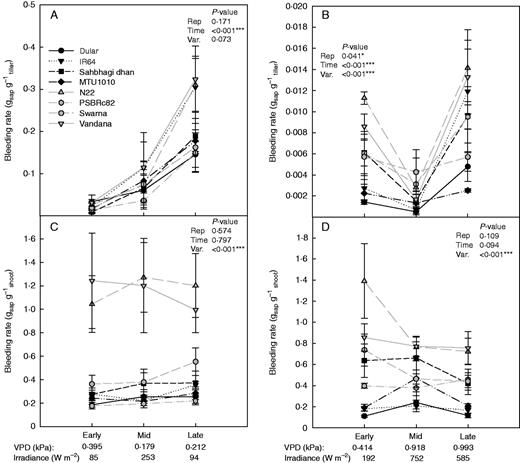
Single-tiller (A and B) and whole-plant (C and D) bleeding rate measurements (2012DS–2015DS) in the field studies in 2012DS (A and C) and 2015DS (B and D) under drought stress. Drought-susceptible varieties are shown in grey, and drought-tolerant varieties are shown in black. Vapour pressure deficit (VPD) values during the 4 h of bleeding rate measurement and irradiance levels during the first hour of bleeding rate measurement are shown below the time of day.
Physiological relationships with rice root hydraulics under drought
Drought-tolerant and drought-susceptible varieties showed different relationships between bleeding rate and leaf osmotic potential.
The effects of shoot parameters on bleeding rate were further investigated by measuring stomatal conductance and leaf osmotic potential in the field experiments. Although stomatal conductance showed significant differences among times of day, no distinct groupings between drought-tolerant and drought-susceptible varieties were observed, except in the most severe drought stress treatment in 2015DS (Supplementary Data Fig. S4). Leaf osmotic potential was significantly affected by variety and time of day (Supplementary Data Fig. S5), and more negative leaf osmotic potential values were correlated with higher bleeding rates under drought stress (Table 2). Furthermore, although the drought-tolerant and drought-susceptible varieties showed a similar range of leaf osmotic potentials across measurements, different relationships with bleeding rates were observed; whereas drought-susceptible varieties showed increasing bleeding rates as leaf osmotic potential became more negative, drought-tolerant varieties (except Sahbhagi dhan in 2015DS) maintained low bleeding rates (Fig. 4).

Bleeding rate as a function of leaf osmotic potential in the drought stress (A, B) and well-watered (C, D) treatments in which sap was collected at three times per day. (A) and (C) show the drought-tolerant varieties and (B) and (D) show the drought-susceptible varieties. Values shown are from 2013WS (82 DAS), 2014DS (78 and 92 DAS) and 2015DS (84 DAS).
Varietal rankings changed when plants were de-rooted.
To further dissect the individual roles of root and shoot effects on rice hydraulics under drought, transpiration rates were measured on both whole plants and de-rooted tillers that had been grown under drought stress or well-watered conditions. Transpiration rates of IR64 and Dular were similar in whole plants under either drought stress or well-watered conditions, and these whole-plant transpiration rates increased with increasing VPD (Fig. 5A). Although de-rooted tillers maintained a similar range of transpiration rates compared with whole plants (0·01–0·04 g h–1 cm–2leaf), the previously drought-stressed de-rooted tillers showed higher transpiration rates than drought-stressed whole plants (Fig. 5B). De-rooted Dular tillers showed significantly higher transpiration rates than IR64, and the effect of time of day/increasing VPD was not significant on de-rooted tillers.
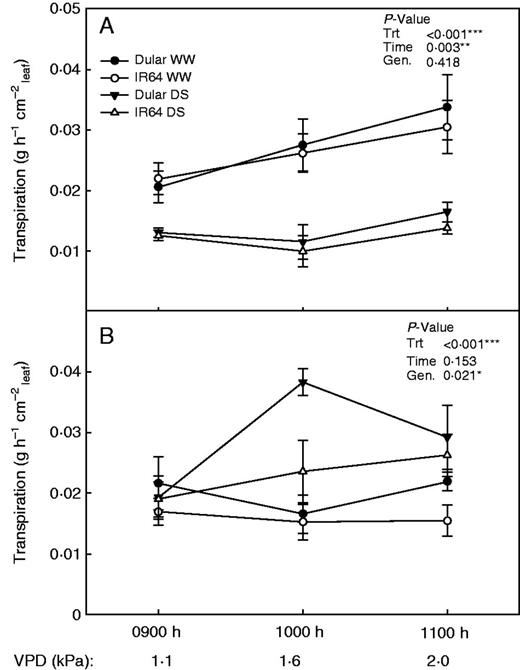
Transpiration rates of (A) whole plants and (B) de-rooted tillers after growth in well-watered or drought stress conditions. The vapour pressure deficit was increased in the growth chamber while transpiration was measured hourly.
Drought stress decreased total suberin amounts in roots.
Root length density at the depth of 0–15 cm in the 2013DS field study was reduced by drought stress, and was significantly lowest in N22 in both treatments (Supplementary Data Fig. S6). IR64 and Swarna showed the highest average root length densities at 0–15 cm. Since root suberin may affect hydraulic properties, total suberin was quantified to examine its potential relationships with drought tolerance groupings and bleeding rates. The total amount of suberin in root samples from the 0–15 cm depth averaged 11·4 μg mg–1root dry weight in the drought stress treatment, and 18·2 μg mg–1root dry weight in the well-watered treatment (Fig. 6). All substance classes were proportionally lower in roots under drought stress than in the well-watered treatment. Under well-watered conditions, the total suberin amount was highest in Dular at 23·2 ± 3·9 μg mg–1root dry weight and lowest in IR64 at 14·6 ± 0·3 μg mg–1root dry weight. Under drought stress, PSBRc82 showed the highest suberin amount with 18·2 ± 6·7 μg mg–1root dry weight and Swarna showed the lowest suberin amount at 6·8 ± 0·4 μg mg–1root dry weight. Grouping of drought-tolerant and drought-susceptible lines was not observed, nor were significant differences among varieties observed in either treatment.
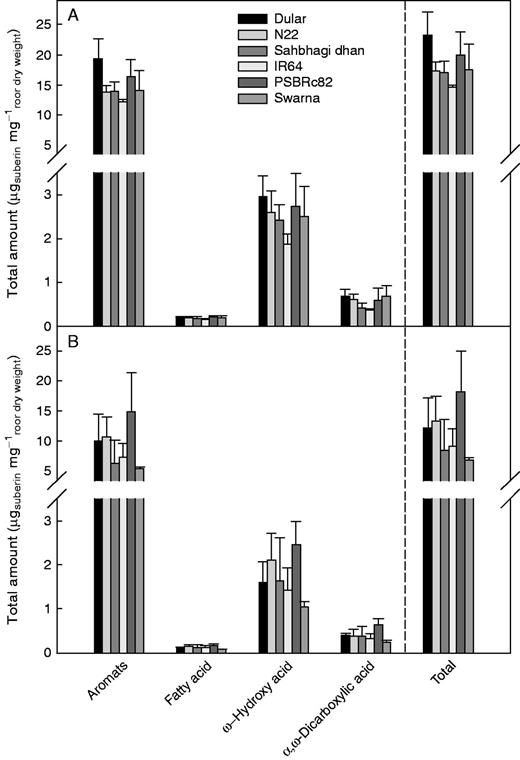
Distribution of suberin monomers by substance classes in roots from the 0–15 cm soil depth under (A) well-watered and (B) drought stress conditions. Suberin monomers were released by transesterification with BF3 using digested and MeOH/CHCl3-extracted root cell walls. Total amounts of monomers are shown as mean values of three replicates, and bars indicate the s.d.
Ion concentrations in sap did not correlate well with bleeding rates.
The concentrations of ions in sap collected at the time of bleeding rate measurements (but from separate plants) were measured from well-watered treatments in 2012DS and 2015DS to investigate any relationships with bleeding rate. The concentrations of ions (Ca2+, K+, Mg2+ and Na+) were generally higher in 2015DS than in 2012DS (Table 3). Swarna and IR64 showed the highest K+ concentrations in 2015DS, but no other significant differences among varieties were observed and ion concentrations did not correlate significantly with bleeding rate.
Concentration of cations in sap collected at 93 DAS in 2014DS and at 56 DAS in 2015DS in the well-watered treatments
| Exp | Variety | Ca+2 (mg L–1) | K+ (mg L–1) | Mg+2 (mg L–1) | Na+ (mg L–1) | Bleeding rate (gsap g–1shoot) |
|---|---|---|---|---|---|---|
| 2014DS | Dular | 39·7 | 50·3 | 11·9 | 100 | 0·21 |
| IR64 | 265 | 35·9 | 31·4 | 79·7 | 0·54 | |
| Sahbhagi dhan | 82·1 | 65·7 | 27·2 | 92·0 | 0·19 | |
| MTU1010 | 233 | 18·1 | 28·0 | 91·6 | 0·30 | |
| N22 | 235 | 20·1 | 32·9 | 133 | 0·19 | |
| Psbrc82 | 200 | 30·9 | 27·1 | 93·8 | 0·18 | |
| Swarna | 246 | 49·8 | 35·4 | 93·1 | 0·42 | |
| Vandana | 445 | 47·2 | 22·8 | 145 | 0·28 | |
| 2015DS | Dular | 208 | 410cd | 27·6 | 217 | 0·79 |
| IR64 | 256 | 591ab | 40·1 | 168 | 0·87 | |
| Sahbhagi dhan | 148 | 486abc | 29·3 | 199 | 0·97 | |
| MTU1010 | 121 | 486bcd | 36·5 | 148 | 0·79 | |
| N22 | 192 | 323d | 24·2 | 186 | 0·88 | |
| Psbrc82 | 169 | 356d | 27·9 | 223 | 0·98 | |
| Swarna | 114 | 587a | 21·1 | 118 | 1·69 | |
| Vandana | 171 | 461bcd | 26·5 | 162 | 1·43 |
Ion concentrations did not show significant correlations with bleeding rates measured on the previous day in 2014DS or on the same day as sap collection for ion analysis in 2015DS.
Significant differences among varieties were only observed for K+ in 2015DS.
Letters indicate varietal significance groups.
Bleeding rate groupings of drought-tolerant and susceptible varieties were observed even after correction for phenology differences.
Since the drought-tolerant varieties in this study typically flowered earlier than the drought-susceptible varieties (Supplementary Data Table S2), it was possible that the general trend of lower bleeding rate may have been due to measurement at later growth stages than the drought-susceptible varieties. To assess these potential phenology effects, bleeding rates expressed in terms ‘days after sowing’ were compared with those expressed in terms of ‘days after flowering’ (calculated per plot, since DTF among plots of the same variety varied slightly). When expressed in terms of DAF, the drought-tolerant varieties tended to show greater bleeding rates than drought-susceptible varieties under both drought stress and well-watered conditions in the three field experiments in which seasonal bleeding rates were measured (Fig. 7; Supplementary Data Fig. S7 and S8).
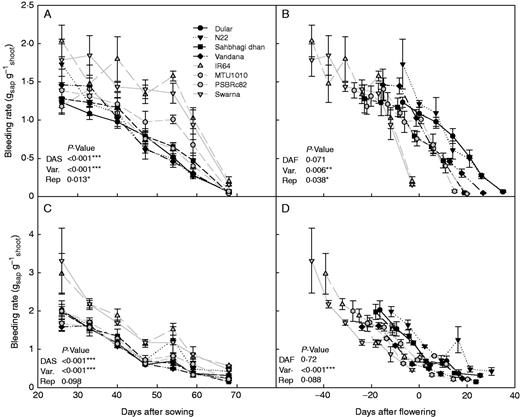
Effect of phenology on relative varietal effects on bleeding rate in 2011WS. Bleeding rates in the drought stress (A, B) and well-watered (C, D) treatments expressed in terms of days after sowing (DAS; left) or days after flowering (DAF; right), which was calculated per plot. Drought-tolerant varieties are shown in black and drought-susceptible (but high yielding under irrigated conditions) varieties are shown in grey.
The potential phenology effects on bleeding rate groupings of drought-tolerant and drought-susceptible varieties were further assessed by comparing mean seasonal bleeding rates with the DRI, which is a yield-under-drought calculation that takes phenology and yield potential into account. The mean seasonal bleeding rate in the drought stress treatments showed a negative relationship with DRI in the dry seasons that was significant in 2014DS (Fig. 8), but not in wet seasons (Supplementary Data Fig. S8A). However, the trends observed between DRI and mean seasonal bleeding rates in the dry-season well-watered treatments were similar to those observed under drought stress (Supplementary Data Fig. S8B).
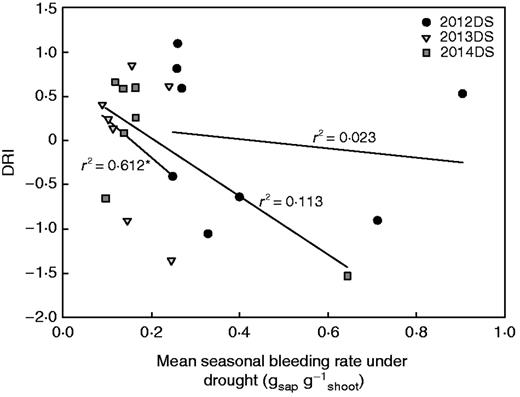
The relationship between mean seasonal bleeding rates in the drought stress treatments with the drought response index (DRI) for each dry season. Each point represents the seasonal means for one variety. Values are not shown for 2015DS due to severe stress that inhibited grain development.
DISCUSSION
In this study, drought-tolerant and drought-susceptible varieties showed distinct root hydraulic patterns and correlations with shoot-related drought responses, as observed through bleeding rate and root hydraulic conductivity measurements. The results of these experiments provide evidence of the environmental effects on shoots that can influence root hydraulics, and the different responses of whole plants, single tillers and de-rooted tillers point to varietal differences in the contribution of roots and shoots to hydraulic regulation under drought.
Given the importance of ambient conditions on shoot traits that subsequently affect drought response, as well as the implication in the literature that root hydraulics may be related to transpiration responses to VPD (Vadez, 2014), we hypothesized that VPD and irradiance would be correlated with varietal differences in bleeding rates. Whereas irradiance levels taken during the first hour of measurement were well correlated (negatively) with diurnal bleeding rates (Table 2), VPD levels were not. This is probably due to the high humidity levels in all experiments that resulted in low levels and little diurnal variation in VPD. The decrease in bleeding rate that reportedly occurs immediately from the time the shoot is excised (Morita and Abe, 2002) probably explains the better correlation between diurnal bleeding rates and irradiance during the first hour of measurement compared with the correlation with average irradiance over the 4 h of measurement.
Although the root hydraulic measurements in this study (bleeding rates and Lpr) were all conducted after excising the shoot, the shoot characteristics did appear to be related to these root hydraulic measurements. In the case of bleeding rate, these relationships generally indicated that evapo-transpirational demand and the severity of drought stress affected the flow of sap. When all of the tillers were left intact except for one in order to measure single-tiller bleeding rates, the bleeding rates were lowest at times of the day with highest evapo-transpirational demand (i.e. when irradiance levels were highest). This trend indicates that the sap was diverted from the cut tiller into the actively transpiring intact tillers, which is possible due to the peripheral vascular connections among tillers (Inosaka, 1962; Hanada, 1993). The single-tiller bleeding rate is thus less likely to be representative of rice root hydraulic function than of whole-plant bleeding rate. The link between shoot attributes and bleeding rate from the root system observed when the shoot was excised may reflect entrainment of plant hydraulics (root and shoot) in response to previous diurnal fluctuations in environmental conditions, as described by Caldeira et al. (2014). This diurnal pattern may be especially relevant to tropical conditions which show general trends of high mid-day VPD and irradiance but are highly prone to day-to-day variability (i.e. the exact conditions at the time of bleeding rate measurements).
Whereas VPD had no effect in the field on bleeding rate because of the low VPD range, it had an effect on Lpr in the well-watered treatment of the growth chamber study when a larger range of VPD was explored. Long-term differences in environmental conditions can affect plant growth attributes that subsequently affect hydraulics, as reported previously in rice where differences in root growth explained genetic differences in root hydraulic conductivity (Adachi et al., 2010). In the current study, the lack of VPD effect on Lpr in the drought stress treatment was probably due to the severity of the drought stress masking any VPD effects. Similarly, the lack of difference in LWP between drought-tolerant and susceptible varieties (Fig. 2) was probably due to application of stress at the seedling stage, which typically results in reduction of shoot growth in rice, rather than reduction of leaf water status. Although the effect of RH level was significant in the well-watered treatment, the reduction of plant growth caused by the temperature component of the growth chamber VPD treatments indicates that the plants grown at a maximum temperature of 38 °C (VPD 1·32 and VPD 3·97) were more stressed at both humidity levels compared with the plants grown at a maximum of 30 °C. The high temperature setting of 38 °C is above the threshold of 35 °C for reasonably good seedling growth but still well below the critical high temperature for leaf elongation of 45 °C (Yoshida, 1981; Krishnan et al., 2011). Drought-tolerant varieties Dular and N22 maintained better root growth under drought across VPD levels, resulting in lower Lpr as the calculation of Lpr involves normalizing for root surface area.
The grouping of drought-tolerant and susceptible varieties was observed in both the bleeding rate and Lpr measurements, even though these measurements were conducted at different growth stages. Bleeding rates decreased with time and the drought-tolerant varieties were typically measured at later growth stages due to their earlier flowering time, but the bleeding rate groupings were observed even when phenology was taken into account by normalizing for growth stage (Fig. 7; Figs S7 and S8) as well as for yield potential and phenology with DRI (Fig. 8). A significantly negative relationship between yield under drought and bleeding rate was also observed by Dixit et al. (2015) in a population of 250 lines with Swarna as one of the parents.
Different roles of roots and shoots in the drought response of rice have been described previously by Parent et al. (2010), who concluded that rice leaf expansion response to water deficit is similar to that of other species whereas the response of rice roots is different. The less negative leaf osmotic potential of the drought-tolerant varieties in this study may be due to their ability to increase root growth at depth in response to stress (Henry et al., 2011) and therefore maintain better leaf water status. The relationship between bleeding rate and leaf osmotic potential may be due to the whole-plant osmotic status that would also have been reflected in the root osmotic potential (although not measured here), as implied by the genetic differences in sap K+ concentration in 2015DS. Root osmotic potentials may affect root pressure, which drives bleeding rate as well as guttation (Singh, 2014), and we have anecdotally observed that drought-susceptible varieties such as Swarna characteristically show high levels of guttation.
The different treatment and varietal effects on transpiration response to increasing VPD between whole plants and de-rooted tillers in this study suggest varietal differences in the relative contribution of roots and shoot to hydraulic regulation. Similarly, Schoppach et al. (2013) used de-rooting studies to conclude that root-level hydraulic restrictions were related to the performance of a drought-tolerant wheat variety.
In addition to differences in root growth, rice roots are characterized by having a suberized radial barrier to oxygen loss that may affect root hydraulics. The relatively lower total suberin amounts observed in the drought stress treatment may be due to increased aeration compared with the well-watered treatment. These trends are consistent with those reported by Kotula et al. (2009), who analysed suberization under aerated and deoxygenated conditions in rice and found that roots were much less suberized when grown in aerated solutions. However, based on histochemical staining, Henry et al. (2012) reported that whereas suberin in the outer part of rice roots decreased under drought, the endodermis appeared more suberized. These cell-specific differences would not have been reflected in the analysis of the total suberin amount. Interestingly, Ranathunge et al. (2011) concluded that suberin is more likely to affect ion uptake than water uptake. Therefore, the potential relationships between root suberin and hydraulics under drought may be due to effects on root osmotic potential rather than on water uptake.
In summary, drought-tolerant and drought-susceptible rice varieties showed distinct root hydraulic trends at multiple growth stages in terms of (a) bleeding rate, in which drought-tolerant varieties showed consistently lower bleeding rates per gram of shoot across seasons and treatments; and (b) root hydraulic conductivity (Lpr), in which drought-tolerant varieties showed lower Lpr under drought across different VPD levels. Our investigation of environmental and physiological drought response traits that could help explain these groupings suggests that the shoot water status can affect root hydraulic properties: relationships with environmental conditions that impose high transpirational demand (high irradiance levels) were associated with lower bleeding rates; the bleeding rate was higher under lower irradiance levels in late-day measurements when only a single tiller was cut, presumably due to less sap flow to the remaining tillers than at mid-day; and long-term VPD treatments influenced Lpr via effects on root growth. Results from this study also indicate that varietal differences in physiological traits can partly explain the varietal differences in root hydraulic properties – particularly in respect to plant osmotic status – as evidenced by the groupings of drought-tolerant and drought-susceptible varieties in their response to increasing leaf osmotic potential and circumstantially by the reduced amounts of suberin and higher sap K+ concentrations in some of the drought-susceptible varieties. Despite these correlations between root and shoot responses, the treatment and varietal differences between whole plants and de-rooted tillers indicated distinct effects of roots and shoots. Such varietal differences in root hydraulic properties may be important resources for further improving and understanding the drought response of rice.
ACKNOWLEDGEMENTS
We thank R. Torres, C. Cabral, L. Holongbayan, A. Los Añes, E. Mico, D. Morales, M. Natividad, A. Reyes, N. Sadiasa and L. Satioquia for technical support. VPD and irradiance data were kindly provided by E. Aquino. We thank A. Kumar for recommending the rice varieties to study, and K. Jagadish for advice on the growth chamber settings. This work was supported by the Global Rice Science Partnership (GRiSP).
LITERATURE CITED
