


Abstract
Thirty (30) personal noise-exposure samples were collected on 20 tire-changing and repair technicians in three tire-changing facilities to determine their personal noise exposures and to estimate the maximum number of tire changes that could be performed without exceeding occupational exposure limits. Of the 30 projected 8-h time-weighted average noise samples, none exceeded the Occupational Safety and Health Administration’s Permissible Exposure Limit, 1 (3%) exceeded the Occupational Safety and Health Administration’s Action Level, and 18 (60%) exceeded the American Conference for Governmental Industrial Hygienists Threshold limit Value of 85 dBA, indicating the need for a hearing loss prevention program. The average shift time for the technicians was 6 h and 42 min and the average number of tire changes was 18. Based on the projected 8-h noise exposure 95% upper confidence limits, the estimated maximum number of tires that could be changed without exceeding the Occupational Safety and Health Administration’s noise action level was 32 tires, the permissible exposure limit greater than 40 tires, and the American Conference of Industrial Hygienists’ Threshold Limit Value was less than 20 tires. In addition, area noise samples of tire-changing equipment were taken with a sound-level meter to identify the noise sources that contributed to the tire technicians’ exposures. The air ratchet, tire-changing machine, and tire-bead seater were measured at noise levels >85 dBA, increasing the risk of noise-induced hearing loss to the technicians.
Noise exposures among tire changing and repair workers indicate the need for these workers to participate in hearing conservation programs, so as to avoid noise-induced hearing lost. This study develops a novel ‘piece-rate’ assessment for noise exposure from tire-changing tasks, that allows noise exposure to be estimated from the number of tire changes in a work sift. This concept may be used in future studies to determine other piece-rate noise exposures, and support an administrative control for tire changers and repairers that limits the number of tire changes per shift.
Introduction
Exposure to hazardous noise is one of the most common hazards found in workplaces around the world. In the USA, 22 million workers reported exposure to excessive noise in occupational settings and 34% of those workers reported not wearing hearing protection devices (Tak et al., 2009; Kerns et al., 2018). Exposure to hazardous noise can lead to a number of negative outcomes including hearings loss (Alberti, 2006), increase in incidents (Picard et al., 2008), and hypertension (Chen et al., 2017). These negative outcomes, in addition to regulatory requirements from the Occupational Safety and Health Administration (OSHA, 2008), require industry representatives to understand noise exposure sources in their workplaces and to control them as necessary.
The tire repairers and changers sector in the USA consists primarily of small shops that are either corporately owned and franchised or privately owned and operated. The Bureau of Labor Statistics (BLS) has estimated that the sector employs approximately 114 690 people as of May 2017 (Bureau of Labor Statistics, 2017). Injury and illness data for this sector are included under the North American Industry Classification System code 44132, Tire Dealers, with an incidence rate of 3.9 (Bureau of Labor Statistics, 2019a) and approximately 7,100 recordable injuries in 2019 (Bureau of Labor Statistics, 2019b). A majority of these incidents occur due to over-exertions, contact with objects, and falls on the same level (Bureau of Labor Statistics, 2019c).
Research focused strictly on tire repairers and changers is lacking, but several studies were found that examined hazards for automobile mechanics. Mechanics are likely to have more variety in their daily tasks than tire repairers and changers, which may lead to more variability in their noise exposure. However, noise exposure to mechanics is somewhat analogous to tire repairers and changers as they perform similar duties on a day-to-day basis and use the same tools, although tire repairers and changers may use tire-changing tools and equipment more often during a shift as compared with mechanics.
Loupa (2013) measured area noise levels at a private automotive repair shop and estimated that the six employees were exposed to a full-shift noise level of 69.3 dBA and that the compressed air wrench emitted an average sound pressure level (SPL) of 83.1 dB, which is a tool also used in tire-changing facilities. Bejan et al. (2011) collected 17 full-shift personal noise samples on auto-body technicians and found that none of the employees’ exposures exceeded the OSHA Permissible Exposure Limit (PEL) [90 dBA, 8-h time-weighted average (TWA)], but four of the 17 subjects exceeded the American Conference of Industrial Hygienists (ACGIH, 2014) Threshold Limit Value (TLV) of 85 dBA, 8-h TWA. In addition, the authors found that less than 5% of the noise generated from the air gun, wrench, and cutoff wheels were below 90 dBA (Bejan et al., 2011). Jayjock and Levin (1984) performed a 10-day noise dosimetry study of a two-person run automotive shop and found noise doses up to 160% of the OSHA PEL. In addition, the authors found that the loudest tools were pneumatic with exposures up to 115 dBA. McCammon and Sorensen (1996) reported an average personal noise exposure of 94.4 dBA using OSHA criteria for an employee working in an autobody shop as part of a National Institute for Occupational Safety and Health (NIOSH) health hazard evaluation.
The researchers of the current study focused on noise exposure to workers in the tire repairers and changers sector, differentiating this study from the more commonly studied automobile mechanic shops. The primary aims of this research were to (i) determine if workers in the tire repairers and changers sector were at increased risk of noise-induced hearing loss (NIHL) due to hazardous noise exposure; and (ii) determine if there was a correlation between the number of tires each worker changed during a shift and their noise exposures.
Methods
Site selection
The researchers worked with the franchisee of three tire shops, all under the same parent company, in northern Colorado to perform this study. The three shops all used similar equipment, but the shops varied in size. Each of the shops had dedicated tire technicians as well as mechanics, and the total number of tire technicians ranged from two to seven during the sampling days. This study was approved by the researchers’ institutional review board.
Tire technician recruitment
On each sampling day, the researchers solicited participation of the subjects on-site before their shift started. Employees were required to be 18 years of age, worked as a tire technician, and were scheduled to work a shift of at least 4 h on the day of sampling. No incentives were offered for subject participation and mechanics were specifically excluded from this study if they were not scheduled to work at least 4 h as a tire technician on the sampling day.
Personal noise monitoring
Personal noise measurements were taken using the Larson Davis Spark® Models 706 and 703+ (Provo, UT) from November to August during nine sampling days. Each dosimeter was pre- and post-calibrated using a Larson Davis CAL 150 at 94 and 114 dB. The dosimeters were set to record three criteria for analysis, including the ACGIH TLV, the OSHA Action Level (AL), and the OSHA PEL (Table 1), with the sample interval set to 1 s.
Audio dosimeter measurement criteria.
| Criterion | ACGIH TLV | OSHA AL | OSHA PEL |
|---|---|---|---|
| Weighting | A | A | A |
| Response | Slow | Slow | Slow |
| Exchange rate | 3 | 5 | 5 |
| Threshold | 80 | 80 | 90 |
| Criterion level | 85 | 90 | 90 |
| Criterion | ACGIH TLV | OSHA AL | OSHA PEL |
|---|---|---|---|
| Weighting | A | A | A |
| Response | Slow | Slow | Slow |
| Exchange rate | 3 | 5 | 5 |
| Threshold | 80 | 80 | 90 |
| Criterion level | 85 | 90 | 90 |
During each sampling day, one to five tire technicians were monitored depending on the number of subjects available on the sampling day. A total of 20 subjects were monitored, 7 of which were monitored on more than 1 day, resulting in a total of 30 personal noise samples. Only those technicians scheduled to work at least a 4-h shift changing tires were selected for noise monitoring, and the average monitoring time was 6 h and 40 min. At the beginning of their shifts, each tire technician wore a Larson Davis Model 703+ dosimeter (Provo, UT) with the microphone clipped to the work uniform within the subject’s hearing zone on their dominant shoulder. Each group of technicians was instructed to continue their work as they would on any other day but not to interfere with the dosimeter microphone. At the beginning of their shift, each tire technician was provided a sheet of paper to record and tally every time they performed a tire change during the sampling period. A tire change was defined as each time a tire was removed from the hub and then reattached, regardless of any work that was to be performed on it. Consequently, rotating four tires was the equivalent of putting four new tires on a vehicle. The importance of this specificity was to identify how many times each employee used an air wrench to loosen/tighten lug nuts. The pneumatic impact wrench has been identified to be a substantial source of impact noise (Zhu and Kim, 2006).
The noise dosimeters were collected at the end of the technicians’ shifts and the noise dosimetry data were downloaded using the Larson Davis Blaze® software (Provo, UT).
Area noise sampling
Area noise samples were collected to identify those pieces of tire-changing/repair equipment that contributed to the tire technicians’ noise exposures. The noise samples were taken approximately 2 feet from the equipment while in use by the technician with a Larson Davis 831 (Provo, UT) handheld sound-level meter/octave band analyzer with recording durations from 5 to 20 s. Some of the samples that were collected included an air wrench under load (as used normally with a lug nut), air wrench not under load, a tire-changing machine, filling a tire with compressed air, and using the Cheetah Tire Bead Seater. The Cheetah is a compressed air tank that is rarely used, which releases almost all of its pressure in an instant to seat a stubborn tire onto a rim. Generally, a tire machine is used to accomplish this process, but the Cheetah is used when the tire machine cannot set the bead on a tire.
Statistical analysis
The 8-h predicted TWA noise summary data collected from the Larson Davis Blaze® software was analyzed in Microsoft Excel to provide descriptive statistics. The Excel spreadsheet was then loaded into the open source RStudio software (Boston, MA) for additional analysis, which was used to perform linear and polynomial regressions for each noise exposure category (AL, PEL, and TLV) against the number of tire changes to determine a line of best fit. A 95% confidence interval for the 8-h predicted TWA noise summary data was created using RStudio software to determine the average SPL for every tire change from 1 to 40 tires in a shift. Also, a 95% prediction interval was created using the same software to determine the range of noise exposure (dBA) values a single, random employee could encounter during his or her shift for each tire change, between 1 and 40 tires.
Results
Personal dosimetry
Thirty (30) personal noise dosimetry measurements were collected from 20 subjects on 9 sampling days at 3 tire-changing establishments. The average measurement time was 6 h and 42 min and the average number of tires changed was 18. The average predicted 8-h TWA noise exposures were 78, 74, and 86 dB based on the OSHA AL, OSHA PEL, and ACGIH TLV monitoring criteria, respectively. One personal noise sample (3%) was measured at the OSHA AL, no samples exceeded the OSHA PEL, and 18 (60%) samples exceeded the ACGIH TLV.
OSHA AL
Of the 30 measurements taken in this study, only one was at or above the OSHA AL of 85 dBA as a predicted 8-h TWA. This employee also changed the most tires of any employee at 37 changes in a shift. The distribution of measurements using OSHA AL criteria are summarized in Fig. 1. The dotted, vertical line represents the AL exposure limit of 85 dBA.
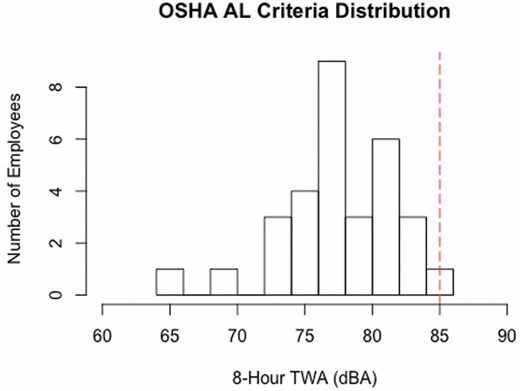
OSHA AL criteria distribution (n = 30).
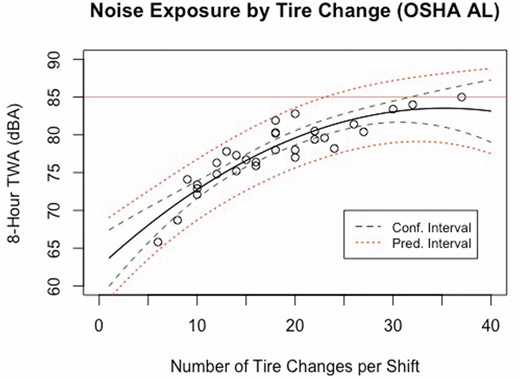
A polynomial regression (R2 = 0.81) was performed that compared the predicated AL 8-h TWA noise measurements to the number of tires changed during the shift, which is displayed in Fig. 2 and the regression results in Table 2. The 95% confidence interval for the average expected 8-h TWA noise level at each number of tire changes is represented by the green, narrower dashed line. The 95% 8-h TWA noise prediction interval that could be expected when randomly sampling one worker is represented by the orange, wider dotted line. The prediction interval is useful because it can aid in determining the maximum number of tire changes that can be performed by a single employee without exceeding the OSHA noise AL during an 8-h shift. For this data set, the upper limit of the prediction interval for 23 tire changes is 84.9 dBA, which is essentially at the AL. If one is interested in the average 8-h predicted TWA noise exposure for all employees based on the number of tires changes, the confidence interval (green line) can be used. As illustrated in Fig. 2, 31 tire changes have an estimated upper noise exposure limit of 84.7 dBA, which is just below the OSHA noise AL.
Summary of regression results—OSHA AL.
| Estimate | Standard error | t | P value | |
|---|---|---|---|---|
| Intercept | 62.504066 | 2.016441 | 30.997 | <2e−16 |
| X | 1.192810 | 0.212414 | 5.615 | 5.86e−6 |
| X 2 | −0.016917 | 0.005109 | −3.311 | 0.00265 |
| Residual standard error | 1.833 (27 DF) | |||
| Multiple R2 | 0.8257 | |||
| Adjusted R2 | 0.8128 | |||
| Equation | y = −0.016917x2 + 1.192810x + 62.504066 |
Noise exposure by tire change (OSHA AL criteria).
Contained in Table 3 are the number of tire changes and their corresponding upper and lower confidence and predicted 8-h TWA noise exposure limits. These data can be used to estimate the 8-h TWA noise exposures based the noise monitoring criteria and how many tires a technician changes during a shift. For example, in examining Table 3 for the OSHA AL noise exposures limits, one can predict with 95% confidence that a randomly chosen worker changing 25 tires could be exposed to noise ranging from 77.7 to 85.8 dBA. In comparison, the average 8-h TWA noise exposure for all of the employees sampled for 25 tire changes is between 80.7 and 82.8 dBA.
Eight-hour TWA confidence and prediction limits for the OSHA AL, PEL, and ACGIH TLV.
| Tire changes | OSHA AL confidence and prediction limits (8-h TWA, dBA) | OSHA PEL confidence and prediction limits (8-h TWA, dBA) | ACGIH confidence and prediction limits (8-h TWA, dBA) | ||||||||||||
|---|---|---|---|---|---|---|---|---|---|---|---|---|---|---|---|
| Average | LCL | UCL | LPL | UPL | Average | LCL | UCL | LPL | UPL | Average | LCL | UCL | LPL | UPL | |
| 20 | 79.6 | 78.6 | 80.6 | 79.6 | 83.6 | 76.8 | 75.5 | 78.1 | 71.8 | 81.7 | 87.3 | 85.9 | 88.7 | 79.8 | 94.8 |
| 25 | 81.8 | 80.7 | 82.8 | 77.7 | 85.8 | 79.3 | 78.0 | 80.7 | 74.3 | 84.3 | 89.6 | 87.8 | 91.5 | 82.1 | 97.2 |
| 30 | 83.1 | 81.7 | 84.5 | 79.0 | 87.1 | 81.0 | 79.1 | 82.8 | 75.9 | 86.0 | 92.0 | 89.4 | 94.6 | 84.2 | 99.8 |
| 35 | 83.5 | 81.2 | 86.0 | 79.0 | 88.1 | 81.7 | 78.7 | 84.8 | 76.1 | 87.4 | 94.4 | 91.0 | 97.8 | 86.3 | 102.5 |
| 37 | 83.5 | 80.4 | 86.5 | 78.6 | 88.4 | 81.8 | 78.0 | 85.6 | 75.7 | 87.9 | 95.3 | 91.6 | 99.0 | 87.1 | 102.5 |
LCL, lower confidence limit; LPL, lower prediction limit; UCL, upper confidence limit; UPL, upper prediction limit.
OSHA PEL
In this study, no employees’ predicted 8-h TWAs exceeded the OSHA PEL. The highest exposure recorded was from one employee who changed 37 tires and had an exposure of 82.6 dBA (8-h predicted TWA). The distribution of the 8-h TWA predicted noise measurements collected using the PEL parameters can be found in Fig. 3.
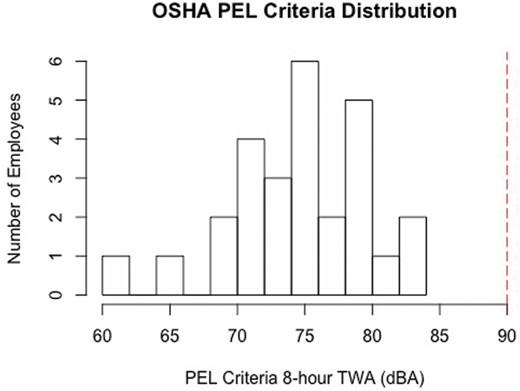
OSHA PEL criteria distribution (n = 30).
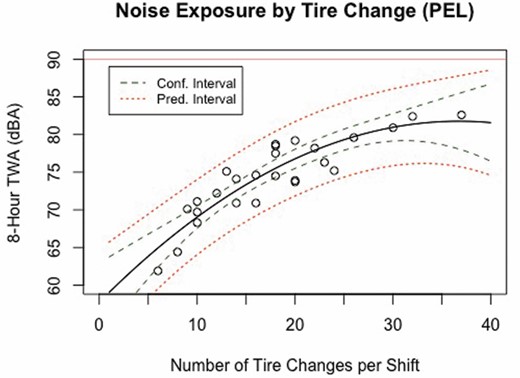
A polynomial regression (Table 4) was performed comparing the OSHA PEL 8-h TWA predicted noise measurements to the number of tires changed during a shift (Fig. 4). Again, the 95% confidence interval for the average expected 8-h TWA noise level at each number of tire changed is represented by the green, narrower dashed line and the 95% noise prediction interval that could be expected when randomly sampling one worker is represented by the orange, wider dotted line.
Summary of regression results—OSHA PEL.
| Estimate | Standard error | t | P value | |
|---|---|---|---|---|
| Intercept | 57.729767 | 2.526354 | 22.851 | <2e−16 |
| X | 1.308619 | 0.266254 | 4.915 | 5.76e−05 |
| X 2 | −0.017809 | 0.006362 | −2.799 | 0.0102 |
| Residual standard error | 2.303 (23 DF) | |||
| Multiple R2 | 0.816 | |||
| Adjusted R2 | 0.8 | |||
| Equation | y = −0.017809x2 + 1.308619x + 57.729767 |
Noise exposure by tire change (OSHA PEL criteria).
In examining Fig. 4 and Table 3, if a randomly selected employee was monitored using OSHA PEL criteria and changed 25 tires in a shift, the estimated noise exposure is between 74.3 and 84.3 dBA. In comparison, the average 8-h TWA noise exposure for all of the employees sampled for 25 tire changes is between 78.0 and 80.7 dBA.
ACGIH TLV
The researchers found that 18 of the 30 (60%) 8-h TWA predicted noise-exposure samples exceeded the ACGIH TLV with the highest noise exposure at 100.6 dBA. The distribution of measured 8-h TWA predicted noise exposures using the ACGIH TLV criteria can be found in Fig. 5.
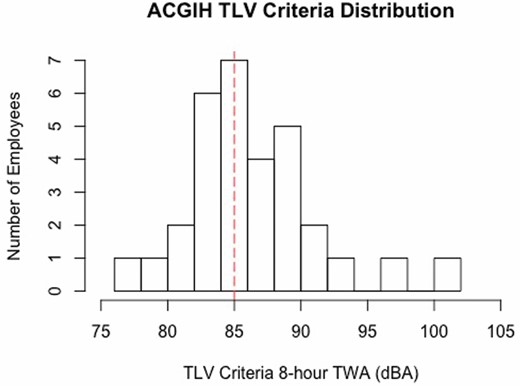
ACGIH TLV criteria distribution (n = 30).
A linear regression was performed comparing the 8-h TWA predicted noise levels based on ACGIH TLV criteria and the number of tires changed during the shift (Fig. 6 and Table 5). Interestingly, the ACGIH TLV data set was the only one of the three data sets to better fit a linear model as compared with a polynomial model (R2 = 0.50).
Summary of regression results—ACGIH TLV.
| Estimate | Standard error | t | P value | |
|---|---|---|---|---|
| Intercept | 77.81625 | 1.73636 | 44.816 | <2e−16 |
| X | 1.308619 | 0.266254 | 4.915 | 5.76e−05 |
| Residual standard error | 3.589 (28 DF) | |||
| Multiple R2 | 0.5003 | |||
| Adjusted R2 | 0.4825 | |||
| Equation | y = 0.47299x + 77.81625 |

Noise exposure by tire change (TLV).
Importantly, based on the average 8-h TWA noise levels measured of all employees sampled (86.3 dBA) found in Fig. 6 and Table 3, it is estimated with 95% confidence that the technicians’ noise exposures would range from 85.9 to 88.7 dBA at only 20 tire changes, exceeding the ACGIH TLV.
Area noise sampling
Area noise samples were collected using a sound-level meter to determine those specific tasks and tools that could pose hazardous levels of noise to the technicians’ hearing. A description of the equipment and tasks and their SPLs can be found in Table 6. As indicated in Table 6, the loudest piece of equipment measured was the Cheetah (i.e. bead seater) at 111 dBA (SPL peak). The Cheetah is a compressed air discharge that is sometimes used to seat tires when the tire machine is unsuccessful. The process using the Cheetah is quickly accomplished and only lasts a relatively short duration of time as compared with the tire-changing machine. The noise produced by the Cheetah is impulsive, and as reference, the ACGIH and OSHA recommend that no employees be exposed to impulsive noise exceeding 140 dB (C-scale for ACGIH and A-scale for OSHA). However, when the tire machine was used to inflate tires, the SPL was measured at 98.5 dBA, a noise level that is still considered hazardous to hearing. It is also interesting to note that using the air ratchet to attach a wheel is more than 10 dB louder as compared with removing a wheel. In addition, when the air ratchet is activated without a load (i.e. not replacing or removing lug nuts), it is relatively louder as compared with when the ratchet is used with a load.
Task or tool area noise measurements.
| Task/tool | SPL, A-weighted (dBA) | SPL, C-weighted (dBC) |
|---|---|---|
| Area sample, background, nonspecific | 73.3 | 75.6 |
| Air ratchet at two feet from employee hearing zone—wheel removal | 75.9 | 78.6 |
| Air ratchet at two feet from employee hearing zone—wheel attachment | 86.9 | 89.9 |
| Air ratchet at two feet without a load | 89.6 | 90.6 |
| Tire change machine at 2 feet—valve stem insertion | 83.2 | 82.4 |
| Cheetah—compressed air discharge | 111.3 | 109.6 |
| Tire change machine at 2 feet—inflating tire | 98.5 | 96.8 |
Discussion
The purpose of this study was to determine if workers in the tire-changing industry were exposed to levels of hazardous noise that could increase their risk of NIHL and to determine if there was a relationship between noise exposure and the number of tires changed in a shift. The researchers found that only one of the 30 predicted 8-h TWA noise-exposure samples was at the OSHA AL of 85 dBA, which requires enrollment into a hearing conservation program per OSHA. However, 18 of the 30 (60%) noise samples exceeded the ACGIH TLV. Due to the noise overexposures as compared with the ACGIH TLV of 85 dBA, it is reasonable to conclude that a proportion of workers in this industry sector are at increased risk of NIHL. NIOSH, in its 1998 Criteria for a Recommended Standard, writes that a criterion level of 90 dBA, such as the criterion level used by OSHA, over a 40-year working life, allows for a 25% excess risk of developing NIHL. The ACGIH TLV, which is equivalent to the NIOSH Recommended Exposure Limit of 85 dBA with a 3 dB exchange rate (8-h TWA), has an estimated excess risk of 8% for the development of NIHL (National Institute for Occupational Safety and Health, 1998). The ACGIH, NIOSH, and OSHA require that all steady-state noise, as well as impulsive noise, be integrated into the noise measurement in determining the 8-h TWA. The premise of integration of the different noise types is based on the equal energy hypothesis (EEH) that noise types of equal energy will cause a similar level of hearing damage (Ahroon et al., 1993). However, researchers have reported that impulse noise is more damaging to human hearing as compared with steady-state noise (Starck et al., 2003) and that complex noise, such as steady-state background noise plus impulse noise, increases hearing damage in animal models beyond what would be expected based on the EEH (Zhu et al., 2009). The authors of the current study noted that impulse noises exceeding 110 dB occurred numerous times in the personal dosimetry data time-history graphs, and as such, the noise environment should be considered complex due to the combination of steady background noise and impact tool use; thus, increasing the risk of NIHL beyond what would be expected based on the EEH. Qiu et al. (2020) have proposed the use of kurtosis to examine complex noise to appropriately adjust a sound equivalent exposure level, so that the amplitude of impulse noise is better accounted for, rather than integrating the overall noise exposure into an 8-h TWA as directed by the ACGIH, OSHA, and NIOSH. In applying a kurtosis adjustment, the authors suggest that NIHL risk may be more accurately estimated. The noise exposures measured in this study, and the risk estimates of developing NIHL, are concerning in the tire changing and repair sector, especially given that none of the employees in any of the shops studied were observed wearing hearing protection devices (although hearing protection was available).
In reference to the OSHA AL and the prediction intervals presented in Fig. 2 and Table 3, a single employee could (with 95% confidence) exceed the OSHA AL of 85 dBA (8-h TWA) by changing only 25 tires in one shift (i.e. prediction interval range = 77.7–85.8 dBA). However, based on the data presented in Fig. 4 and Table 3, it can be predicted (with 95% confidence) that a technician changing 37 tires in one shift would not exceed the OSHA PEL (i.e. prediction interval range = 75.7–87.9 dBA). Even when the polynomial regression is extrapolated to 40 tire changes in a shift, the upper limit for the prediction interval is 88.6 dBA, still less than the OSHA PEL. Most concerning, however, in reference to the confidence limits presented in Fig. 6, is that technicians would only need to change 12 tires for their average 8-h TWA noise exposure to exceed the ACGIH TLV of 85 dBA (8-h TWA). For reference, the average number of tires changed by the employees monitored in this study was 18.
None of the employees in this study were enrolled in a hearing conservation program, which is required by OSHA if the 8-h TWA exceeds 85 dBA. As noted earlier, only one employee was exposed at the OSHA AL in this study. However, given that 60% of the employees sampled exceeded the ACGIH TLV, tire-changing and repair establishments should consider the development of a hearing loss prevention program as recommended by NIOSH (National Institute for Occupational Safety and Health, 1998) if engineering controls are not feasible. Limiting the number of tires changed during a shift may be feasible as an administrative control to reduce noise exposure based on the data presented in this study. Since the shops that were solicited in this study also provided automobile mechanic work (e.g. oil changes and lubrication jobs), those establishments that solely provide tire-changing services may be relatively louder since the frequency of pneumatic tool use may be increased as well as the number of tire changes. Due to the multiple services provided by the shops in this study, there was a noticeable discrepancy between the number of tire changes between employees working the same shift. If the workload of tire changing were allocated equally among technicians, it could possibly reduce individual noise exposures.
Loupa (2013) found that automotive repair facility technicians had an average full-shift noise exposure of 69.3 ± 3.4 dBA, which was lower as compared with the 86 dBA average (3-dB exchange rate, 85-dBA exposure limit) found in this study. This difference in average noise exposure is most likely due to the differences and frequencies in tasks performed and equipment used between the types of automobile shops studied.
Bejan et al. (2011) found that no automobile collision repair employees were exposed to noise above the OSHA PEL but four of 17 exceeded the ACGIH TLV. In contrast, Jayjock and Levin (1984) found noise overexposures up to 160% of the OSHA PEL in a two-person automobile collision repair shop. Likewise, NIOSH sampled one employee in an automobile body repair shop and measured the employee’s exposure at 94.4 dBA, exceeding the OSHA PEL, as well as exceeding the NIOSH REL and ACGIH TLV (McCammon and Sorensen, 1996). The Bejan et al. (2011) study results are somewhat similar to the results in the current study in that no employees were found to be exposed above the PEL. However, a higher proportion of employees in the current study exceeded the ACGIH TLV (24 versus 60%) as compared with Bejan et al. (2011). Again, this difference in noise exposure could be attributed to a difference in the tools and tasks performed by the two types of facilities (i.e. auto body repair versus tire changing). In reference to the Jayjock and Levin study, a contributing factor for the increase in noise levels may also have been the age of the equipment, as compared with modern equipment, since the study was published in 1984.
An additional factor that contributed to the measured noise exposures in this study was the impact noise to which technicians were exposed from non-tire-changing activities. As previously mentioned, the researchers noted from the noise dosimeter time-history graphs that numerous peaks exceeding 110 dB were common and, in one case, a peak value of 116 dBA. The researchers noted that some ancillary activities involved banging metal tools on metal parts (e.g. hammering during mechanical work) which most likely contributed to the tire technicians’ impact noise exposure. Except for the noise monitoring result of the Cheetah, which was measured at 111 dBA (Table 6), none of the equipment-specific measurements exceeded 110 dBA. However, the air ratchet and tire inflation tasks exceeded 85 dBA, which are used routinely by the technicians. When considering all of the equipment that tire technicians routinely use, such as pneumatic air wrenches, tire-changing machines, air compressors, lifting devices, drills, and bead-seating equipment; and considering the hard reflective surfaces which increase reverberation of noise in a shop, there were numerous noise sources in the studied shops that could increase technicians’ risk of developing NIHL.
Conclusions
Based on the personal noise sampling results in this study, the authors conclude that a proportion of tire technicians in the tire-changing and repair sector are at increased risk of NIHL since 60% of the samples measured using ACGIH criteria exceeded the noise TLV. Further, the authors used a novel approach of comparing piece-rate work (i.e. number of tires) to noise exposure that provides a guideline for tire changing and repair/automobile work establishments as an administrative control. This concept of piece-rate work to assist in estimating noise exposure (i.e. the number of ‘pieces’ that may be processed until an occupational exposure limit is reached) could be used for a variety of workplaces to assist managers as an administrative control to make informed decisions about employee exposure. For example, the number of sleeves of nails that could be used by a roofer before occupational noise exposure limits are reached could be beneficial to help control occupational exposure to noise in the roofing industry.
Limitations and future work
The primary limitation in this study was that the technicians sampled were a convenience sample, based solely on the technicians assigned to perform tire changing and repair on any sampling day. Future tire-changing repair studies would benefit from soliciting automobile shops solely dedicated to tire changing and repair (i.e. those that do not include mechanical repair and services and the noise associated with these activities). Another limitation of this study could be attributed to recall bias by the tire technicians regarding the number of wheel changes. The technicians were asked to record the number of wheels they removed and replaced onto a vehicle after each wheel change. It was noticed, however, that technicians may have completed several tallies at once to update the data sheet. This inconsistency of recording the number of wheel changes could have impacted the results.
In addition, to evaluate if tire-changing technicians are at increased risk of hearing loss, future studies should incorporate pre- and post-audiometric testing, in addition to personal dosimetry. The identification of temporary threshold hearing shifts would be informative about the risk of hearing loss to this population of employees. Further, piece-rate work evaluations should be based on task-based sampling assessments that have identified similar exposure groups to help assure that appropriate controls are identified that directly correlate to the similar exposure groups (Jahn et al., 2015).
The results of this study can only be generalized for those tire shops that include other automobile services, such as oil changes, lubrication jobs, and mechanical repair. The results are not generalizable to tire-changing facilities that only offer only tire services. In addition, future studies should be designed to note every tool used by the technicians and the time that the use occurred to better correlate the noise dosimeter time-history graphs and peak exposures for each tool. Last, noise control measures should be evaluated in these types of tire shops to identify alternative or creative noise control solutions to reduce employee exposure.
Acknowledgements
The authors thank the tire shops that graciously allowed the researchers access to their facilities.
Funding
Student trainee support funding for this project was provided by the National Institute for Occupational Safety and Health Mountain and Plains Education and Research Center, Centers for Disease Control and Prevention, grant T42OH009229.
Conflict of interest
The authors declare no conflict of interest relating to the material presented in this article. Its contents, including any opinions and/or conclusions expressed, are solely those of the authors.
References
