


Abstract
Tuberculosis (TB) is a risk factor for chronic obstructive pulmonary disease (COPD), but COPD is also a predictor of TB. The excess life-years lost to COPD caused by TB can potentially be saved by screening for and treating TB infection. We examined the number of life-years that could be saved by preventing TB and TB-attributable COPD. We compared the observed (no intervention) and counterfactual microsimulation models constructed from observed rates in the Danish National Patient Registry (covering all Danish hospitals between 1995 and 2014). In the Danish population of TB and COPD-naive individuals (n = 5,206,922), 27,783 persons (0.5%) developed TB. Among those who developed TB, 14,438 (52.0%) developed TB with COPD. Preventing TB saved 186,469 life-years overall. The excess number of life-years lost to TB alone was 7.07 years per person, and the additional number of life-years lost among persons who developed COPD after TB was 4.86 years per person. The life-years lost to TB-associated COPD are substantial, even in regions where TB can be expected to be identified and treated promptly. Prevention of TB could prevent a substantial amount of COPD-related morbidity; the benefit of screening and treatment for TB infection is underestimated by considering morbidity from TB alone.
Abbreviations
- CI
confidence interval
- COPD
chronic obstructive pulmonary disease
- DNPR
Danish National Patient Registry
- HIV
human immunodeficiency virus
- ICD-8
International Classification of Diseases, Eighth Revision
- ICD-10
International Classification of Diseases, Tenth Revision
- TB
tuberculosis
- TBI
tuberculosis infection
Tuberculosis (TB) is a major global cause of morbidity and mortality; it was the cause of 1.5 million deaths in 2020, making it the second-largest single global infectious disease cause of death, after coronavirus disease 2019 (COVID-19) (1). An important consequence of TB is chronic obstructive pulmonary disease (COPD) (2), which is characterized by progressive obstruction of lung airflow that interferes with normal breathing and is not fully reversible (3). The inflammatory nature of the immune response to TB destroys lung tissue and can result in substantial permanent scarring and chronic respiratory obstruction, predominantly recognized clinically as COPD but probably including a substantial restrictive component.
The odds of COPD among persons who have had an episode of TB disease are 3.8 times those of persons without TB (4, 5). However, COPD is also a risk factor for acquisition of TB (6). Persons with COPD are 1.4–3.0 times more likely to get TB than persons without COPD (7–9). Thus, not all of the COPD seen in TB patients can be attributed to the TB disease episode.
Understanding what proportion of post-TB COPD can be prevented by preventing TB is important, because only the excess fraction of life-years lost among persons with TB and COPD can potentially be saved by screening for and treating TB infection (TBI). To the extent that increased morbidity and mortality due to COPD can be prevented by such treatment, the cost-effectiveness of TBI screening will increase. Estimation of the number of life-years saved by preventing TB and TB-associated COPD has important implications for TBI screening and treatment programs.
The purpose of this study was to examine the number of life-years that could be saved by preventing TB and TB-attributable COPD, occurring in both COPD-naive individuals and individuals with baseline COPD, using a series of microsimulation models with transition parameters observed in the Danish population. These microsimulations allowed us to estimate the preventable fraction of excess mortality by comparing what actually occurred with what would have occurred had the TB been prevented in various intervention scenarios.
METHODS
Data source
This microsimulation study relied on retrospectively analyzed data from the Danish National Patient Registry (DNPR), a population-based administrative registry which has collected data from all Danish hospitals since 1978. Denmark has a uniform tax-supported health-care system with free medical care, and data on all hospital encounters (admission type (emergency room, outpatient clinic, or inpatient), admission and discharge dates, discharge diagnoses, and procedures) nationwide are recorded in the DNPR (10–12). The DNPR records were linked to data in the Danish Civil Registration System, a total population registry, where we extracted information on age, sex, and nativity (Danish vs. foreign-born) for each individual in the cohort (13).
Study population
The initial cohort included all TB-naive individuals with and without COPD, according to the distribution of age, sex, foreign-born status, and COPD in Denmark on January 1, 1995, as defined from the Danish Civil Registration System. The cohort was a closed cohort from January 1, 1995, to December 31, 2014, with no births, and included persons of all ages. There were 5,206,922 individuals in the cohort of persons who started the study with no COPD and no TB. We also created a companion cohort of previously diagnosed COPD patients (n = 110,663) to avoid underestimating both the increased amount of TB (due to COPD’s being a risk factor for TB) and increased mortality (due to COPD that existed at baseline).
Model
The model used was a first-order Monte Carlo stochastic microsimulation model (14, 15), and the simulated cohort represented the Danish population of TB-naive individuals in 1995. Microsimulation models (also known as individual-based state-transition models) are more flexible than more traditional Markov cohort models, as they more accurately reflect the impact of interventions on individual clinical pathways and can introduce stochastic variation in disease progression due to individual-level characteristics. Our main outcome for this study was the number of life-years lost and/or saved by preventing TB. The model estimated the number of life-years saved by preventing TB in 4 incident disease groups: 1) individuals without COPD at baseline who subsequently developed TB but never developed COPD, 2) individuals without COPD at baseline who developed TB and then subsequently developed COPD, 3) individuals without COPD at baseline who subsequently developed COPD and then developed TB, and 4) individuals with COPD at baseline who subsequently developed TB. We used various intervention scenarios, or counterfactuals (i.e., what would have occurred had TB been prevented in the incident disease groups), hereafter referred to as counterfactual intervention scenarios, to calculate the number of life-years saved by preventing TB disease and the number of life-years attributable to COPD in persons with TB. Microsimulation methods have previously been used in other studies to model various counterfactual scenarios, where such models account for competing causes of mortality (16–18). We simulated the occurrence of disease and the survival of individual subjects using transition parameters stratified by age group, sex, and foreign-born status.
Model inputs.
Individuals in the simulated cohort progressed through the various health states, according to transition probabilities determined by age group, sex, and foreign-born status. The model transition rate parameters were populated with TB and COPD clinical data from the DNPR. Inpatient and outpatient clinic primary and secondary discharge diagnoses were used to define TB and COPD. TB was determined using International Classification of Diseases, Eighth Revision (ICD-8) codes 010–019 and International Classification of Diseases, Tenth Revision (ICD-10) codes A15-A19, and COPD was determined using ICD-8 codes 490–493 and 515–518 and ICD-10 codes J40–J47, J60–J67, J68.4, J70.1, J70.3, J84.1, J92.0, J96.1, J98.2, and J98.3. The diagnosis dates of TB and of COPD were based on the first hospital admission date when the discharge summary contained that code and on the first visit to the outpatient clinic. These diagnostic codes have been previously validated in the DNPR (8, 10, 19). According to a previous validation study conducted in the DNPR, the overall positive predictive value of the COPD case definition used in this study was 92% (95% confidence interval (CI): 91, 93) (19).
Information on dates of death and emigration was obtained from the Danish Civil Registration System. Transition rate parameters for each disease state are outlined in Web Table 1 (available at https://doi.org/10.1093/aje/kwad042).
Model scenarios.
The microsimulation model comprised 6 health states: 1) “no COPD, no TB”; 2) “TB, no prior COPD”; 3) “COPD, prior TB”; 4) “COPD, no prior TB”; 5) “TB, prior COPD”; and 6) “death” (Figure 1). An individual could start from either the “no COPD, no TB” health state or the “COPD, no prior TB” health state, depending on their status on January 1, 1995. From the “no COPD, no TB” health state, individuals could either develop COPD first (“COPD, no prior TB”), develop TB first (“TB, no prior COPD”), or die (“death”). If the individual developed COPD, they could go on to develop TB as well (“TB, prior COPD”) or die (“death”). If the individual developed TB first, they could go on to develop COPD as well (“COPD, prior TB”) or die (“death”).
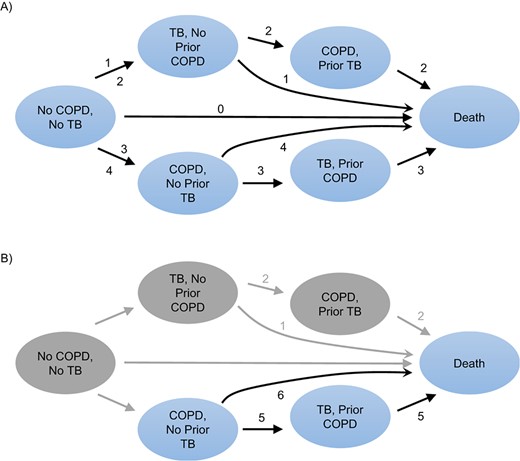
Intervention scenarios and incident disease pathways during a 100-year–period simulation, Denmark, 1995–2014. A) Individuals who started the study with no chronic obstructive pulmonary disease (COPD) and no tuberculosis (TB) at baseline (n = 5,206,922); B) individuals who started the study with COPD and no prior TB at baseline (n = 110,663).
The no-intervention model illustrates a 100-year period in which each individual can pass through (or not pass through) the 6 health states, and it represents what occurred as a result of the model input parameters. By running the simulation for 100 years, we were able to estimate the number of life-years saved by preventing TB over the duration of the lives of all individuals in the population at the outset.
Microsimulation analysis.
We compared the no-intervention model with the counterfactual intervention scenarios to examine the potential effect of preventing TB in the 4 incident TB disease groups. For each microsimulation model, we estimated the number of life-years accrued in the incident disease groups over the 100-year simulation period. With the estimated number of life-years for each group, we were able to estimate the number of life-years saved by preventing TB and subsequent COPD. The number of life-years saved in each health state was estimated by subtracting the number of life-years accrued in the counterfactual intervention scenario (where we prevented disease) from the number of life-years accrued in the no-intervention scenario. The no-intervention and counterfactual intervention scenarios for each incident disease group used the same cohort of people (i.e., the causal contrast was between “what would have occurred in the incident disease group had TB been prevented” and “what actually occurred in the incident disease group”), and thus the comparison groups were comparable. Simulations were run 1,000 times to construct stable 95% simulation intervals to account for the stochasticity of the model. Further details are outlined in the Web Appendix.
Aarhus University, on behalf of the Danish Data Protection Board, authorized use of the data for this study. The study was reported to the Danish Data Protection Agency through registration at Aarhus University (Aarhus, Denmark). Researchers at Boston University (Boston, Massachusetts) received only aggregated deidentified data, and the study was deemed to be exempt from human subjects research by the Boston University Institutional Review Board. Research was conducted with computational resources and services provided by the Boston University Shared Computing Cluster. All analyses were conducted in SAS, version 9.4 (SAS Institute Inc., Cary, North Carolina) (20) and R, version 4.0.0 (21).
RESULTS
Study cohort
There were 5,206,922 individuals without TB or COPD at baseline (“no COPD, no TB”; Figure 1A) and 110,663 with COPD and without TB at baseline (“COPD, no prior TB”; Figure 1B). Table 1 shows the characteristics of the 2 cohorts. Among the individuals without TB or COPD, the mean age was 38.5 (95% CI: 38.5, 38.5) years, 51% were female, and 96% were Danish-born. Among those who had COPD at baseline, the mean age was 48.7 (95% CI: 48.5, 48.8) years, 47% were female, and 98% were Danish-born. There were 6,361 individuals with prior and prevalent TB at baseline who were not included in our cohort (Web Table 2).
Demographic and Disease Characteristics of 2 Cohorts From the Danish National Patient Registry on January 1, 1995
| Cohort | ||||
|---|---|---|---|---|
| No COPD, No TB (n = 5,206,922) | COPD at Baseline (n = 110,663) | |||
| Risk Group | No. | % | No. | % |
| Sex | ||||
| Female | 2,637,453 | 50.65 | 52,413 | 47.36 |
| Male | 2,569,469 | 49.35 | 58,250 | 52.64 |
| Age group, years | ||||
| ≤30 | 2,031,280 | 39.01 | 34,386 | 31.07 |
| 31–50 | 1,566,574 | 30.09 | 14,807 | 13.38 |
| 51–70 | 1,065,086 | 20.45 | 30,445 | 27.51 |
| ≥71 | 543,982 | 10.45 | 31,025 | 28.04 |
| Nativity | ||||
| Danish-born | 4,992,447 | 95.88 | 108,258 | 97.83 |
| Foreign-born | 214,475 | 4.12 | 2,405 | 2.17 |
| Age, yearsa | 38.5 (38.5, 38.5) | 48.7 (48.5, 48.8) | ||
Abbreviation: COPD, chronic obstructive pulmonary disease; TB, tuberculosis.
a Values are presented as mean (95% confidence interval).
Microsimulation model calibration
Since the transition probabilities from each health state were calculated from a cohort of the Danish general population that was free from TB or COPD, the model outputs of the “no COPD, no TB” cohort should have matched empirical Denmark data. When the cohort trajectory was simulated for 20 years, model outputs closely approximated the empirical Denmark population data: The number of deaths in the empirical cohort on December 31, 2014, was 1,071,396, and the corresponding output in the simulated cohort was 1,086,374. The numbers of incident TB cases in the empirical cohort and the simulated cohort were 7,582 and 8,095, respectively, while the numbers of incident COPD cases were 365,438 and 374,417, respectively.
Microsimulation model results
Persons with TB, with and without COPD.
Overall, 27,783 persons (0.5%) developed TB over the course of their simulated lifetime. Of these, 13,345 (48.0%) developed TB without COPD and 14,438 (52.0%) developed TB with COPD. Of those who developed TB with COPD, 8,834 (61.2%) had COPD prior to TB and 5,604 (38.8%) developed COPD concurrently with or after TB. The mean age at the start of the study, the mean ages of TB and COPD development, and the mean age at death are presented in Table 2.
Mean Ages at Study Entry, at Development of Tuberculosis and/or Chronic Obstructive Pulmonary Disease, and at Death in Cohorts From the Danish National Patient Registry, 1995–2014
| Mean Age, years | ||||
|---|---|---|---|---|
| Incident Disease Pathway | At Study Entry | At TB | At COPD | At Death |
| Individuals without COPD or TB at baseline | ||||
| No COPD or TB | 39.3 | N/A | N/A | 78.8 |
| Developed TB, no COPD | 31.4 | 63.8 | N/A | 79.6 |
| Developed TB, subsequent COPD | 27.0 | 54.2 | 66.8 | 75.2 |
| Developed COPD, subsequent TB | 30.3 | 73.7 | 58.4 | 81.5 |
| Individuals with COPD but not TB at baseline | ||||
| No TB | 48.0 | N/A | 48.0 | 73.0 |
| Developed TB | 37.6 | 61.6 | 37.6 | 72.5 |
Abbreviations: COPD, chronic obstructive pulmonary disease; N/A, not applicable; TB, tuberculosis.
Life-years saved by preventing TB in incident disease groups.
Table 3 presents the results of the various microsimulations used to estimate the total number of life-years accrued in the different populations and counterfactual intervention scenarios. Using these results, the number of life-years saved when TB was prevented in the 4 incident disease groups was estimated by subtracting the total life-years accrued in the counterfactual intervention scenarios from the total life-years accrued in the “no intervention” scenario (Table 4).
Total Life-Years Accrued in the Population in Various 100-Year–Period Simulation Scenarios, Denmark, 1995–2014
| Scenario | Pathway(s) Preventeda | No. of LY Accrued (in Thousands) | 95% SI |
|---|---|---|---|
| Individuals without COPD or TB at baseline | |||
| TB and COPD allowed to occur | None | 244,393 | 243,981, 244,778 |
| All TB prevented | 1, 2, and 3 | 244,555 | 244,141, 244,940 |
| TB prevented in persons without COPD | 1 and 2 | 244,421 | 244,008, 244,812 |
| TB prevented in persons with COPD occurring after baseline but before developing TB | 3 | 244,414 | 244,000, 244,797 |
| Individuals with COPD at baseline | |||
| TB allowed to occur | None | 3,441 | 3,425, 3,457 |
| All TB prevented | 5 | 3,445 | 3,429, 3,461 |
Abbreviations: COPD, chronic obstructive pulmonary disease; LY, life-years; SI, simulation interval; TB, tuberculosis.
a See Figure 1.
Number of Life-Years Saved in Each Incident Disease Group When Tuberculosis Was Prevented During a 100-Year–Period Simulation, Denmark, 1995–2014
| Pathway Number(s)a | |||||||
|---|---|---|---|---|---|---|---|
| Incident Disease Pathway | No-Intervention Pathway | TB Prevention Pathway | No. of Persons | 95% SI | No. of LY Saved | 95% SI | Mean No. of LY Saved per Person |
| Individuals without COPD or TB at baseline | |||||||
| Developed TB, no COPD | 1 | 0, 3, or 4 | 13,345 | 10,321, 15,321 | 94,319 | 88,997, 95,551 | 7.07 |
| Developed TB, subsequent COPD | 2 | 0, 3, or 4 | 5,604 | 3,652, 8,012 | 66,871 | 64,646, 73,413 | 11.93 |
| Developed COPD, subsequent TB | 3 | 4 | 7,939 | 6,521, 9,216 | 20,953 | 13,000, 31,505 | 2.64 |
| Individuals with COPD (COPD, no prior TB) at baseline | |||||||
| Developed TB | 5 | 6 | 895 | 851, 870 | 4,326 | 3,120, 5,811 | 4.83 |
| Total | 27,783 | N/A | 186,469 | N/A | 6.71 | ||
Abbreviations: COPD, chronic obstructive pulmonary disease; LY, life-years; N/A, not applicable; SI, simulation interval; TB, tuberculosis.
a See Figure 1.
The lifetime incidence of TB in Denmark was 5.16/1,000 persons in those who did not have TB or COPD at baseline and 8.09/1,000 persons in those with COPD at baseline. When we prevented all TB in the population, 186,469 total life-years were saved. Of these life-years saved, 94,319 (50.6%) were in persons who developed TB but did not ever develop COPD, 66,871 (35.9%) were in persons who developed TB and then COPD, and 25,279 (13.5%) were in persons who developed COPD and then TB.
The mean number of life-years saved per person with TB was 6.71 years (Table 4). This was highest in those who were initially without COPD but went on to develop TB and subsequently COPD (11.93 years). The number of life-years lost that were attributable to TB alone was 7.07 years; thus, the additional number of life-years lost that were incurred in persons with TB and subsequent COPD caused by TB was 4.86 years. The mean number of life-years saved in those who initially had COPD and then developed TB was 2.64 years.
DISCUSSION
We found that only 38.8% of TB patients with COPD had new COPD that occurred following the diagnosis of TB, while 61.2% had had COPD prior to TB. Patients with both COPD and TB had higher mortality than those with TB alone; this was partly due to preexisting COPD and partly due to COPD occurring after the TB disease or worsening of preexisting COPD by TB (7, 9, 22). In our study, we found that an additional 4.9 life-years lost per person were incurred among those with COPD occurring after TB, in addition to 7.1 years due to TB alone. Moreover, although the majority of COPD cases occurred prior to TB, 73% of the life-years lost in patients with TB and COPD occurred in the group that did not have COPD prior to TB. Thus, prevention of TB could prevent a substantial amount of COPD-related morbidity.
A World Health Organization action framework for TB elimination in low-incidence countries encourages screening and treatment for TBI in TB contacts and selected high-risk groups as part of a global TB strategy (23). Additionally, the World Health Organization has issued evidence-based guidelines supporting both screening and preventive therapy for TBI (24). Numerous studies have shown that TBI testing and treatment is cost-effective in low–TB-burden settings, but these studies only account for the deaths due to TB disease, usually occurring during the year following disease onset (25–27). Several studies have indicated that persons whose TB disease is cured by chemotherapy still have decreased long-term survival compared with persons who have not had TB disease (28–30). Our results are consistent with these reports. Preventing TB disease by screening for and treating TBI prevents both mortality from TB disease itself and the excess mortality associated with COPD occurring after TB, and possibly also preexisting COPD worsened by TB. Thus, the benefit of preventing TB has probably been underestimated.
Our findings are generalizable to other low–TB-burden settings, where most TB results from reactivation and where TB case detection and treatment rates are high. In the United States, where reactivation of TBI accounts for approximately 80% of TB cases (31), and in the Netherlands, where more than half of TB cases among the foreign-born are due to infection acquired in their country of origin (32), we would expect that levels of TB-attributable morbidity and mortality similar to those seen in our study could be averted through TBI screening and treatment. In contrast, in areas with high TB prevalence where case detection is incomplete and treatment completion is suboptimal (33), the amount of COPD and COPD-related mortality occurring after TB disease may be greater than we observed, because untreated TB disease probably persists for a longer period, potentially resulting in increased destruction of lung architecture. This is supported by the findings of Byrne et al. (4), who found increased risk of TB-associated COPD in countries with higher TB incidence and incomplete notification.
Our analysis could not specifically address other risk factors for both TB and COPD that are not captured in the DNPR, the most important being smoking. However, the microsimulation model transition parameters captured the effect of smoking in our cohort, and thus we can attribute excess mortality to the indirect effect of smoking mediated through TB. Since smoking was common in Denmark in 1995 (54% of men and 46% of women) (34), our microsimulation validly captured the effect of smoking on TB and COPD outcomes at the population level. Thus, our estimates of life-years saved by preventing TB were valid, since smoking-related morbidity was captured in the overall rates of COPD occurrence that we used. The main limitation is that we could not directly estimate the effects of smoking. Moreover, since treatment of TBI is unlikely to alter the natural history of smoking-related lung disease, our results accurately reflect what could be accomplished by preventing TB in a population with a substantial number of smokers. Different results would probably be observed in a population with a higher or lower prevalence of smoking. Another limitation is that our microsimulation model framework relied on transition probabilities to assess disease progression, and for model parsimony and computational constraints, we were not able to incorporate additional risk factors, such as human immunodeficiency virus (HIV) infection, into the simulation. However, HIV is uncommon among TB patients in Denmark, and in our cohort only 0.2% of the “no COPD, no TB” participants and 0.3% of the “COPD, no prior TB” participants had an HIV diagnosis. Our analysis may also have underestimated TB-related mortality by failing to account for unrecognized restrictive lung disease in persons without COPD. Our simulation was also not able to model the trajectories of persons with a history of TB at baseline, since we did not have information about when they had developed TB and whether, if they had COPD, they had acquired it before or after TB; thus, we may have underestimated the occurrence of such events in the entire cohort from 1995. Nonetheless, even with these limitations, we showed that treatment of latent TBI could avert a substantial amount of morbidity and mortality resulting from COPD (35).
To our knowledge, no previous studies have quantified the life-years gained by preventing TB with and without COPD. We showed that the number of life-years lost to TB-associated COPD are substantial, even in regions where TB can be expected to be identified and treated promptly; in such areas, TBI screening and treatment is probably more cost-effective than previously recognized. In regions where TB is not identified and treated promptly, the number of life-years lost to TB-associated COPD is likely to be even greater. Active case-finding and more effective treatment programs in these regions are needed to prevent the loss of life-years resulting from TB-associated COPD.
ACKNOWLEDGMENTS
Author affiliations: Department of Epidemiology, School of Public Health, Boston University, Boston, Massachusetts, United States (Karla Therese L. Sy, Matthew P. Fox, C. Robert Horsburgh, Jr.), Department of Global Health, School of Public Health, Boston University, Boston, Massachusetts, United States (Karla Therese L. Sy, Matthew P. Fox, C. Robert Horsburgh, Jr.), Department of Clinical Epidemiology, Aarhus University Hospital, Aarhus, Denmark (Erzsébet Horváth-Puhó, Henrik Toft Sørensen, Szimonetta Komjáthiné Szépligeti, Reimar W. Thomsen), Department of Biostatistics, School of Public Health, Boston University, Boston, Massachusetts, United States (Timothy C. Heeren), Health Economics and Epidemiology Research Office, Department of Internal Medicine, School of Clinical Medicine, Faculty of Health Sciences, University of the Witwatersrand, Johannesburg, South Africa (Matthew P. Fox); and Section of Infectious Diseases, Department of Medicine, School of Medicine, Boston University, Boston, Massachusetts, United States (C. Robert Horsburgh, Jr.).
This work was facilitated by the Providence/Boston Center for AIDS Research (grant P30AI042853), the Boston University-Rutgers University Tuberculosis Research Unit (grant U19AI111276), and the Indo-U.S. Vaccine Action Program Initiative on Tuberculosis (Civilian Research and Development Foundation (CRDF) Global/National Institute of Allergy and Infectious Diseases).
The data set used in this study is available from the corresponding author.
This work was presented at the 52nd Union World Conference on Lung Health (virtual), October 19–22, 2021.
The views expressed in this article are those of the authors and do not reflect those of the funding bodies.
Conflict of interest: none declared.

