


Abstract
Using 5 diet quality indexes, we estimated the mortality and life expectancy lost, at the national level, attributable to poor dietary patterns, which had previously been largely unknown. We used the Canadian Community Health Survey 2004, linked to vital statistics (n = 16,212 adults; representing n = 22,898,880). After a median follow-up of 7.5 years, 1,722 deaths were recorded. Population attributable fractions were calculated to estimate the mortality burden of poor dietary patterns (Dietary Guidelines for Americans Adherence Index 2015, Dietary Approaches to Stop Hypertension, Healthy Eating Index, Alternative Healthy Eating Index, and Mediterranean Style Dietary Pattern Score). Better diet quality was associated with a 32%–51% and 21%–43% reduction in all-cause mortality among adults aged 45–80 years and ≥20 years, respectively. Projected life expectancy at 45 years was longer for Canadians adhering to a healthy dietary pattern (average of 5.2–8.0 years (men) and 1.6–4.1 (women)). At the population level, 26.5%–38.9% (men) and 8.9%–22.9% (women) of deaths were attributable to poor dietary patterns. Survival benefit was greater for individuals with higher scores on all diet indexes, even with relatively small intake differences. The large attributable burden was likely from assessing overall dietary patterns instead of a limited range of foods and nutrients.
Abbreviations
- AHEI
Alternative Healthy Eating Index
- CCHS
Canadian Community Health Survey
- CI
confidence interval
- DASH
Dietary Approaches to Stop Hypertension
- DGAI
Dietary Guidelines for Americans Adherence Index
- DPMP
Dietary Patterns Methods Project
- HEI
Healthy Eating Index
- HR
hazard ratio
- MSDPS
Mediterranean Style Dietary Pattern Score
With the dramatic increase in life expectancy during the 20th century, we can be more optimistic that good health is achievable and sustainable. Unlike smoking, whose contribution to death and disease has been steadily decreasing, the contribution of poor diet has been increasing—poor diet is now one of the most common preventable behavioral risks for chronic diseases in Canada (1). Despite the leading role of poor dietary patterns in health, there is a lack of evidence regarding the overall mortality burden (attribution) of unhealthy dietary patterns in large, prospective, nationally representative surveys worldwide. The most cited estimates, provided by the Institute for Health Metrics and Evaluation Global Burden of Disease studies, are based on a few selected foods and nutrients (2, 3) that are not available for all countries. This single-nutrient approach is limited in its ability to consider the multidimensionality of dietary intake exposure, and to detect small effects of single dietary constituents (4).
Conceptually, examining overall dietary patterns is more in line with the real world, where individuals do not consume single isolated nutrients but rather varied meals with complex combination of foods and nutrients (5). The dietary pattern approach is promising for examination of chronic diseases, since when one component of diet changes, it is substituted by another and therefore it is the “synergistic and antagonistic” effects of nutritional components that predict the chronic disease risk (6). Examining dietary patterns is increasingly recognized as an approach for informing public health recommendations. However, the most recent systematic reviews of dietary patterns—performed by the US Department of Agriculture—demonstrated an underdeveloped evidence base for longitudinal association of dietary patterns with several health outcomes (5, 7, 8). Particularly, the National Cancer Institute’s Dietary Pattern Methods Project (DPMP) and the US Department of Agriculture (8–10) have identified the Dietary Approaches to Stop Hypertension (DASH) (11), Healthy Eating Index (HEI) (12), Alternative Healthy Eating Index (AHEI) (13), Mediterranean Style Dietary Pattern Score (MSDPS) (14), and Dietary Guidelines for Americans Adherence Index (DGAI) (15) as dietary patterns commonly used in North American populations with relevance to dietary guidelines (10).
The lack of nationally representative burden estimates for dietary patterns is a critical gap in policy development. Previous evaluation of successful public health policy has indicated that burden estimates are critical as they provide powerful input for policy and can constitute a “business case” for public health policy development (16, 17). This is important as modification of dietary intake is a cornerstone for prevention policy (18). As such, population burden measures that estimate the number of preventable events achievable through the reduced prevalence of modifiable risk factors are of high relevance for resource allocation, primary prevention, and prioritization (19).
The evidence supporting the protective effects of healthy dietary patterns has been derived mainly from prospective cohort studies among middle-aged or older adults, with known limitations (e.g., potential selection bias and lack of generalizability, use of a single food frequency questionnaire, ignoring measurement errors) (10, 20). To our knowledge, no previous study has examined the population burden of mortality attributable to poor dietary patterns at the national level. The concept of a dose-response relationship between dietary patterns and mortality is still controversial, and the type of dietary pattern most beneficial for primary prevention needs further clarification, especially in diverse countries following Western-type dietary patterns (21).
Given the limited evidence on the topic, we addressed the following a priori research questions: 1) Are healthier dietary patterns, as characterized by higher scores on 5 common diet quality indexes, consistently associated with reduced risk of all-cause mortality? 2) Are different index scores equally protective, and is there a rank (e.g., percentile) at which mortality benefit begins (i.e., prognostic utility of indexes)? And 3) what is the population attributable fraction of mortality and estimated life expectancy lost due to poor dietary patterns? In addressing these research questions, attention was given to mitigating the effect of random and systematic measurement errors in self-reported dietary recalls.
METHODS
This study was approved by the Ottawa Health Science Network Research Ethics Board. Data were collected under the authority of the Statistics Act of Canada and were accessed and analyzed at Statistics Canada (Ottawa, Canada). Data linkages were completed through funding from Statistics Canada, Health Canada, and Canadian Institutes of Health Research.
Study population and design
We used data from the first Canadian national nutrition survey—the Canadian Community Health Survey (CCHS), Nutrition, 2004—linked to the Canadian Vital Statistics Death Database. The CCHS-Nutrition 2004 is a cross-sectional, multistage and complex survey conducted by Statistics Canada (January 2004 to January 2005), representing approximately 98% of the Canadian population (response rate = 76.5%) (22, 23). Trained interviewers used the modified US Department of Agriculture automated multiple-pass method to collect standardized 24-hour dietary recalls (24). A second 24-hour dietary recall was collected by phone from approximately 30% of participants, 7–10 days after collecting the first dietary recall. The second day of dietary recalls was used to estimate usual intake distribution by accounting for day-to-day variation in intakes using the National Cancer Institute’s method (25, 26) (Web Appendix 1, available at https://doi.org/10.1093/aje/kwac189). This variation in the diets of the 30% of the participants with a second recall was used to extrapolate the variability in the diets of those with only 1 day of recall. Participants with either 1 or 2 days of recalls were included in the analysis.
Of 33,469 CCHS-Nutrition 2004 participants who agreed to share their data, 29,897 were linked to the Canadian Vital Statistics Death Database—a census of all deaths registered in Canada (linkage rate = 5.3%). Details on the external and internal validity of the linkage have been previously published (27, 28). Participants in CCHS-Nutrition 2004 were followed to December 31, 2011; participants with no recorded death by this date were censored.
After removing those under 20 years of age, participants with invalid dietary recalls (as defined by Statistics Canada as incomplete, implausible, or lacking sufficient data (n = 35)), and all pregnant and breastfeeding women (n = 191), the sample included 16,212 respondents. Of these, 4,901 (representing 6,147,470 Canadians) had completed the second day of dietary recall. In line with previous studies on the topic (9, 10), we restricted our sample to participants aged 45–80 years in sensitivity analyses, leaving a final analytical sample of 9,174 participants (representing 11,313,844 Canadians) of whom 2,671 (representing 2,953,337 Canadians) had a second day of dietary recalls.
Dietary pattern ascertainment
We defined dietary patterns using several well-established dietary quality indexes that provide a common and standardized metric for comparing findings across populations, including those recommended by the National Cancer Institute’s DPMP (9, 10). All diet quality indexes suggested by the DPMP (10) and the US Department of Agriculture (7)—DASH 2017 (11), HEI 2010 (12), AHEI 2010 (13), MSDPS 2009 (14), and the latest DGAI 2015 (15, 29)—were used. Web Table 1 presents an overview of components and scoring criteria for each of the 5 indexes, and Web Table 2 shows the Pearson correlation coefficients for the association among the indexes.
Statistical analysis
All analyses were weighted using Statistics Canada’s sampling survey weights to ensure a nationally representative sample (23). Analyses were conducted using SAS, version 9.4 (SAS Institute, Inc., Cary, North Carolina), and R, version 3.4.0 (R Foundation for Statistical Computing, Vienna, Austria). Missing values for sociodemographic and lifestyle variables were imputed using multiple imputation (Hmisc package) (30) in R with the full list of predictor variables, censoring and time-to-event variables, and auxiliary variables that were not predictors but were helpful for the multiple imputation process. Prior to imputation, a correction factor to correct for the bias in self-reported height and weight (compared with measured anthropometry) was used for body mass index (31). Random and systematic measurement errors (e.g., misreporting) were thoroughly identified and addressed, including by using 2 days of dietary recalls and including misreporting as a covariate (Web Appendix 1) (25, 32–34). A priori sensitivity analyses were conducted (Web Appendix 2).
The Cox model proportional hazards assumptions were verified by plotting weighted Schoenfeld residuals against time-to-event variables, which revealed no evidence of departure from proportionality of hazards over time (35). Terms for interaction of person-time and dietary pattern scores were also nonsignificant, further confirming that assumptions were satisfied. Weighted Cox proportional hazard models with person-days as the time metric were fitted as part of the regression calibration to model time to death—while simultaneously adjusting for influential covariates—to estimate hazard ratios (HRs) and 95% confidence intervals (CIs) for the association of dietary pattern scores and mortality. To maximize the generalizability of findings, most of the covariates used were from a standardized list of covariates determined a priori by the Dietary Patterns Methods Project (age, race/ethnicity, education, marital status, physical activity, smoking, energy intake, body mass index, diabetes, and alcohol intake). All recommended covariates were used in the regression calibration models except for postmenopausal hormone replacement therapy (for models analyzing women), which is not available in CCHS-Nutrition, and race/ethnicity, which was replaced with immigrant status because of power and degrees-of-freedom issues with using race/ethnicity in a mostly Caucasian (as identified in Statistics Canada data) sample (10). Chronic diseases (i.e., heart disease, diabetes, cancer) were included as covariates because of their important contribution to mortality in Canada. As a sensitivity analysis, we also looked at chronic diseases as effect modifiers by adding them as terms for interaction of diet with each of the 3 diseases at baseline in the same model. Additionally, to account for concerns with dietary data collection, models further adjusted for the sequence of dietary recall (first or second) and the day of the week on which the 24-hour recall was collected (weekend/weekday). Weighted and adjusted Kaplan-Meier curves were plotted to represent the probability of survival among groups with different dietary pattern scores, and log-rank statistics were used to measure the equality of ranks. Weighted population attributable fraction was calculated as described in Web Appendix 3.
Baseline Characteristics and Crude Mortality Rates per 10,000 Person-Years (Unweighted) Among Men (n = 7,355), Canadian Adults in Canadian Community Health Survey–Nutrition Linked to Canadian Vital Statistics Death Database, 2004/2005 to 2011
| Variable | Frequency, % | Person-Years | No. of Deaths | Crude Mortality Rate, Per 10,000 Person-Years | Age-Standardized Rate | 95% CI |
|---|---|---|---|---|---|---|
| Baseline age categories, years | 100 | 52,227.3 | 806 | 154.3 | 126.3 | 117.2, 136.0 |
| <45 | 39.4 | 21,609.1 | 25 | 11.6 | ||
| 45–80 | 55.3 | 28,605.6 | 550 | 192.3 | ||
| ≥80 | 5.3 | 2,012.7 | 231 | 1,147.7 | ||
| Age categories, 10-year intervals | ||||||
| <30 | 18.1 | 9,888.6 | 7 | 7.1 | ||
| 30–39 | 13.1 | 7,198.7 | 8 | 11.1 | ||
| 40–49 | 17.5 | 9,572.2 | 30 | 31.3 | ||
| 50–59 | 18.5 | 10,023.5 | 60 | 59.9 | ||
| 60–69 | 13.0 | 6,679.2 | 140 | 209.6 | ||
| 70–79 | 13.5 | 6,372.9 | 298 | 467.6 | ||
| 80–89 | 5.9 | 2,363.8 | 238 | 1,006.8 | ||
| ≥90 | 0.5 | 128.5 | 25 | 1,945.4 | ||
| Dietary reference intake age groups, years | ||||||
| 19–30 | 19.5 | 10,667.2 | 8 | 7.5 | ||
| 31–50 | 31.2 | 17,116.5 | 40 | 23.4 | ||
| 51–70 | 30.7 | 16,194.5 | 213 | 131.5 | ||
| ≥71 | 18.6 | 8,249.2 | 545 | 660.7 | ||
| Smoking status | ||||||
| Daily/occasional smoker with with ≥20 but <90 cigarettes/day | 11.8 | 6,153.3 | 98 | 159.3 | 240.3 | 187.1, 303.9 |
| Daily/occasional smoker with <20 cigarettes/day | 16.7 | 8,834.1 | 86 | 97.4 | 223.7 | 164.2, 297.6 |
| Former daily/occasional smoker and those who smoked a total of ≥100 cigarettes in lifetime | 36.9 | 18,733.4 | 454 | 242.4 | 121.1 | 108.3, 134.9 |
| Never smoked | 34.6 | 18,506.5 | 168 | 90.8 | 94.3 | 80.0, 110.4 |
| Alcohol consumption over the prior 12 months | ||||||
| None | 16.9 | 8,341.7 | 261 | 312.9 | 159.8 | 139.2, 182.6 |
| Less than 1–3 times per month | 31.8 | 16,697.4 | 248 | 148.5 | 132.2 | 114.6, 151.7 |
| 1–3 times per week | 29.3 | 15,726.5 | 127 | 80.8 | 100.0 | 76.8, 127.9 |
| 4–7 times a week or being binge drinker: drank >2 times per week with the frequency of ≥5 drinks being 1 or more times per week | 22.0 | 11,461.7 | 170 | 1,483.0 | 122.8 | 100.3, 148.9 |
| Physical activity, metabolic equivalents/day | ||||||
| ≥3.0 | 19.7 | 10,491.7 | 97 | 92.5 | 837.0 | 65.5, 105.4 |
| 1.5–3.0 | 24.5 | 13,055.9 | 137 | 104.9 | 965.0 | 75.5, 121.5 |
| <1.5 | 55.8 | 28,679.8 | 572 | 199.4 | 148.8 | 136.3, 162.0 |
| Body mass indexa | ||||||
| <18.5 | 1.1 | 449.2 | 27 | 601.1 | 391.2 | 248.3, 586.4 |
| 18.5–24.9 | 29.4 | 15,139.5 | 285 | 188.3 | 142.3 | 125.6, 160.7 |
| 25.0–29.9 | 40.4 | 21,159.8 | 315 | 148.9 | 117.1 | 102.6, 133.0 |
| ≥30.0 | 29.1 | 15,478.8 | 179 | 115.6 | 129.1 | 105.1, 157.1 |
| Respondent’s highest level of education | ||||||
| Less than secondary school graduation | 26.4 | 13,122.8 | 398 | 303.3 | 148.6 | 131.9, 166.7 |
| Secondary school graduation | 16.6 | 8,833.2 | 80 | 90.6 | 117.2 | 83.0, 160.8 |
| Some postsecondary education | 8.8 | 4,642.2 | 53 | 114.2 | 133.3 | 98.9, 175.8 |
| Postsecondary graduation | 48.2 | 25,629.1 | 275 | 107.3 | 115.9 | 101.4, 132.0 |
| Current diabetes | ||||||
| Yes | 8.4 | 4,057.0 | 151 | 372.2 | 156.5 | 127.6, 190.0 |
| No | 91.6 | 48,170.3 | 655 | 136.0 | 120.7 | 111.1, 130.9 |
| Current heart disease | ||||||
| Yes | 10.3 | 4,712.0 | 250 | 530.6 | 161.6 | 138.5, 187.5 |
| No | 89.7 | 47,515.3 | 556 | 117.0 | 118.0 | 107.6, 129.3 |
| Current cancer | ||||||
| Yes | 3.0 | 1,246.0 | 92 | 738.4 | 284.6 | 164.0, 459.3 |
| No | 97.0 | 50,981.3 | 714 | 140.1 | 120.5 | 111.2, 130.3 |
| Current hypertension | ||||||
| Yes | 20.2 | 9,886.8 | 344 | 347.9 | 140.2 | 121.3, 161.1 |
| No | 79.8 | 4,2340.5 | 462 | 109.1 | 121.0 | 109.6, 133.3 |
| Marital status | ||||||
| Married/common-law | 56.5 | 29,752.8 | 433 | 145.5 | 993.0 | 89.0, 110.4 |
| Widowed/separated/divorced/single, never married | 43.5 | 22,474.5 | 373 | 166.0 | 173.5 | 155.9, 192.5 |
| Misreporting status | ||||||
| Underreporter | 30.8 | 15,921.9 | 283 | 177.7 | 127.9 | 112.7, 144.6 |
| Plausible reporter | 57.3 | 29,944.3 | 470 | 157.0 | 129.5 | 117.0, 142.9 |
| Overreporter | 11.9 | 6,361.2 | 53 | 83.3 | 104.6 | 75.7, 140.7 |
| Immigration status | ||||||
| Canadian Born | 85.4 | 44,583.6 | 690 | 154.8 | 137.8 | 126.6, 149.6 |
| Immigrant | 14.6 | 7,643.7 | 116 | 151.8 | 86.9 | 70.1, 106.5 |
| Neighborhood deprivation indexb | ||||||
| Low | 12.7 | 6,614.2 | 95 | 143.6 | 317.3 | 88.5, 802.9 |
| Moderate | 70.0 | 36,695.2 | 545 | 148.5 | 119.8 | 109.4, 130.9 |
| High | 17.3 | 8,918.0 | 166 | 186.1 | 169.1 | 143.6, 197.8 |
| Self-perceived health | ||||||
| Poor | 3.7 | 1,573.2 | 105 | 667.4 | 373.7 | 299.1, 461.3 |
| Fair | 12.0 | 5,795.2 | 207 | 357.2 | 192.9 | 163.9, 225.6 |
| Good | 31.7 | 16,586.9 | 251 | 151.3 | 122.2 | 104.4, 142.3 |
| Very good | 34.0 | 18,234.4 | 172 | 94.3 | 91.4 | 77.5, 107.0 |
| Excellent | 18.6 | 10,037.5 | 71 | 70.7 | 78.8 | 60.9, 100.4 |
| Self-perceived stress | ||||||
| Not at all stressful | 14.6 | 7,223.8 | 224 | 310.1 | 134.8 | 113.9, 158.4 |
| Not very stressful | 26.1 | 1,3588.0 | 246 | 181.0 | 111.6 | 96.0, 128.9 |
| A bit stressful | 38.4 | 20,321.9 | 242 | 119.1 | 134.8 | 116.1, 155.6 |
| Quite a bit stressful | 17.7 | 9,387.5 | 78 | 83.1 | 154.6 | 114.1, 204.7 |
| Extremely stressful | 3.2 | 1,706.1 | 16 | 93.8 | 119.3 | 61.7, 208.2 |
| Sense of belonging to local community | ||||||
| Very strong | 22.5 | 11,696.5 | 215 | 183.8 | 109.8 | 94.2, 127.3 |
| Somewhat strong | 41.4 | 21,748.0 | 315 | 144.8 | 118.9 | 104.9, 134.2 |
| Somewhat weak | 23.9 | 12,489.5 | 171 | 136.9 | 144.1 | 122.7, 168.0 |
| Very weak | 12.2 | 6,293.4 | 105 | 166.8 | 160.4 | 130.3, 195.2 |
| Household food security status | ||||||
| Food secure | 93.3 | 48,681.1 | 773 | 158.8 | 123.4 | 114.3, 133.1 |
| Food insecure without hunger | 3.5 | 1,831.6 | 21 | 114.7 | 151.1 | 78.8, 262.3 |
| Food insecure with moderate/severe hunger | 2.7 | 1,486.6 | 12 | 80.7 | 119.6 | 44.7, 257.8 |
| Not stated | 0.4 | 228.1 | 0.0 | 0.0 | 0.0 | |
Abbreviation: CI, confidence interval.
a Body mass index calculated as weight (kg)/height (m)2.
b An area-based deprivation index was used that categorizes dissemination areas (smallest geostatistical units of Canadian census) into 2 sets of quintile groups: one for the social components of deprivation (% of people living alone, % of people divorced/separated, and % of single-parent families) and one for the material components (% without high school graduation, employment ratio, and the average income). Quintile 1 in each group represents the 20% least deprived while quintile 5 represents the 20% most deprived; when cross-tabulated, these quintiles create 25 distinct cells. We defined “low neighborhood deprivation” as dissemination areas with social and material combinations in quintiles 1 and 2 (4 cells) and “high neighborhood deprivation” as dissemination areas with social and material combinations in quintiles 4 and 5 (4 cells). The remaining dissemination areas (17 cells) were classified as having “moderate neighborhood deprivation” (57, 58).
RESULTS
Within the 115,566 person-years of follow-up (median, 7.48 (interquartile range, 7.22–7.7) years), 1,722 deaths were recorded. The mean age at baseline and end of follow-up were, for men, 46.09 (standard error, 0.17) and 53.33 (standard error, 0.17) and, for women, 47.97 (standard error, 0.34) and 55.31 (standard error, 0.34), respectively. Baseline characteristics and crude and age-standardized mortality rates for sociodemographic and lifestyle behaviors are presented in Tables 1 and 2. Among men, being underweight (body mass index < 18.50) was associated with the highest age-standardized mortality rate per 10,000 person-years (391.2, 95% CI: 248.3, 586.4), while in women, being a daily/occasional smoker with 20–90 cigarettes per day was associated with the highest age-standardized mortality rate per 10,000 person-years (351.7, 95% CI: 80.1, 982.6). As expected, favorable lifestyle behavior and sociodemographic exposure categories resulted in the lowest age-standardized mortality rates (e.g., never or less frequent smoking, moderate alcohol consumption, greater physical activity, higher education, better self-perceived health, and a greater sense of belonging to the local community).
Baseline Characteristics and Crude Mortality Rates per 10,000 Person-Years (Unweighted) Among Women (n = 8,857), Canadian Adults in Canadian Community Health Survey–Nutrition Linked to Canadian Vital Statistics Death Database, 2004/2005 to 2011
| Variable | Frequency, % | Person-Years | No. of Deaths | Crude Mortality Rate, Per 10,000 Person-Years | Age-Standardized Rate | 95% CI |
|---|---|---|---|---|---|---|
| Baseline age categories, years | 100 | 63,338.9 | 916 | 144.6 | 84.2 | 78.5, 90.2 |
| <45 | 33.3 | 22,087.6 | 16 | 7.2 | ||
| 45–80 | 57.6 | 36,569.5 | 520 | 142.2 | ||
| ≥80 | 9.1 | 4,681.8 | 380 | 811.7 | ||
| Age categories, 10-year intervals | ||||||
| <30 | 15.6 | 10,341.3 | 5 | 4.8 | ||
| 30–39 | 11.1 | 7,380.9 | 5 | 6.8 | ||
| 40–49 | 15.1 | 9,994.0 | 19 | 19.0 | ||
| 50–59 | 17.4 | 11,333.6 | 61 | 53.8 | ||
| 60–69 | 14.0 | 8,924.1 | 115 | 128.9 | ||
| 70–79 | 16.2 | 9,776.1 | 288 | 294.6 | ||
| 80–89 | 9.6 | 5,141.4 | 361 | 702.1 | ||
| ≥90 | 1.1 | 447.5 | 62 | 1,385.5 | ||
| Dietary reference intake age groups, years | ||||||
| <31 | 16.9 | 11,196.7 | 6 | 5.4 | ||
| 31–50 | 26.6 | 17,651.8 | 25 | 14.2 | ||
| 51–70 | 31.0 | 19,965.7 | 187 | 93.7 | ||
| ≥71 | 25.5 | 14,524.8 | 698 | 480.6 | ||
| Smoking status | ||||||
| Daily/occasional smoker with ≥20 but >90 cigarettes/day | 6.0 | 3,822.6 | 55 | 143.9 | 351.7 | 80.1, 982.6 |
| Daily/occasional smoker with <20 cigarettes/day | 17.3 | 11,098.0 | 110 | 99.1 | 121.7 | 99.4, 147.5 |
| Former daily/occasional smoker and those who smoked a total of ≥100 cigarettes in lifetime | 27.5 | 17,315.7 | 270 | 155.9 | 81.4 | 71.4, 92.4 |
| Never smoked | 49.2 | 31,102.5 | 481 | 154.7 | 70.1 | 63.2, 77.7 |
| Alcohol consumption | ||||||
| None | 8.6 | 16,275.6 | 441 | 271.0 | 103.0 | 90.7, 116.5 |
| Less than 1–3 times per month | 26.8 | 27,776.6 | 308 | 110.9 | 77.9 | 68.9, 87.7 |
| 1–3 times per week | 43.3 | 13,867.5 | 85 | 61.3 | 67.9 | 51.1, 88.4 |
| 4–7 times a week or being binge drinker: drank >2 times per week with the frequency of ≥5 drinks being 1 or more times per week | 21.3 | 5,419.2 | 82 | 151.3 | 81.1 | 63.0, 102.7 |
| Physical activity, metabolic equivalents/day | ||||||
| ≥3.0 | 15.8 | 10,232.7 | 63 | 61.6 | 62.6 | 45.6, 83.8 |
| 1.5–3.0 | 23.7 | 15,284.8 | 123 | 80.5 | 64.3 | 52.0, 78.7 |
| <1.5 | 60.6 | 37,821.5 | 730 | 193.0 | 95.2 | 87.7, 103.1 |
| Body mass indexa | ||||||
| <18.5 | 2.2 | 1,292.8 | 37 | 286.2 | 167.7 | 105.0, 254.2 |
| 18.5–24.9 | 36.7 | 23,134.6 | 349 | 150.9 | 88.4 | 78.6, 99.1 |
| 25.0–29.9 | 32.2 | 20,405.3 | 286 | 140.2 | 73.0 | 64.1, 82.9 |
| ≥30.0 | 29.0 | 18,506.2 | 244 | 131.9 | 87.6 | 76.0, 100.5 |
| Respondent’s highest level of education | ||||||
| Less than secondary school graduation | 28.6 | 17,362.1 | 487 | 280.5 | 102.9 | 88.8, 118.5 |
| Secondary school graduation | 17.5 | 11,118.8 | 138 | 124.1 | 87.8 | 72.4, 105.5 |
| Some postsecondary education | 8.2 | 5,269.9 | 49 | 93.0 | 87.4 | 64.2, 116.4 |
| Postsecondary graduation | 45.7 | 29,588.1 | 242 | 81.8 | 73.6 | 64.4, 83.8 |
| Current diabetes | ||||||
| Yes | 8.0 | 4,675.1 | 171 | 365.8 | 154.7 | 115.2, 203.4 |
| No | 92.0 | 58,663.8 | 745 | 127.0 | 77.0 | 71.2, 83.1 |
| Current heart disease | ||||||
| Yes | 8.5 | 4,684.0 | 253 | 540.1 | 130.0 | 106.4, 157.4 |
| No | 91.5 | 58,654.9 | 663 | 113.0 | 75.6 | 69.6, 81.9 |
| Current cancer | ||||||
| Yes | 2.6 | 1,410.4 | 76 | 538.8 | 191.3 | 143.9, 249.3 |
| No | 97.4 | 61,928.5 | 840 | 135.6 | 80.5 | 74.8, 86.6 |
| Current hypertension | ||||||
| Yes | 25.6 | 15,435.3 | 454 | 294.1 | 92.8 | 81.0, 105.9 |
| No | 74.4 | 47,903.6 | 462 | 96.4 | 79.0 | 71.8, 86.7 |
| Marital status | ||||||
| Married/common-law | 47.5 | 30,819.2 | 233 | 75.6 | 66.0 | 56.5, 76.6 |
| Widowed/separated/divorced/single, never married | 52.6 | 32,519.7 | 683 | 210.0 | 98.2 | 89.3, 107.7 |
| Misreporting status | ||||||
| Underreporter | 34.4 | 21,804.4 | 311 | 142.6 | 91.4 | 80.9, 103.0 |
| Plausible reporter | 56.5 | 35,719.3 | 523 | 146.4 | 80.5 | 73.3, 88.3 |
| Overreporter | 9.1 | 5,815.2 | 82 | 141.0 | 83.4 | 65.4, 104.8 |
| Immigration status | ||||||
| Canadian born | 85.7 | 54,301.2 | 786 | 144.8 | 90.6 | 84.1, 97.6 |
| Immigrant | 14.3 | 9,037.7 | 130 | 143.8 | 53.0 | 43.3, 64.3 |
| Neighborhood deprivation indexb | ||||||
| Low | 11.6 | 7,360.3 | 95 | 129.1 | 73.3 | 58.6, 90.6 |
| Moderate | 68.1 | 43,206.1 | 604 | 139.8 | 82.5 | 75.5, 89.9 |
| High | 20.3 | 12,772.6 | 217 | 169.9 | 97.1 | 83.7, 112.1 |
| Self-perceived health | ||||||
| Poor | 4.2 | 2,380.8 | 97 | 407.4 | 200.3 | 155.5, 254.0 |
| Fair | 13.1 | 7,753.9 | 262 | 337.9 | 150.5 | 129.2, 174.2 |
| Good | 31.6 | 19,970.5 | 297 | 148.7 | 80.3 | 70.1, 91.6 |
| Very good | 34.7 | 2,2403.8 | 209 | 93.3 | 61.3 | 53.0, 70.5 |
| Excellent | 16.6 | 10,829.8 | 51 | 47.1 | 42.9 | 31.6, 57.0 |
| Self-perceived stress | ||||||
| Not at all stressful | 12.6 | 7,705.5 | 202 | 262.2 | 83.9 | 65.5, 106.0 |
| Not very stressful | 25.7 | 16,056.6 | 295 | 183.7 | 77.2 | 67.9, 87.5 |
| A bit stressful | 39.8 | 25,462.3 | 298 | 117.0 | 87.9 | 77.7, 99.0 |
| Quite a bit stressful | 18.2 | 11,739.7 | 96 | 81.8 | 90.4 | 72.1, 111.9 |
| Extremely stressful | 3.7 | 2,374.8 | 25 | 105.3 | 133.4 | 85.1, 199.2 |
| Sense of belonging to local community | ||||||
| Very strong | 25.3 | 15,883.1 | 281 | 176.9 | 73.9 | 64.6, 84.1 |
| Somewhat strong | 40.9 | 26,118.4 | 328 | 125.6 | 82.7 | 73.4, 92.8 |
| Somewhat weak | 22.2 | 14,099.7 | 181 | 128.4 | 88.5 | 75.6, 103.0 |
| Very weak | 11.6 | 7,237.7 | 126 | 174.1 | 120.1 | 98.6, 145.0 |
| Household food security status | ||||||
| Food secure | 91.9 | 58,030.8 | 885 | 152.5 | 82.8 | 77.0, 88.8 |
| Food insecure without hunger | 4.8 | 3,159.6 | 17 | 53.8 | 75.5 | 42.4, 124.3 |
| Food insecure with moderate/severe hunger | 3.1 | 2,022.5 | 14 | 69.2 | 137.5 | 37.2, 353.2 |
| Not stated | 0.2 | 126.0 | 0.0 | 0.0 | 0.0 | |
Abbreviation: CI, confidence interval.
a Body mass index calculated as weight (kg)/height (m)2.
b An area-based deprivation index was used that categorizes dissemination areas (smallest geostatistical units of Canadian census) into 2 sets of quintile groups: one for the social components of deprivation (% of people living alone, % of people divorced/separated, and % of single-parent families) and one for the material components (% without high school graduation, employment ratio, and the average income). Quintile 1 in each group represents the 20% least deprived while quintile 5 represents the 20% most deprived; when cross-tabulated, these quintiles create 25 distinct cells. We defined “low neighborhood deprivation” as dissemination areas with social and material combinations in quintiles 1 and 2 (4 cells) and “high neighborhood deprivation” as dissemination areas with social and material combinations in quintiles 4 and 5 (4 cells). The remaining dissemination areas (17 cells) were classified as having “moderate neighborhood deprivation” (57, 58).
Weighted and Multivariable-Adjusted Hazard Ratios for All-Cause Mortality According to 1-Unit Increase in Usual Intake Score of 5 Dietary Quality Index Scores Reported at Midpoint of Quintiles, Canadian Adults in Canadian Community Health Survey–Nutrition Linked to Canadian Vital Statistics Death Database, 2004/2005 to 2011
| Model 1c,d | Model 2c | Model 3 (Main Model)c,e | Model 4c,f | Model 5g,h | ||||||||
|---|---|---|---|---|---|---|---|---|---|---|---|---|
| Quintile | Median Scorea | Median Scoreb | HRi | 95% CI | HRi | 95% CI | HRi | 95% CI | HRi | 95% CI | HRi | 95% CI |
| Dietary Guideline for Americans Adherence Index 2015j | ||||||||||||
| 1 | 6.64 | 6.42 | 1.00 | Referent | 1.00 | Referent | 1.00 | Referent | 1.00 | Referent | 1.00 | Referent |
| 2 | 7.48 | 7.23 | 0.78 | 0.70, 0.86 | 0.81 | 0.71, 0.93 | 0.81 | 0.71, 0.93 | 0.82 | 0.71, 0.93 | 0.91 | 0.82, 1.00 |
| 3 | 8.06 | 7.82 | 0.65 | 0.55, 0.78 | 0.71 | 0.57, 0.89 | 0.7 | 0.56, 0.88 | 0.71 | 0.56, 0.88 | 0.85 | 0.71, 1.01 |
| 4 | 8.57 | 8.36 | 0.56 | 0.43, 0.71 | 0.63 | 0.46, 0.85 | 0.62 | 0.45, 0.84 | 0.62 | 0.46, 0.85 | 0.79 | 0.62, 1.01 |
| 5 | 9.32 | 9.14 | 0.44 | 0.31, 0.62 | 0.52 | 0.34, 0.79 | 0.51 | 0.33, 0.79 | 0.52 | 0.34, 0.79 | 0.72 | 0.51, 1.01 |
| Dietary Approaches to Stop Hypertension 2017k | ||||||||||||
| 1 | 36.96 | 36.26 | 1.00 | Referent | 1.00 | Referent | 1.00 | Referent | 1.00 | Referent | 1.00 | Referent |
| 2 | 41.19 | 40.33 | 0.79 | 0.72, 0.87 | 0.83 | 0.74, 0.93 | 0.82 | 0.73, 0.92 | 0.82 | 0.72, 0.92 | 0.89 | 0.81, 0.97 |
| 3 | 44.56 | 43.50 | 0.66 | 0.56, 0.79 | 0.72 | 0.58, 0.88 | 0.7 | 0.57, 0.86 | 0.7 | 0.57, 0.87 | 0.81 | 0.68, 0.96 |
| 4 | 47.89 | 46.57 | 0.55 | 0.43, 0.71 | 0.62 | 0.46, 0.83 | 0.6 | 0.44, 0.81 | 0.6 | 0.44, 0.81 | 0.74 | 0.58, 0.94 |
| 5 | 52.04 | 50.84 | 0.43 | 0.30, 0.61 | 0.52 | 0.34, 0.77 | 0.49 | 0.32, 0.75 | 0.49 | 0.33, 0.75 | 0.65 | 0.47, 0.91 |
| Healthy Eating Index 2010j | ||||||||||||
| 1 | 49.87 | 48.83 | 1.00 | Referent | 1.00 | Referent | 1.00 | Referent | 1.00 | Referent | 1.00 | Referent |
| 2 | 55.79 | 54.36 | 0.8 | 0.73, 0.88 | 0.83 | 0.74, 0.93 | 0.82 | 0.73, 0.93 | 0.83 | 0.73, 0.93 | 0.89 | 0.80, 0.99 |
| 3 | 59.69 | 58.08 | 0.68 | 0.58, 0.81 | 0.74 | 0.61, 0.89 | 0.72 | 0.59, 0.89 | 0.73 | 0.60, 0.89 | 0.82 | 0.70, 0.98 |
| 4 | 63.72 | 61.85 | 0.58 | 0.46, 0.74 | 0.65 | 0.49, 0.85 | 0.63 | 0.48, 0.84 | 0.64 | 0.48, 0.85 | 0.76 | 0.60, 0.97 |
| 5 | 68.68 | 66.66 | 0.47 | 0.34, 0.66 | 0.56 | 0.38, 0.80 | 0.54 | 0.37, 0.79 | 0.55 | 0.37, 0.80 | 0.69 | 0.50, 0.95 |
| Alternative Healthy Eating Index 2010j,l | ||||||||||||
| 1 | 30.28 | 28.00 | 1.00 | Referent | 1.00 | Referent | 1.00 | Referent | 1.00 | Referent | 1.00 | Referent |
| 2 | 34.11 | 32.08 | 0.82 | 0.76, 0.89 | 0.86 | 0.79, 0.94 | 0.85 | 0.78, 0.93 | 0.85 | 0.77, 0.93 | 0.85 | 0.78, 0.93 |
| 3 | 36.88 | 34.93 | 0.71 | 0.62, 0.82 | 0.77 | 0.66, 0.90 | 0.76 | 0.65, 0.89 | 0.75 | 0.64, 0.88 | 0.76 | 0.66, 0.88 |
| 4 | 39.77 | 37.81 | 0.62 | 0.51, 0.75 | 0.69 | 0.55, 0.86 | 0.68 | 0.54, 0.84 | 0.66 | 0.53, 0.84 | 0.68 | 0.56, 0.83 |
| 5 | 43.89 | 42.13 | 0.49 | 0.37, 0.66 | 0.58 | 0.43, 0.80 | 0.57 | 0.41, 0.79 | 0.56 | 0.40, 0.78 | 0.57 | 0.43, 0.76 |
| Mediterranean Style Dietary Pattern Score 2009j,l | ||||||||||||
| 1 | 10.17 | 10.25 | 1.00 | Referent | 1.00 | Referent | 1.00 | Referent | 1.00 | Referent | 1.00 | Referent |
| 2 | 11.99 | 12.09 | 0.88 | 0.81, 0.96 | 0.9 | 0.81, 1.00 | 0.9 | 0.80, 1.00 | 0.9 | 0.81, 1.02 | 0.93 | 0.86, 1.01 |
| 3 | 13.35 | 13.53 | 0.8 | 0.69, 0.92 | 0.83 | 0.68, 1.00 | 0.83 | 0.68, 1.00 | 0.83 | 0.68, 1.03 | 0.88 | 0.76, 1.01 |
| 4 | 14.64 | 14.91 | 0.72 | 0.58, 0.89 | 0.76 | 0.58, 1.00 | 0.77 | 0.58, 1.00 | 0.77 | 0.58, 1.04 | 0.83 | 0.68, 1.01 |
| 5 | 16.51 | 16.82 | 0.62 | 0.46, 0.85 | 0.68 | 0.47, 0.99 | 0.68 | 0.47, 1.00 | 0.7 | 0.46, 1.06 | 0.77 | 0.58, 1.02 |
Abbreviation: CI, confidence interval; HR, hazard ratio.
a Weighted and error-adjusted usual intake median of the dietary quality index score; corresponds to models 1–4 (45 ≤ age group ≤ 80 years) (midpoint of quintiles).
b Weighted and error-adjusted usual intake median of the dietary quality index score; corresponds to model 5 (≥20 years) (midpoint of quintiles).
c Weighted n = 11,313,844 (unweighted n = 9,174); weighted number of deaths: 900,182.7 (unweighted n = 1,070); weighted person-years = 81,754,462.1 (unweighted person-years = 65,175.1).
d Model 1 (45 ≤ age group≤80 years): adjusted for day of the week on which 24-hour dietary recall was collected (weekday/weekend (Friday–Sunday)), sequence of dietary recall (first or second), baseline age (continuous), and sex.
e Model 3 (45 ≤ age group≤80 years): model 2 covariates in addition to diagnosis of diabetes (yes/no), cancer (yes/no), or heart disease (yes/no) and body mass index (underweight; normal weight; overweight; obese).
f Model 4 (45 ≤ age group ≤ 80 years): model 3 covariates minus misreporting (underreporter, plausible reporter, and overreporter).
g Weighted n = 22,898,880 (unweighted n = 16,212); weighted number of deaths: 1,358,206 (unweighted n = 1,722); unweighted person-years = 115645.4.
h Model 5 (20 ≤ age group): model 3 covariates with the full sample of ≥20 year olds.
i Weighted and multivariable-adjusted HRs are calculated using regression calibration (Cox proportional hazards model) and the 95% CIs calculated by bootstrapping the models estimating usual intake (B = 500 times at each step).
j Model 2 (45 ≤ age group≤80 years): model 1 covariates in addition to education (less than secondary school graduation; secondary school graduation; some postsecondary; postsecondary graduation), smoking (daily/occasional smoker with 20 ≤ cigarettes/day < 90; daily/occasional smoker with < 20 cigarettes/day; former daily/occasional smoker and those who smoked a total of ≥100 cigarettes in lifetime; never smoked), misreporting (underreporter, plausible reporter, and overreporter), physical activity (daily energy expenditure ≥3; 1.5 ≤ daily energy expenditure < 3; and 0 ≤ daily energy expenditure <1.5), marital status (married/common-law partner; widowed/separated/divorced/single; never married) and immigrant (yes/no).
k Model 2 for Dietary Approaches to Stop Hypertension (45 ≤ age group ≤ 80 years):adjusted as in model 2 above, with the addition of alcoholic beverage consumption (over the past 12 months: 0 drinks; less than 1–3 times per month; 1–3 times per week; 4–7 times a week or being binge drinker: drank >2 times per week with the frequency of ≥5 drinks being 1 or more times per week).
l Alternative Healthy Eating Index and Mediterranean Style Dietary Pattern Score scoring algorithms do not directly consider energy and therefore usual intake distribution and regression calibration was conducted estimating a bivariate distribution of Alternative Healthy Eating Index and Mediterranean Style Dietary Pattern Score with energy intake, after winsorizing outliers of energy intake.
Web Table 3 presents the estimated usual intake of 5 dietary quality index scores according to selected characteristics. Across the indexes, participants came closest to meeting the recommendations for the 2010 HEI (59.53%), followed by the 2017 DASH (44.55%) and 2015 DGAI (42.2%). Canadians complied the least with the 2009 MSDPS (13.36%) and 2010 AHEI (36.97%). As presented in Web Table 2, moderate to strong Pearson correlation coefficients were observed between dietary quality indexes.
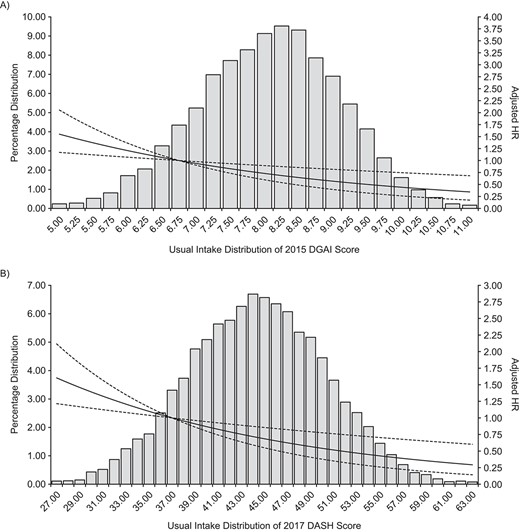
Continues
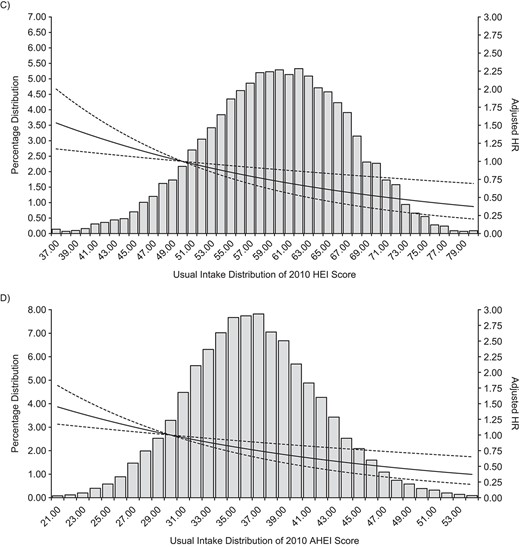
Continues
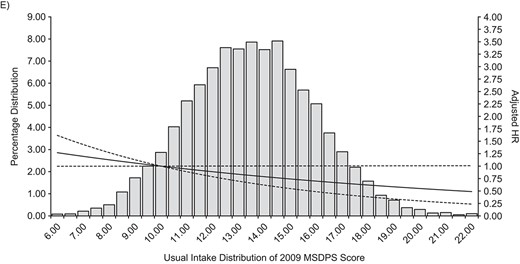
Weighted and multivariable-adjusted hazard ratios (HRs) and bootstrapped 95% confidence intervals (CIs) of usual intake distribution of 5 dietary quality index scores for all-cause mortality, Canadian adults in Canadian Community Health Survey—Nutrition linked to Canadian Vital Statistics Death Database, 2004/2005 to 2011. A) Dietary Guidelines for Americans Adherence Index 2015 (DGAI); B) Dietary Approaches to Stop Hypertension 2017 (DASH); C) Healthy Eating Index 2010 (HEI); D) Alternative Healthy Eating Index 2010 (AHEI); E) Mediterranean Style Dietary Pattern Score 2009 (MSDPS). For all panels: Weighted and error-adjusted histogram of the usual intake distribution of the dietary quality index score, with solid line representing the weighted and multivariable-adjusted HR from the regression calibration (Cox proportional hazards model) and dashed line representing the 95% CI calculated by bootstrapping the models estimating usual intake (B = 500 times at each step). Weighted n = 11,313,844 (unweighted n = 9,174); weighted number of deaths: 900,182.7 (unweighted n = 1,070); weighted person-years = 81,754,462.1 (unweighted person-years: 65,175.1). Reference standard was the median (mid-value) of quintile 1. For all dietary quality index scores, except DASH—(A), (C), (D), and (E): 45 ≤ age group ≤ 80 years, adjusted for day of the week on which 24-hour dietary recall was collected (weekday/weekend (Friday–Sunday)), sequence of dietary recall (first or second), baseline age (continuous) and sex, education (less than secondary school graduation; secondary school graduation; some postsecondary; postsecondary graduation), smoking (daily/occasional smoker with 20 ≤ cigarettes/day < 90; daily/occasional smoker with <20 cigarettes/day; former daily/occasional smoker and those who smoked a total of ≥100 cigarettes in lifetime; never smoked), physical activity (daily energy expenditure ≥3; 1.5 ≤ daily energy expenditure < 3; and 0 ≤ daily energy expenditure < 1.5), marital status (married/common-law partner; widowed/separated/divorced/single; never married) and immigrant (yes/no), diagnosis of diabetes (yes/no), cancer (yes/no), heart disease (yes/no), body mass index (underweight; normal-weight; overweight; obese). For DASH—(B): 45 ≤ age group ≤ 80 years, adjusted as for other indexes, with the addition of alcoholic beverage consumption (over the past 12 months: 0 drinks; less than 1–3 times per month; 1–3 times per week; 4–7 times a week or being binge drinker: drank >2 times per week with the frequency of ≥5 drinks being 1 or more times per week). AHEI and MSDPS—(D) and (E)—scoring algorithms do not directly consider energy and therefore usual intake distribution and regression calibration was conducted estimating a bivariate distribution of AHEI/MSDPS with energy intake, after winsorizing outliers of energy intake.
Association between diet patterns and all-cause mortality
Table 3 and Figure 1 present the weighted and multivariable-adjusted HRs and 95% CIs for the association of the 5 diet quality indexes with all-cause mortality in predefined sensitivity analyses. Median scores for all indexes, particularly 2009 MSDPS, fell short of the maximum attainable value even at the 90th percentile of the population. Comparing the 90th with the 10th percentile, for DGAI (score of 9.3 versus 6.6 out of 19), there was a 49% lower risk (HR = 0.51, 95% CI: 0.33, 0.79; Figure 1A and Table 3). Similarly, higher conformity to the DASH (15.08-point increment), HEI (18.81-point increment), and AHEI (13.61-point increment) dietary patterns was associated with reduced mortality risk (51%, 46%, and 43% reduction, respectively). The multivariable-adjusted HR for MSDPS, which had the lowest compliance rate of the indexes, was 0.68 (95% CI: 0.47, 1.00). Sex-stratified, multivariable-adjusted HRs for the association of 5 dietary quality index scores and all-cause mortality are available in Web Table 4 and Web Figure 1. However, it is notable that sex stratification generated unstable results (lack of convergence among women), which may be due to a slightly lower event rate (14.5 events per 1,000 person-years for women and 15.5 events per 1,000 person-years for men) and less power in this group; therefore, in the present research, further analyses were focused on total models.
The sensitivity analysis looked at chronic diseases as effect modifiers. In participants with no chronic conditions at baseline, for HEI there was a 35% lower risk (HR = 0.65, 95% CI: 0.44, 0.96), for AHEI there was a 49% lower risk (HR = 0.51, 95% CI: 0.38, 0.70), and for DASH there was a 36% lower risk (HR = 0.64, 95% CI: 0.43, 0.95) of all-cause mortality at the 90th compared with the 10th percentile. In participants with heart disease at baseline, for DGAI there was a 47% lower risk (HR = 0.53, 95% CI: 0.32, 0.87) and for DASH there was a 48% lower risk (HR = 0.52, 95% CI: 0.30, 0.93) of all-cause mortality at the 90th compared with the 10th percentile (data not shown). For the remaining sensitivity analyses with these interaction terms (with each chronic disease at baseline or with no chronic disease at baseline), the dietary patterns were not significantly associated with all-cause mortality.
As an additional sensitivity test, we analyzed the data using the first 24-hour dietary recall only (Web Table 5). We found the association between diet quality index scores and all-cause mortality to be attenuated and inconsistent, which is expected due to the presence of within-person variation (random error) when using a single-day 24-hour recall.
To determine whether the time to death was different between groups adherent and nonadherent to dietary recommendations, we compared their Kaplan-Meier plots for all-cause mortality (Web Figure 2). Survival rates were lower among individuals who achieved less than 50% of the 2015 DGAI, 2017 DASH, and 2010 HEI recommendations, compared with those who achieved 50% or more of the recommendations.
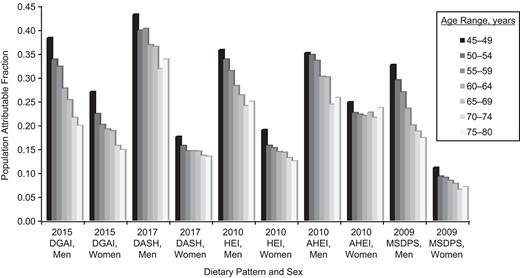
Weighted and multivariable-adjusted population attributable fraction (PAF) attributed to poor dietary patterns among Canadian adults in Canadian Community Health Survey–Nutrition Linked to Canadian Vital Statistics Death Database, 2004/2005 to 2011. PAF was calculated by comparing the present distribution of dietary pattern score with the theoretical-minimum-risk (90th percentile of usual dietary pattern score as an achievable target) exposure using continuous PAF formula (relative risk in 1 year). Weighted n = 11,313,844 (unweighted n = 9,174); weighted number of deaths: 900,182.7 (unweighted n = 1,070); weighted person-years = 81,754,462.1 (unweighted person-years = 65,175.1). Adjusted for day of the week on which 24-hour dietary recall was collected (weekday/weekend (Friday–Sunday)), sequence of dietary recall (first or second), baseline age (continuous) and sex, education (less than secondary school graduation; secondary school graduation; some postsecondary; postsecondary graduation), smoking (daily/occasional smoker with 20 ≤ cigarettes/day < 90; daily/occasional smoker with <20 cigarettes/day; former daily/occasional smoker and those who smoked a total of ≥100 cigarettes in lifetime; never smoked), physical activity (daily energy expenditure ≥3; 1.5 ≤ daily energy expenditure < 3; and 0 ≤ daily energy expenditure < 1.5), marital status (married/common-law partner; widowed/separated/divorced/single; never married) and immigrant (yes/no). For Dietary Approaches to Stop Hypertension (DASH), adjusted exactly as for other indexes, with the addition of alcoholic beverage consumption (over the past 12 months: 0 drinks; less than 1–3 times per month; 1–3 times per week; 4–7 times a week or being binge drinker: drank >2 times per week with the frequency of ≥5 drinks being 1 or more times per week). Alternative Healthy Eating Index (AHEI) and Mediterranean Style Dietary Pattern Score (MSDPS) scoring algorithms do not directly consider energy and therefore usual intake distribution and regression calibration was conducted estimating a bivariate distribution of AHEI and MSDPS with energy intake, after winsorizing outliers of energy intake. DGAI, Dietary Guidelines for Americans Adherence Index; HEI, Healthy Eating Index
Mortality and life expectancy lost, attributable to dietary pattern
At the national level, a range from 26.5% (MSDPS) to 38.9% (DASH) of all-cause mortality burden among men and from 8.9% (MSDPS) to 22.9% (AHEI) among women was attributable to poor dietary patterns (Figure 2). There was an attenuation in the proportion of deaths attributable to poor dietary patterns with increasing age, with Canadians aged 45–49 years experiencing a higher proportion of deaths attributable to poor dietary patterns, compared with those aged 75–80 years (e.g., total population attributable fraction in men: 38.21% vs. 19.84% for DGAI, and 43.12% vs. 33.71% for DASH). By the end of follow-up, there was a weighted estimate of 900,182 deaths in Canada, of which 224,635 deaths were attributable to poor dietary patterns (age-adjusted average of 5 indexes) (estimated average population attributable fraction: 31.01% in men and 16.38% in women; Web Figure 3).
Figure 3 shows 5.21–8.02 (men) and 1.6–4.1 (women) years of life expectancy difference, when comparing individuals following healthy dietary patterns (90th percentile of score) with those with unhealthy exposures (10th percentile of score). For example, if Canadians followed healthier dietary patterns recommended in DASH, Canadian average life expectancy could increase from 79.6 to 83.7 years for men and from 83.7 to 85.1 years for women. Figure 4 shows 2.14–4.07 (men) and 0.97–2.44 (women) years of life expectancy gained in a hypothetical scenario of improving dietary patterns (i.e., improving dietary quality scores so the population meets the 90th percentile of the score as an achievable target). Web Figures 4 and 5 support these findings across the different age groups among men and women.
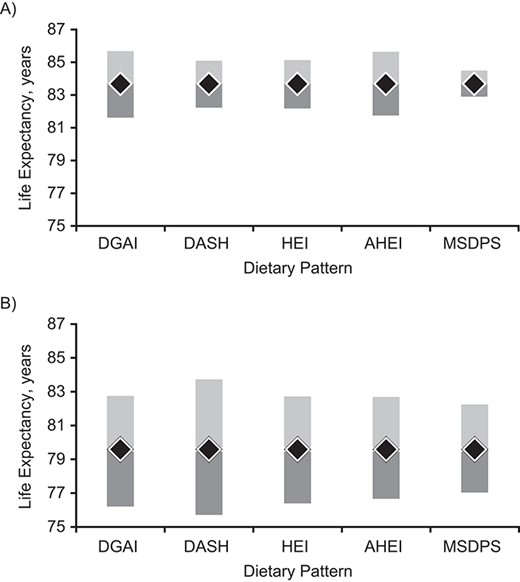
Life expectancy of Canadians associated with healthy dietary patterns (90th percentile of score) versus unhealthy exposure (10th percentile of score), relative to the average Canadian life expectancy (2004) for women (A) and men (B). Estimated using the abridged life table approach (Statistics Canada) and age and sex-specific crude mortality rates among Canadian adults in Canadian Community Health Survey–Nutrition Linked to Canadian Vital Statistics Death Database, 2004/2005 to 2011. Black diamonds represent average Canadian life expectancy. Light gray bars represent life expectancy to be gain associated with a healthy dietary pattern. Dark gray bars represent life expectancy to be lost associated with an unhealthy dietary pattern. AHEI, Alternative Healthy Eating Index; DASH, Dietary Approaches to Stop Hypertension; DGAI, Dietary Guidelines for Americans Adherence Index; HEI, Healthy Eating Index; MSDPDS, Mediterranean Style Dietary Pattern Score.
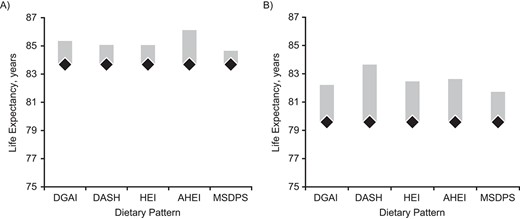
Life expectancy of Canadians gained of Canadians when moved from their current dietary patterns to the healthy dietary patterns (90th percentile of score) as an achievable target for women (A) and men (B), estimated using the abridged life table approach (Statistics Canada) and age and sex-specific crude mortality rates among Canadian adults in Canadian Community Health Survey–Nutrition Linked to Canadian Vital Statistics Death Database, 2004/2005 to 2011. Dietary pattern scores of individuals with scores ≥90th percentile were kept as is. Black diamonds represent average Canadian life expectancy. Light gray bars represent life expectancy to be gain associated with a healthy dietary pattern. AHEI, Alternative Healthy Eating Index; DASH, Dietary Approaches to Stop Hypertension; DGAI, Dietary Guidelines for Americans Adherence Index; HEI, Healthy Eating Index; MSDPDS, Mediterranean Style Dietary Pattern Score.
DISCUSSION
In this prospective, nationally representative survey, 27%–39% of all deaths in men and 9%–23% of all deaths in women were attributable to poor dietary patterns. This translates to an estimated 5.2–8.0 years (men) and 1.6–4.1 years (women) of life expectancy lost when comparing those with healthy versus poor dietary patterns. Even though individuals in the 90th percentile of the diet quality index scores had suboptimal dietary patterns, and there were relatively small intake differences that distinguished the 10th and 90th percentiles, survival benefit was greater for higher scores on all diet quality indexes, suggesting that even greater health improvements could be achieved with improved dietary patterns.
Although a number of previous cohort studies have confirmed consistent inverse associations between dietary quality indexes and all-cause mortality (20, 36), the samples have not been nationally representative, and results have been prone to selection bias. Additionally, the inherent limitations of RCTs on this topic (e.g., placing participants on the most “ideal” dietary pattern is challenging to implement at the population level) limits the generalizability of their findings and their translation to public and population health policies. Our findings confirm, at the population level, those presented by the DPMP researchers in 5 US cohorts—where high diet quality reduced all-cause mortality risk by 18%–26% in women and 17%–25% in men (10). Differences in hazard estimates may reflect differences in the ascertainment of diet (i.e., two 24-hour dietary recalls in our study vs. a single food frequency questionnaire in DPMP), ascertainment of all-cause mortality (i.e., national Canadian Vital Statistics Death Database in our study vs. cohort follow-up), population intakes (i.e., nationally representative vs. cohort sampling), indexes used (2017 DASH and 2009 MSDSP in our study vs. population intake-based indexes used in DPMP), and analysis (continuous exposure in our study vs. categorical in DPMP). Furthermore, measurement error may have attenuated hazard estimates in previous cohort studies (33, 37), while full consideration was given for addressing random and systematic errors in the present study by estimating variance using bootstrap balanced repeated replication technique (38, 39), usual intake distributions using the National Cancer Institute’s method (25, 26), and identifying and including misreporting status as a covariate (Web Appendix 1).
In our study, except for the MSDPS, there was similar life expectancy gain and reduction in all-cause mortality risks across dietary patterns. Overall, this suggests that foods can be combined in various ways to achieve a healthful dietary pattern (21, 40). That stated, the conflicting Mediterranean diet results warrant discussion. Variability in the indexes used to ascertain adherence to a Mediterranean dietary pattern (14, 40–43) contributes to confusion in interpreting results across studies. However, our results are consistent with studies conducted in other non-Mediterranean regions, including Australia and Sweden (41, 44, 45). Studies have suggested that differences in eating habits between Mediterranean and non-Mediterranean populations may make the Mediterranean diet scoring systems less applicable in other regions (46, 47). Other lifestyle factors—such as the social structure of meals, culinary practices, taking a siesta—that are intrinsic practices of Mediterranean populations following traditional lifestyles and are not common in other regions (and are often ignored in epidemiologic surveys) may also confound the association between this dietary pattern with health outcomes.
Our study has several strengths, including using a national nutrition survey linked to vital statistics to eliminate the problem of participant loss to follow-up. Additionally, we addressed several often ignored methodologic challenges, including comprehensive step-wise sensitivity analyses of prespecified models, confounder adjustment, and handling of both random and systematic measurement errors in dietary intake data (34). Our use of repeated 24-hour dietary recalls (and that recalls are explicitly designed to estimate absolute intakes at the population level), instead of a single food frequency questionnaire, is a major strength of this study. In the CCHS-Nutrition, 24-hour dietary recalls were collected by skilled interviewers, making intake estimates comparable to those from a diet record (48, 49). This research provides an analytical framework for national nutrition surveys using repeated 24-hour dietary recalls when analyzing health and health-care outcomes. Population estimates of the diet-attributable mortality and life expectancy informs public and nutrition policy by raising awareness of the health burden of dietary patterns. Comparing attributable risks informs priorities and policies that are designed to improve health and reduce inequities (16, 17).
The findings of this study should be considered in light of its limitations. Even though assigning a penalty for overconsumption of energy-dense foods and giving weights by the proportion of energy intake from the Mediterranean diet pyramid are strengths of the 2009 MSDPS, the dominant Canadian dietary pattern—high in fast foods, carbonated drinks, refined grains, solid fat, and processed meat (15, 21, 50–54)—resulted in lower scores and reduced sensitivity and specificity. The lower event rate among women caused convergence errors for our sex-stratified models. Additionally, the female sample’s homogeneity and closer adherence to dietary guidelines (influencing relative estimates) (55) may, in part, explain the weaker association of dietary quality indexes and all-cause mortality for women compared with men (55). That stated, evidence of sex differences in the association of diet quality indexes and mortality is mixed (7), warranting further investigations.
In conclusion, our findings suggest that poor dietary pattern is the leading risk factor for loss of life years at the national level, exceeding previous population attributable fraction estimates for smoking, physical activity, and alcohol consumption (56). Since the survival benefits of compliance with different dietary indexes were similar despite their differences in defining a healthy dietary pattern, these results support the growing notion for moving away from the “one diet fits all approach” (57). The significant reductions in all-cause mortality risk associated with each percentile of the dietary quality indexes support the evidence that even minor improvements in dietary pattern may have meaningful health benefits in terms of longevity. These findings call for evidence-based nutrition policies focusing on overall dietary patterns (57) as the most influential lifestyle factor to narrow the gap in life expectancy between North American countries and other industrialized countries with longer life expectancy.
ACKNOWLEDGMENTS
Author affiliations: Food, Nutrition and Health Program, Faculty of Land and Food Systems, The University of British Columbia, Vancouver, British Columbia, Canada (Mahsa Jessri); Centre for Health Services and Policy Research (CHSPR), School of Population and Public Health, Faculty of Medicine, The University of British Columbia, Vancouver, British Columbia, Canada (Mahsa Jessri); Clinical Epidemiology Program, Ottawa Hospital Research Institute, Ottawa, Ontario, Canada (Mahsa Jessri, Carol Bennett, Douglas Manuel); School of Epidemiology and Public Health, University of Ottawa, Ottawa, Ontario, Canada (Mahsa Jessri); Health Analysis Division, Statistics Canada, Government of Canada, Ottawa, Ontario, Canada (Mahsa Jessri, Deirdre Hennessey, Claudia Sanmartin, Douglas Manuel); Institute for Clinical Evaluative Sciences, Ottawa, Ontario, Canada (Anan Bader Eddeen, Carol Bennett, Douglas Manuel); Department of Family Medicine, University of Ottawa, Ottawa, Ontario, Canada (Douglas Manuel); and C. T. Lamont Primary Health Care Research Centre Program, Bruyère Research Institute, Ottawa, Ontario, Canada (Douglas Manuel).
This work was supported by funding from Statistics Canada API (#2016), Canadian Institutes of Health Research (#378193), Canadian Institutes of Health Research Banting Fellowship (#355644 to M.J.), and a Canadian Institutes of Health Research Fellowship (#358986 to M.J.), and Banting Discovery Award (#2019-1406 to M.J.). M.J. is supported through the Canada Research Chair Program.
Canadian Community Health Survey, Nutrition, 2004 and the Canadian Vital Statistics Death Database, 2004/2005 to 2011, are available for use at Statistics Canada Data Research Centers.
We thank our affiliations, including the Clinical Epidemiology Program at the Ottawa Hospital Research Institute, the School of Epidemiology and Public Health at the University of Ottawa, the Faculty of Land and Food Systems at the University of British Columbia, the Health Analysis Division at Statistics Canada, the Institute for Clinical Evaluative Sciences, the Department of Family Medicine at the University of Ottawa, and the C. T. Lamont Primary Health Care Research Centre Program at the Bruyère Research Institute. We also thank Dr. Meltem Tuna at the Institute for Clinical Evaluative Sciences, University of Ottawa, and Dr. Monica Taljaard at Ottawa Hospital Research Institute, University of Ottawa, for providing mathematical guidance and insights. Alena Ng contributed to macros for usual intake distributions.
Presented at the 2018 International Population Data Linkage Conference, September 12–14, 2018, Banff, Alberta, Canada. Accepted for presentation at 2022 American College of Epidemiology Annual Meeting, September August 11, 2022, Scottsdale, Arizona.
The views expressed in this article are those of the authors and do not reflect those of the funders.
Conflict of interest: none declared.

